INVESTIGATIONS AND RECENT RESULTS ON FLUTES WITH PIV
A. Bamberger
PACS REFERENCE: 43.75.Ef
Fakultät für Physik der Albert-Ludwigs-Universität Freiburg Hermann-Herder-Str. 3
79104 Freiburg Germany
Tel: +49 761 203 5714 Fax:+49 761 203 5931
E-mail: [email protected]
ABSTRACT
Recently the jet of flutes and flute like instruments is investigated by Particle Image Velocimetry (PIV). There are a number of quantities of the velocity field which can be derived using this technique, e.g. the vorticity. The acoustic wave at the embouchure is also measured by external excitation through a speaker system. Based on Lighthills theory and following M. Howe's treatment the acoustical power can be deduced from locally measured source terms. The result shows that some fraction of the acoustical power of the flute must be attributed to this term.
INTRODUCTION
The flue instruments are investigated since quite a time with respect to the sound mechanism [1]. Various methods have been employed in order to measure the characteristics of the jet. There are visualisation methods (smoke visualisation, Schlieren method) as well as anemometric measurements (hot wire anemometry and laser Doppler anemometry). Lately the Particle Image Velocimetry (PIV) [2] has been developed and applied to acoustic systems. This method has several advantages as being flexible and quantitatively measuring velocity fields. Data taking is fast and results in a good overview.
For the first time PIV has been used for the quantitative determination of the velocity field of the jet in flutelike instruments [3]. An advantage of the method is the high dynamic range which allows to measure the acoustical displacement. The paper describes the method, the measurements and the evaluation in terms of the vorticity, which finally allows the determination of the acoustical source strength associated with the vortex shedding.
EXPERIMENTAL SETUP
Normal operation
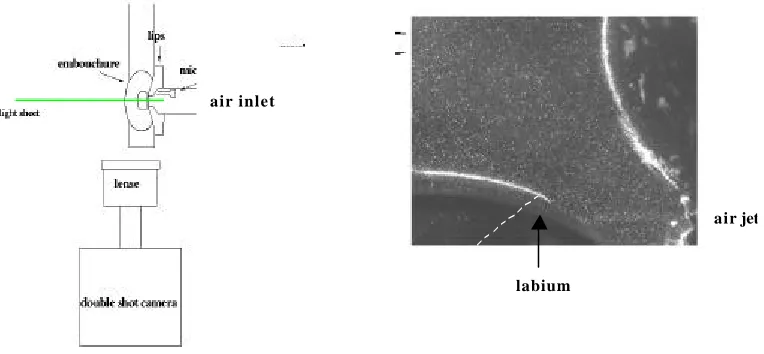
An overview of the experimental set up is given in figure 1. The main elements are the flute, air supply with seeding, laser system and the video camera.
For this investigation the flute is operated through an artificial mouth formed of silicon cautchouc. As the form of the lips might matter, they are modelled as well. The flue is made of
0.5 mm Al sheet with an opening of 0.9 mm∗9 mm, the length is 5 mm with carefully rounded
[image:2.596.96.478.104.281.2]
Figure 1: The set up for the experiment (top) Figure 2: Embouchure and upper lip
The PIV system is composed of a twin head frequency doubled NdYAG laser, a double exposure video camera and a timing control board (ILA-Systems). The air from a bottle is mixed with air loaded with oil droplets of about 10µ diameter.
In figure 2 the region of interest as seen by the camera. The air jet comes from the right. The laser light sheet illuminates the embouchure and the upper lip. For the measurements a slightly downward tilted angle of the camera is chosen. Therefore the view into the volume just below the labium is only partially obstructed due by rim of the hole. The chimney joining the embouchure with the flute head is indicated by the broken line.
Special care is taken to homogenise the seeded air: The volume around the flute head is confined by a box in order to load also the entrained air with seeding. The jet interacts at a distance of 5.5 mm with the labium.
A microphone inserted into the flute body is used as trigger and pressure measurement. The timing is referenced to the zero crossing of the pressure amplitude. The flute is operated at a sounding frequency of 1170 Hz corresponding to the fingering of D5. For this investigation the body of the flute is replaced by a plastic tube of the same thickness in order to accommodate the acoustical wave measurement.
The flute is operated at a jet speed of about 30 m/s. The system yields a pressure amplitude of 210 Pa.
For data taking the phase is changed through a delay by steps of 1/16 of the period,
corresponding to a time interval of 53µs or 22°. Five shots are made at a given phase for
averaging the velocity field.
Operation for the acoustical wave
For the measurement of the acoustical wave the open end of the flute is inserted into the narrow end of an exponential horn, which is coupled to a speaker. The system is adjusted to have a resonance near the 1170 Hz. The driving amplitude of the speaker is as well adjusted to the value of the pressure of the normal operation. Before the PIV measurement of the acoustic wave the jet is operated for some time in order to fill the box with seeding and then switched off during data taking.
air inlet
airjet
DATA ANALYSIS
The cross correlation is evaluated in an interrogation area of 32x32 pixels with an overlapping area of 16x16 with the next neighbours. The velocity field is sampled in steps of 0.14 mm. The validation included a signal to noise ratio of 1.02. Wrong reconstructed velocity vectors are replaced by weighting of 8 neighbours. Finally, the reconstructed velocity fields are averaged over the number of exposures at a given phase.
RESULTS
[image:3.596.88.509.249.566.2]In figure 3 the velocity field at two representative phases is displayed, left side the normal operation, right side the acoustical velocity field. The jet is seen coming from right. The upper lip and the embouchure is outlined by ”zero'' velocity vectors, as can be seen for the acoustical field.
Figure 3: The velocities at normal operation (left) and the acoustical field (right) at two different phases. On top: vortex shedding (Phase 16 = +55µs), bottom: Acoustical velocity near zero (Phase 5=+350µs).
In the upper left part of the figure 3 the jet is transversely moving into the flute after having crossed the labium. A vortex is seen above the labium. In lower part right side of the figure 3 the jet moves up again and the vortex is dissipated. The corresponding acoustical field is seen in at the right side at the same phases: maximum amplitude is of about 3 m/s into the flute and at the second phase zero amplitude of the acoustical field. As will be shown later the main acoustical source strength occurs in this phase interval.
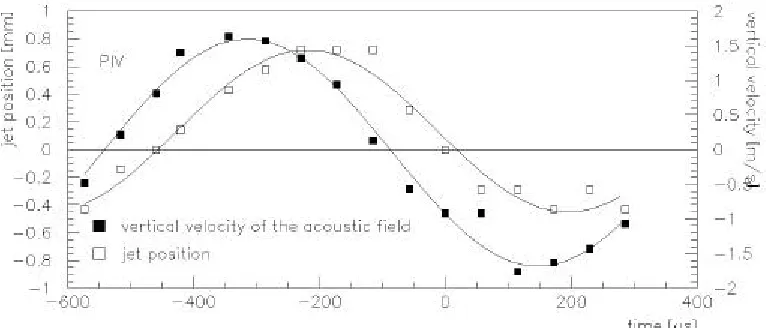
In order to relate the acoustical field with the jet movement, its average velocity and the jet position have been evaluated at a distance of 2.6 mm distance from the flue exit. The figure 3 displays the whole phase: The acoustical field (vertical component) is ahead of the jet position by about 37°.
Figure 3: The position of the jet and the vertical component of the acoustical velocity.
It is worth mentioning that the jet velocity is also modulated with a change of the amplitude of about 20% peaking at the phase of the vortex shedding [3].
EVALUATION OF THE SOURCE TERMS
As has been stated by M. Howe [4] the source terms for the acoustical power can be derived using Lighthills theorem. The sound source is generated through the Coriolis force density multiplied with the local acoustical flow velocity described by the unsteady part of the potential flow of the velocity field. Here the experimental values of the vorticity, jet speed and the acoustical field are used. The underlying assumption is that the acoustical field in the normal operation is small as compared with the jet speed and velocities of the immediate environment; it is of the order of 1/10. To this extend the extracted power is an approximated value.
The source strength is given by
U
v
dVdt
T
P
=
−
ρ
air1
∫∫ ×
(
Γ
jet)
⋅
a (1)where
P : power (positive means produced by the system) ρair : density of air
T : period of the cycle Γ : vorticity
Ujet: velocity given at the vorticity
va : velocity of the acoustical field
V : integration volume.
The vorticity is calculated in field of 3x3 velocity vectors and seen in figure 4 for the phase at 55µs. The plotted value is scaled down by a factor 103. Also seen is the power density (in units
of about 1mW/cm3) as given in the argument of the integral of relation (1). The region of
Figure 4: Vorticity (left) and the power density (right).
The instantaneous power as a function of the phase is displayed in figure 5. The value is obtained with the integration volume indicated in the figure 4 and with a depth of 9 mm corresponding to the jet extension perpendicular to the light sheet. There is a pronounced peak at a phase of 40° (+100 µs) with respect to the crossing of the jet at the labium. It is positive which means that this region produces acoustical power.
Figure 5: The acoustical power due to vortex shedding as function of the phase
If the power is averaged over the cycle a value of +0.9 mW is obtained. This value may be compared with the total power dissipation.
DISCUSSION
There are the following remarks in order. The velocity of the jet is rather high for the pressure amplitude produced in the flute. The power associated with the jet itself having a velocity of 30 m/s is 148 mW. However, given the acoustical pressure amplitude in the experiment, the power associated with it can be estimated to be 50 mW. A fraction of about 2% can be attributed to the vortex shedding.
CONCLUSION
The velocity field of the jet and its environment is investigated with the Particle Image Velocimetry. The measurement of the acoustical field near the embouchure at the same pressure in the flute body allows the estimation of the power of the sources terms near the labium. A sizable value can be deduced emphasising the importance of vortex shedding in the sound production of the flute.
REFERENCES:
[1] B. Fabre and A. Hirschberg,
Physical Modeling of Flue Instruments: A Review of Lumped Models
ACOUSTICA Vol. 86, 599-610 (2000)
[2] M. Raffelt, Ch. C. Willert, and J. Kompenhans,
Particle image velocimetry: A practical guide Berlin: Springer 1998
[3] A. Bamberger and S. Schaudel
Investigations on the Flute with Hot Wire Anemometry and Particle Image Velocimetry ICA 2001, Rome, September 3, 2001
[4] M. S. Howe