http://journals.tubitak.gov.tr/earth/ © TÜBİTAK
doi:10.3906/yer-1104-9
Magmatic processes at the volcanic front of Central Mexican Volcanic Belt:
Sierra de Chichinautzin Volcanic Field (Mexico)
Fernando VELASCO-TAPIA1,*, Surendra P. VERMA2
1 Facultad de Ciencias de la Tierra, Universidad Autónoma de Nuevo León, Ex-Hacienda de Guadalupe,
Carretera Linares-Cerro Prieto km 8, Linares, N.L., 67700, Mexico
2 Departamento de Sistemas Energéticos, Centro de Investigación en Energía, Universidad Nacional Autónoma de México,
Privada Xochicalco s/n, Col. Centro, Temixco, Mor., 62580, Mexico
1. Introduction
The theory of plate tectonics has provided a framework for the study of the different styles and geochemical characteristics of past and present igneous activity (Stock 1996; Kearey et al. 2009). At least four distinct tectonic environments have been established in which magmas may be generated. These are: (a) destructive plate margin setting (island and continental arcs), (b) continental intra-plate setting (extensional and rift zones), (c) oceanic intra-plate setting (ocean islands), and (d) constructive plate margin setting (mid-ocean ridges and back-arc spreading centres). However, despite deviations from the conventional rigid plate hypothesis (vertical motions, deformation in plate interiors or limitations on the sizes of plates; Stock 1996; Keith 2001), an unambiguous petrogenetic-tectonic model, though very much needed, is difficult to establish in tectonically complex zones, such as the Mexican Volcanic Belt (MVB, Figure 1).
The MVB is a major province, about 1000 km long and 50–300 km wide, of Miocene to present-day volcanism in southern Mexico (e.g., Robin 1982; Gómez-Tuena
et al. 2007a). It has also been called a large igneous
province (LIP, Sheth 2007). It comprises more than 8000 individual volcanic structures, including stratovolcanoes, monogenetic cone fields, domes and calderas (Robin 1982). Uniquely, the MVB is oriented at an angle of about 15–20° with respect to the Middle America Trench (MAT, Figure 1, Molnar & Sykes 1969). In particular, in the central MVB (C-MVB) continuing subduction of the Cocos oceanic plate under the North American continental plate and the subalkaline character of most of the lavas, a classic subduction-related magmatic arc model has been suggested as appropriate. However, several geological, geophysical and geochemical features of the C-MVB pose problems with this simple model and have motivated a debate about the magma genesis and origin of this controversial magmatic province (e.g., Shurbet & Cebull 1984; Márquez et al. 1999a; Verma 1999, 2000, 2002, 2004, 2009; Sheth et al. 2000; Ferrari et al. 2001; Ferrari 2004; Blatter et al. 2007; Mori et al. 2009).
A basic problem of the subduction hypothesis is related to the lack of a well-defined Wadati-Benioff zone (Pacheco Abstract: The Sierra de Chichinautzin (SCN) volcanic field is considered one of the key areas to understand the complex petrogenetic
processes at the volcanic front of the Mexican Volcanic Belt (MVB). New as well as published major- and trace-element and Sr and Nd isotopic data are used to constrain the magma generation and evolution processes in the SCN. From inverse and direct modelling, combined 87Sr/86Sr and 143Nd/144Nd data, and use of multi-dimensional log-ratio discriminant function based diagrams and other
geological and geophysical considerations, we infer that mafic magmas from the SCN were generated by partial melting of continental lithospheric mantle in an extensional setting. Inverse modelling of primary magmas from the SCN further indicates that the source region is not depleted in high-field strength elements (HFSE) compared to large ion lithophile elements (LILE) and rare-earth elements (REE). The petrogenesis of evolved magmas from the SCN is consistent with the partial melting of the continental crust facilitated by influx of mantle-derived magmas. Generally, an extensional setting is indicated for the SCN despite continuing subduction at the Middle America Trench.
Key Words: geochemistry, subduction, extension, multi-dimensional discrimination diagrams, isotopes, inverse modelling, direct
modelling
& Singh 2010 and references therein). The volcanic front of the C-MVB is about 300 km from the MAT (Verma 2009) whereas, in spite of numerous attempts and a very dense seismic network, the subducted Cocos plate is seismically poorly defined beyond the Pacific coast of Mexico and can only be traced to about 40 km depth at a distance of about 240 km from the trench (Pacheco & Singh 2010). Thus, the presence of the subducted slab can only be inferred from the MAT up to about 60 km away from the C-MVB volcanic front. Recently, subhorizontal subduction has been inferred by Pérez-Campos et al. (2008), Husker & Davis (2009), and Pacheco & Singh (2010) from seismic data obtained from a dense network. The quasi-horizontal subduction and a very shallow subducted slab (at most at about 40 km depth; Figure 5 in Pacheco & Singh 2010) are not thermodynamically favourable conditions for magma generation (Tatsumi & Eggins 1993). Husker & Davis
(2009) assumed a slab temperature model to interpret the seismic data and inferred tomography and thermal state of the Cocos plate, meaning that the results from this circular argument, especially the thermal regime, would depend directly on the basic assumptions. Futhermore, these authors ignored the geochemical and isotopic constraints for basic magmas from the C-MVB (e.g., Verma 1999, 2000, 2002, 2004; Velasco-Tapia & Verma 2001a, b). Similarly, Pérez-Campos et al. (2008) did not take into consideration these geochemical and isotopic constraints in their geological interpretation of the seismic data.
The diminution or even cessation of arc-related volcanism observed in the south-central Andes has been related to subhorizontal subduction of the Nazca plate (Kay et al. 1987; Martinod et al. 2010). Steeper subduction angles are commonly observed in many arcs (Doglioni
et al. 2007; Schellart 2007). For example, average slab
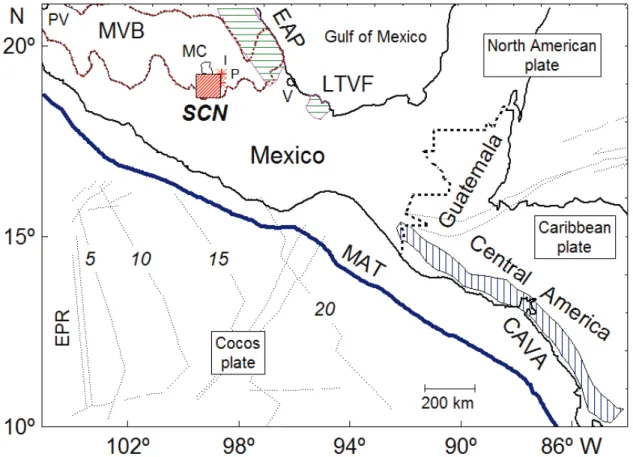
Figure 1. Location of the Sierra de Chichinautzin (SCN) volcanic field at the volcanic front of the central part of the
dip angles in the Tonga, Kermadec, New Hebrides and Marianas arcs vary from about 50° to almost 90° (Schellart 2005).
Unlike the south-central Andes and in spite of the peculiarities of subhorizontal subduction and an undefined Benioff zone, widespread volcanism occurs along the entire MVB. Extrapolation of the subducted Cocos plate to greater depths, without any solid seismic evidence, was proposed to overcome this problem (Pardo & Suárez 1995; Pérez-Campos et al. 2008), although this solution has already been criticized in the literature (Sheth
et al 2000; Verma 2009). The slab is imagined to be broken and to plunge vertically into the mantle and, interestingly, it is done artificially, without any direct seismic evidence, after bringing it close to the volcanic front of the C-MVB (Pérez-Campos et al. 2008; Husker & Davis 2009).
In a magnetotelluric study of southern Mexico (two-dimensional inversion) by Jödicke et al. (2006), fluid release from the subhorizontal subducted Cocos plate and consequent partial melting of the crust beneath the MVB were inferred to explain the volcanism. Several questions remain to be answered, such as the inadequacy of a two-dimensional solution of a clearly three-two-dimensional Earth, which are as follows: (i) the assumption of the presence of subducted slab beneath the MVB without any seismic evidence; (ii) the release of subduction fluids from the plate at 40 km depth (this extremely shallow depth is now inferred by Pacheco & Singh 2010) and their subhorizontal travel through 60 km to the MVB volcanic front; and (iii) the inability of the magnetotelluric model to explain the presence of SCN mafic magmas presumably derived from the lithospheric mantle (Verma 2000, 2002, 2004; Velasco-Tapia & Verma 2001a, b). Why could the fluids not have originated either in the lithospheric mantle or in the continental crust, or both? Sheth et al. (2000) proposed that the mantle beneath the MVB is heterogeneous and contains kilometre-scale domains of vein-free peridotite and peridotite with veins of phlogopite or amphibole, or both phases, which could release the required fluids. This could be a more plausible model in the light of the most recent seismic evidence and interpretation (Pacheco & Singh 2010).
The study of mafic rocks located along the entire MVB has revealed rift-like isotopic and geochemical signatures, associated with partial melting of an upwelling heterogeneous mantle source and eruption of magma in an extensional setting with incipient or well-established rifting (e.g., Luhr et al. 1985, 1989; Verma 2009; Luhr 1997; Márquez et al. 2001; Velasco-Tapia & Verma 2001a, b). Alternative hypotheses also suggested to explain the origin of the MVB volcanism, include those related to a plume model (Moore et al. 1994; Márquez et al. 1999a), to extensional tectonics (Sheth et al. 2000; Márquez et al.
2001; Velasco-Tapia & Verma 2001a, b), or to detachment of the lower continental crust (Mori et al. 2009).
In this context, the Sierra de Chichinautzin volcanic field (SCN, Figure 2; Márquez et al. 1999a, b; Wallace & Carmichael 1999; Velasco-Tapia & Verma 2001a, b; Meriggi et al. 2008) represents one of the key areas in which to study the origin and evolution of the magmatism within the MVB for the following reasons: (1) the SCN marks the front of the central MVB (Figure 1) and, if the volcanism is related to subduction, the geochemistry of all rocks should display clear relationships with the subducted Cocos plate (see Verma 2009); (2) 14C age determinations of palaeosols and organic matter interbedded between SCN volcanics have always given ages younger than 40,000 years (Velasco-Tapia & Verma 2001a) and consequently, the processes related to the origin of magmas could still be active beneath this area; (3) the geochemical and Sr, Nd, and Pb isotopic composition of the descending slab is known in this part of the trench from previous studies (Verma 2000); (4) new multi-dimensional tectonic discrimination diagrams based on log-ratio transformed variables with statistically correct methodology (Aitchison 1986) and linear discriminant analysis (LDA) are available for the discrimination of four main tectonic settings (see Verma 2010); and (5) a wide variety of magmas from basalt and trachybasalt to dacite and trachydacite exist (Velasco-Tapia & Verma 2001b), which enable us to investigate the geochemical and isotopic characteristics of the magmatic sources as well as processes controlling the magmatic evolution.
To improve our understanding of the processes controlling the origin of magmas in the SCN volcanic field, we compiled new as well as published geochemical and isotopic data on rocks that cover the compositional range observed in this monogenetic field. The compiled rocks were classified into different geochemical types applying the total-alkali versus silica (TAS) diagram (Le Bas et al.
1986) in the correct way, i.e., after adjusting Fe-oxidation ratio (Middlemost 1989) on an anhydrous basis and to 100 %m/m, and were grouped according to their phenocryst assemblages. We used our extensive geochemical and isotopic database to evaluate different petrological mechanisms for the origin and evolution of the diversity of SCN magmas. We also resorted to inverse modelling of primary magmas to establish the source characteristics, as well as direct modelling of all SCN magmas to infer the petrogenetic processes.
2. Sierra de Chichinautzin: geological setting
1989; Mooser et al. 1996; Márquez et al. 1999b; García-Palomo et al. 2000; Siebe et al. 2004; Meriggi et al. 2008).
A calcareous marine to shelf facies sequence was deposited in central Mexico during the Cretaceous (Fries 1960). Rocks from this sequence include massive limestone with black chert lenses, beds of gypsum, massive to thickly bedded limestones, greywacke interbedded with limonite and shale beds. This ~3000-m-thick Cretaceous sedimentary sequence was folded and uplifted during the Laramide orogenic event (Fries 1960) and later intruded by granitic or granodioritic dykes dated at 50±10 Ma (De Cserna et al. 1974). The Eocene–Oligocene stratigraphy that overlies the Cretaceous sequence consists of calcareous conglomerates, lava flows, sandstones, volcanic siltstones, and lacustrine deposits up to 500 m thick.
The sedimentary sequence is unconformably overlain by about 38 to 7.5 Ma rhyolite, rhyodacite, dacitic lava flows and pyroclastic flow deposits (Morán-Zenteno
et al. 1998; García-Palomo et al. 2002), and by Pliocene to Holocene volcanism in Las Cruces, Ajusco and Chichinautzin (Delgado-Granados & Martin del Pozzo 1993). Late Pliocene to Early Pleistocene andesitic to dacitic flows and associated pyroclastic deposits of Las Cruces (Figure 2) are dated approximately at 3.6 to 1.8 Ma (Fries 1960; Sánchez-Rubio 1984; Mora Alvarez et al. 1991; Delgado-Granados & Martin del Pozzo 1993; Osete et al.
2000; García-Palomo et al. 2002). During the younger eruptive period, the Ajusco volcano (Figure 2) was formed by extrusion of several andesitic domes, one of which was dated at about 0.39 Ma (Mora Alvarez et al. 1991). Late Pleistocene–Holocene volcanic activity (<40,000 years; Bloomfield 1975; Córdova et al. 1994; Delgado et al. 1998; Velasco-Tapia & Verma 2001a) in central MVB has been named the Chichinautzin eruption period, characterised by monogenetic activity generating scoria cones and shield volcanoes with associated lava flows.
Figure 2. Trace of the Sierra de Chichinautzin (SCN) volcanic field and the schematic location of the sampling sites
The SCN (Figure 2) comprises over 220 Quaternary monogenetic volcanic centres, covering approximately 2400 km2 (98°40’–99°40’W, 18°30’–19°30’N; Márquez et
al. 1999b). Summit elevations in the SCN reach ~3700 m compared with ~2200 m elevation in the southern sector of the Basin of Mexico and ~1500 m in the Cuernavaca Basin (Wallace & Carmichael 1999). Márquez et al.
(1999b) pointed out that the SCN can be interpreted as the southernmost structural domain of a group of six parallel E–W-oriented tectonic structures, which show active N–S extension and a strike-slip component. The tectonic setting in the SCN has been confirmed, for example, by the analysis of focal mechanism of the Milpa Alta earthquake (very shallow depth of ~ 12 km), that was interpreted as an E–W normal faulting event with a significant (50%) sinistral strike-slip component (UNAM & CENAPRED Seismology Group 1995). Based on the interpretation of reflection seismic transects and detailed geologic mapping, Mooser
et al. (1996) recognised an Oligocene basin crossing the
SCN from N to S, called the Mixhuca basin. Additionally, these authors reported three other Pleistocene basins in the region (denominated by them from north to south as the Mexico, Tlalli-Santa Catarina and Chichinautzin-Izta-Malinche basins), with an inferred east–west orientation. These basins could represent a widespread manifestation of both E–W and N–S extension in the SCN area (Velasco-Tapia & Verma 2001b).
The central MVB is characterised by pervasive E–W normal faults with a left-lateral strike- slip component, some of which are seismically active (Johnson & Harrison 1990; Suter et al. 1992, 1995; Ego & Ansan 2002). Taking into account the geometry of regional graben-type structures, Márquez et al. (2001) suggested that extensional rates increase to the west. The tectonic scenario is complemented by active N–S to NNW-striking normal faults, related to the southern continuation of the Basin and Range Province (Henry & Aranda-Gomez 1992). The monogenetic volcanism in this part of the MVB appears to be related to E–W and N60°E-oriented extensional faults (Alaniz-Alvarez et al. 1998).
Extensional stress conditions in the SCN could provoke crustal weakening and facilitate the formation and eruption of monogenetic volcanoes. This model is consistent with geophysical observations indicating the existence of a low density (3.29 g/cm3) and low velocity (Vp= 7.6 km/s) mantle layer at the base of the crust (at ~40 km depth) beneath the central MVB (Molina-Garza & Urrutia-Fucugauchi 1993; Campos-Enríquez & Sánchez-Zamora 2000). A pronounced gravity low is observed over the entire MVB, and especially beneath its central region (< –200 mGal Bouguer anomaly; Molina-Garza & Urrutia-Fucugauchi 1993). Consequently, several authors (Fix 1975; Gomberg & Masters 1988; Molina-Garza &
Urrutia-Fucugauchi 1993) have suggested the existence of an anomalous low density, low velocity, partially molten mantle layer at the base of the crust (~40 km), being an atypical feature of continental arcs (Tatsumi & Eggins 1993). Additionally, Márquez et al. (2001) proposed a two-layer crustal stretching model (brittle and ductile domains) to explain the southward migration of volcanic activity. These layers are separated at an upper crustal level (depth ~10 km) by a zone of simple shear decoupling, at the brittle-ductile transition zone. The overall movement which occurs above this zone is southwards.
3. Analytical methods and results
SCN volcanic rocks were collected from outcrops or road-cuts, avoiding any possible alteration. Samples were jaw crushed and splits were pulverised in an agate bowl for geochemical analysis. Major elements were analysed in ten samples (Appendix A1) by X-ray fluorescence spectrometry (XRF) at Laboratorio Universitario de Geoquímica Isotópica (LUGIS)–UNAM. These measurements were carried out on fused glass discs using a Siemens sequential XRF SRS 3000 (with a Rh tube and 125 mm Be window) equipment. Sample preparation, measuring conditions, and other details about the calibration curves (applying a regression model considering errors on both axes) and precision and accuracy estimates were reported by Guevara et al. (2005). Precision for major elements ranged between 0.5 and 5%. Sixteen different geochemical reference materials (GRM) were run to assess the analytical accuracy, providing results within 1–10% of GRM recommended values.
Additionally, the major and trace element compositions of other twenty-five samples (Appendix A1 and A2) were determined by ActLabs laboratories, Canada, following the ‘4 LithoRes’ methodology. The sample was fused using a lithium metaborate-tetraborate mixture. The melt produced by this process was completely dissolved with 5% HNO3. Major elements were analysed in the resulting solution by inductively coupled plasma-optical emission spectrometry (ICP-OES), with an analytical accuracy of <6%. Trace element analyses were done by inductively coupled plasma-mass spectrometry (ICP-MS). The analytical reproducibility ranged between 5 and 12%.
Analytical data for minerals were obtained from thin-sections of selected samples, using the WDS JXA-8900 JEOL microprobe system of Centro de Microscopía Electrónica, Universidad Complutense de Madrid, Spain (Appendix A4–10). The experimental conditions were 15 kV and 20 nA, for establishing an electronic beam of ~1 mm. The apparent concentrations were automatically corrected for atomic number (Z), absorption (A), and fluorescence (F) effects internally in the ZAFJEOL software. The calibration of the microprobe system was carried out using reference minerals from the Smithsonian Institution (Jarosewich et al. 1980). The analytical accuracy was ~2% on average for each analysis.
The structural formula for each analysed mineral was estimated following a standard procedure that includes the calculation of atomic proportions of each element and the distribution of these proportions among the available sites in the silicate structure, with fixed number of oxygens (Deer et al. 1997). The problem of estimating Fe+3 content in spinels was solved by applying the stoichiometric criteria proposed by Droop (1987). Pyroxene and amphibole structural formulae were calculated using the computer programs developed by Yavuz (1999, 2001). However, compositional contrasts from core to rim were studied in zoned crystals by means of profile analysis and scanning probe microanalysis (SEM) images.
4. Database and initial data handling
New geochemical (major and trace element data; Appendix A1 and A2) and isotopic data (Appendix A3) for magmas from the SCN were compiled. Also included were data for mafic and evolved magmas reported previously by Swinamer (1989), Rodríguez Lara (1997), Delgado et al. (1998), Wallace & Carmichael (1999), Verma (1999, 2000), Velasco-Tapia & Verma (2001b), García-Palomo et al. (2002), Martínez-Serrano et al. (2004), and Siebe et al.
(2004). Thus, the database included information on 289 samples from the SCN.
Similarly, major and trace element data were also compiled for the Central American Volcanic Arc (CAVA, Figure 1) related to the subduction of the same Cocos oceanic plate beneath the Caribbean plate. This database enabled us to compare and contrast the geochemistry of the SCN with a classic arc (CAVA), particularly using the new log-ratio discriminant function based multi-dimensional diagrams (Verma et al. 2006; Verma & Agrawal 2011). The sources for these data were as follows: Carr (1984); Hazlett (1987); Reagan & Gill (1989); Carr et al. (1990); Walker
et al. (1990, 2001); Bardintzeff & Deniel (1992); Cameron
et al. (2002); Agostini et al. (2006); Alvarado et al. (2006); Bolge et al. (2006) and Ryder et al. (2006). Data from the rest of the MVB were not considered here, because they had been studied elsewhere (e.g., Verma 2009; Verma et al. 2011).
Rock classification was based on the total alkali-silica (TAS) scheme (Figure 3; Le Bas et al. 1986) on an anhydrous 100% adjusted basis and Fe2O3/FeO ratios assigned according to the rock type (Middlemost 1989). All computations (anhydrous and iron-oxidation ratio adjustments, and rock classifications) were automatically done using the SINCLAS computer program (Verma et al.
2002).
To compute and report central tendency and dispersion parameters, mean and standard deviation estimates were used after ascertaining that the individual parameter values were drawn from normal populations free of statistical contamination. To check this, a computer program was used to apply all single-outlier type discordancy tests at a strict 99% confidence level (DODESSYS by Verma & Díaz-González 2012).
5. Geochemical and mineralogical composition
This section presents the geochemical, isotopic (Appendix A1–3), and mineralogical (Appendix A4–10) characteristics of different types of SCN magmas (Figures 3–6). The interpretation of these data will be presented in the next section.
5.1. Mafic magmas
Approximately 15% of magmas that constitute the SCN database have (SiO2)adj < 53% and Mg# [100*Mg/(Mg + Fe+2)] = 64–72 (mafic magmas, M). Note that we are not using mafic magmas as synonymous of basic magmas, because the latter have been defined as (SiO2)adj < 52% (Le Bas et al. 1986). The upper limit of 53% was used mainly because we wanted to have a number of samples for inverse modelling that might provide statistically significant results.
The mafic magmas are usually porphyritic or microcrystalline with < 25% of phenocryst content. Phenocrysts are of euhedral olivine with inclusions of chromiferous spinel, and plagioclase. However, in many samples, plagioclase occurs only as microphenocrysts. The groundmass consists of these minerals, plagioclase being the main component; opaque minerals (titanomagnetite, ilmenite) are also present. In many samples both phenocrysts and groundmass plagioclase show a preferred flow orientation. Additionally, some rocks show circular or elongated vesicles (6–10% in volume).
with those previously reported by Wallace & Carmichael (1999) and Márquez & De Ignacio (2002). Chromiferous spinel inclusions are characterised by typical compositions of inverse structure Fe/(Fe+Mg)= 0.54±0.06, Cr/(Cr+Al)= 0.49±0.05, and Fe+3/Fe= 0.35±0.05 (n= 25). However, it is not possible to assign specific names, as all specimens are situated in the central part of the MgAl2O4–MgCr2O4– FeCr2O4–FeAl2O4 prism (Haggerty 1991). Plagioclase is present as small euhedral phenocrysts, without optical zoning, of labradorite composition (An59.8±4.7; n= 29).
Using the TAS diagram (Figure 3; Le Bas et al. 1986),
M magmas are classified as B, TB, BTA, and BA. All rocks show LREE (light rare-earth elements) enriched chondrite-normalised patterns (Figure 4a), being reflected by [La/Yb]N (chondrite-normalised) ratios of 5.1±0.9 (n= 18, range= 3.6–6.8), without a negative Eu anomaly. MORB-normalised multi-element plots of these magmas show enrichment in large ion lithophile elements (LILE) and lack high field strength element (HFSE) significant negative anomalies (Figure 5a). M-type magmas display 87Sr/86Sr ratios from 0.70348 to 0.704302 (n= 12), whereas
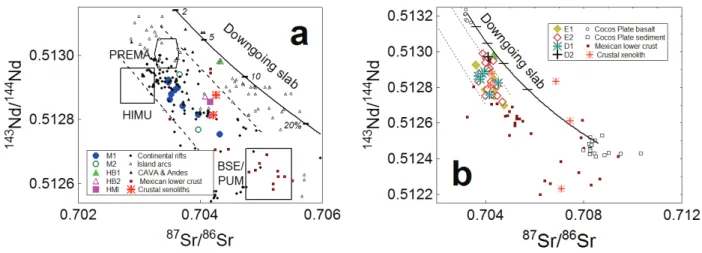
143Nd/144Nd ratios covers a narrow interval from 0.51279 to 0.51294 (n= 11). All samples fall within the ‘mantle array’ (Faure 1986) in the 87Sr/86Sr–143Nd/144Nd diagram (Figure 6a).
5.2. Evolved magmas
Evolved SCN rocks, (SiO2)adj > 53%, are usually porphyritic or microcrystalline with <26% of phenocrysts, of which some have circular or elongated vesicles reaching 6–10% of total volume. However, some lava domes (for example, Tabaquillo or Lama) have phenocryst content as high as 50%. Groundmass mainly consists of plagioclase, pyroxenes, and magnetite. Based on their mineralogical assemblage of phenocrysts, SCN evolved magmas are divided into two groups: (a) E1: ol + opx ± cpx ± plg; and (b) E2: opx ± cpx + plg.
A5) than those in the M-magmas. Orthopyroxenes (enstatite) are typically subhedral to euhedral, usually displaying normal zoning with a homogeneous composition (cores: En81.1±1.5, n= 14; rims: En80.6±1.4, n= 12; Appendix A6). Clinopyroxenes (augite: En47; Appendix A7) appear only in the groundmass. Plagioclases are labradorite, comparable to plagioclases in M-type magmas
(An59.6±4.5, n= 14; Appendix A8). E1 magmas are distributed in the BTA, BA, TA, and A fields on the TAS diagram (Figure 3), with (SiO2)adj= 53.0–62.4 and Mg#= 52–74 (n= 90). These rocks show LREE-enriched patterns and lack or display a very small negative Eu anomaly (Figure 4d). [La/Yb]N ratios displayed by these magmas (7.0±1.6, n= 19) are significantly higher compared to the M magmas. Figure 4. Chondrite-normalised REE diagrams for SCN magmas: (a) mafic magmas; (b) high-Ba magmas;
(c) high-magnesium intermediate magmas; (d) evolved magmas with an ol + opx ± cpx ± plg mineralogical assemblage; (e) evolved magmas with an opx ± cpx + plg mineralogical assemblage; and (f) disequilibrium magmas. The adjusted %SiO2 –(SiO2)adj is reported for each sample. Chondrite data (mg.g-1) from Haskin et al.
Multi-element MORB-normalised diagrams are similar to those showed by M magmas with the exception of a slightly negative Nb anomaly (Figure 5d). The statistical comparison of E1 with M magmas reveals that (a) significantly higher contents of four LILE (K, Cs, Rb, and Ba), one HFSE (Hf) and two actinide-HFSE (Th and U);
(b) similar concentrations for REE (La-Lu), one LILE (Sr), and two HFSE (Zr and Ta); and (c) significantly lower Nb and Y contents.
Felsic E2 magmas are mainly pyroxene-phyric andesites and dacites ((SiO2)adj= 55.4–67.3, Mg#= 49.5–71.5; n= 96), sometimes showing clots of ortho > clinopyroxene. Figure 5. N-MORB-normalised multi-element diagrams for SCN magmas: (a) mafic magmas; (b) high-Ba
magmas; (c) high-magnesium intermediate magmas; (d) evolved magmas with an ol + opx ± cpx ± plg mineralogical assemblage; (e) evolved magmas with an opx ± cpx + plg mineralogical assemblage; and (f) disequilibrium magmas. The adjusted %SiO2 – (SiO2)adj– is reported for each sample. N-MORB data (%m/m for major-oxides and mg.g-1 for trace elements) from Pearce (1982): Sr= 120, K
2O= 0.15%, Rb=
Augitic and enstatitic pyroxenes are normally zoned, both displaying a narrow compositional range for cores (opx: En82.7±3.1, n= 45, Appendix A6; cpx: En46.3±2.1Wo43.3±1.3, n= 28, Appendix A7), with changes of 6–10% in %En for rims. However, some specimens also contain pyroxene phenocrysts showing slightly reverse zoning (opx in CHI02, Appendix A6; cpx in CHI71, Appendix A7). Plagioclase phenocrysts display a narrow compositional range (An59.5±3.9, n= 12). Felsic E2 magmas have REE ([La/ Yb]N= 8.1±1.4, n= 49; Figure 4e) and MORB-normalised multi-element (Figure 5e) patterns similar to those of E1
magmas. Compared to M magmas, E2 magmas have: (a) significantly higher concentrations for three LILE (Ba, Rb, and Cs) and actinide-HFSE (Th and U); (b) similar compositions for LREE (La-Nd, except Ce), Dy, Hf and Sr; and (c) significantly lower contents for Ce, MREE (Sm-Tb), HREE (Ho-Lu), and four HFSE (Nb, Ta, Y, and Zr). It is remarkable that E2 magmas with somewhat higher silica levels — (SiO2)adj= 61.8±2.5 (n= 96) show significantly higher contents only for Ba, Cs, Rb, and actinide-HFSE (Th and U) compared to E1 magmas — (SiO2)adj= 57.0±2.5 (n= 90).
Sr isotope ratios of the evolved magmas display significant variations over their SiO2 range (E1: 0.7036– 0.7048; E2: 0.7037–0.7047). Nd isotope ratios range from 0.5127 to 0.5130 and show a well-defined negative
correlation with Sr isotope ratios (Figure 6b). Generally, 87Sr/86Sr and 143Nd/144Nd fall within the ‘mantle array’ field, overlapping with the high 143Nd/144Nd side of the Mexican lower crust (Patchett & Ruiz 1987; Ruiz et al. 1988a, b; Roberts & Ruiz 1989; Schaaf et al. 1994).
5.3. High-Mg intermediate magmas
Intermediate magmas with relatively high contents of MgO (HMI) have been emitted from some volcanic centres of the SCN, most of them situated in the W area (Figure 2). As
M magmas, these rocks are also usually porphyritic, with <20% vol. % phenocrysts in a glassy matrix. Phenocrysts are predominantly euhedral olivine, plagioclase, and occasionally orthopyroxene. The groundmass is largely made of small plagioclase microcrystals.
Euhedral olivine cores have compositions of Fo88.5±1.4 (n= 17), being slightly more mafic than those in M-type magmas (Appendix A4). In general, there is little change in the forsterite proportion throughout the olivine crystals (0.1–4.0%). The phenocrysts contain numerous chromiferous spinel inclusions of inverse structure (Appendix A5), with a composition of Fe/(Fe + Mg)= 0.52±0.08, Cr/(Cr + Al)= 0.563±0.020, and Fe+3/Fe= 0.322±0.031 (n= 15). Moderately zoned labradoritic plagioclase phenocrysts also occur, although with more calcic cores (n= 9; An64.2±1.4; Appendix A8) compared to those in M magmas.
Figure 6. 87Sr/86Sr-143Nd/144Nd plot for the SCN magmas and their comparison with other tectonic areas, mantle and crustal
According to the nomenclature of Le Bas et al. (1986), the HMI magmas are classified as BTA and BA (HMI1
and HMI2 respectively in Figure 3), having (SiO2)adj= 52.7–56.6%, (MgO)adj= 6.5–10.2% and Mg#= 66–76 (n= 32). All rocks show enrichment in light REE, a gradual slope change which leads to a nearly flat pattern in heavy REE (Figure 4c; [La/Yb]N= 5.1±1.0, n= 7, range= 3.6–6.4), and a negligible Eu anomaly. MORB-normalised multi-element plots (Figure 5c) display a pattern characterised by enrichments in LILE (Sr, K, Rb, and Ba) and depletion of HFSE (Nb, Ta, and Ti), which contrasts with the observed patterns for M magmas. Moreover, two LREE (La and Ce), three MREE (Sm, Eu, and Tb), Sr, and five HFSE (Hf, Nb, Ta, Y, and Zr) concentrations in HMI rocks are statistically lower than the M magmas, whereas the differences in composition of the rest of the incompatible elements are not statistically significant. However, HMI
magmas have 87Sr/86Sr (0.70390–0.70416) and 143Nd/144Nd (0.51281–0.51285) ratios (n= 3) nearly comparable with those displayed by M magmas.
5.4. Two types of high-Ba magmas
In the SCN mafic emissions are characterised by a high concentration of Ba compared to M magmas and the other rock-types. This group, designated here as HB1, comprises one TB and three BTA ((SiO2)adj= 52.1±1.4; MgO= 9.0±0.9, Mg#= 74.5±0.5), erupted in the NW part of the monogenetic field, and not near the volcanic front.
In statistical comparison with M magmas at the same SiO2 level (BTA and BA), the HB1 group shows the following characteristics: (a) significantly higher concentrations of LREE (La-Nd), MREE (Sm-Gd), LILE (K, Rb, Ba, and Sr) and actinide-type HFSE (Th and U); (b) similar contents of MREE (Tb and Dy), HREE (Ho-Lu) and three HFSE (Zr, Hf, and Y); and (c) significantly lower composition of two HFSE (Ti and Nb). Chondrite-normalised REE patterns for HB1 are LREE enriched (Figure 4b; [La/Yb]N ~18.4), whereas a significant Nb depletion with respect to Ba and Ce is observed on a MORB-normalised multi-element diagram (Figure 5b). The BTA RMS-2 (Martínez-Serrano
et al. 2004) shows higher 87Sr/86Sr and similar 143Nd/144Nd isotopic ratios compared to M mafic rocks, with a shift towards the right of the mantle array (Figure 6a).
A second group of high-Ba magmas (HB2) occurs in the central part of SCN (Figure 2). This group includes a variety of magma types (TB, BTA, TA, and A; (SiO2) adj= 50.4–61.7, Mg#= 61.2–71.0, Figure 3), which show high concentrations of Ba (715-1830 mg.g-1) and light REE (La= 23–58 mg.g-1; [La/Yb]
N= 7.3–12.0; Figure 4b), accompanied by relatively high contents of HFSE (Nb= 8–19 mg.g-1; Zr= 249–344 mg.g-1; Figure 5b). However, compared to E2 magmas at the same SiO2 level, HB2 rocks have significantly lower La, Ce, and Ba contents.
5.5. Disequilibrium magmas (DISQ)
The DISQ group comprises rocks that range widely in (SiO2)adj (54.7–66.2; BTA to D; n= 20) and Mg# (51– 73), but with the two following distinctive features: (a) abundant textural evidence of mineralogical disequilibrium, such as coexisting Fo-rich olivine and quartz with pyroxene reaction rims and disequilibrium textures in plagioclase with oscillatory or more complex zoning and twinning; and (b) the occurrence of hydrous minerals (biotite, amphibole), absent in the other rock groups. Similar mineralogical characteristics have been reported in the evolved magmas erupted by the neighbouring stratovolcanoes Iztaccíhuatl (Nixon 1988a, b) and Popocatépetl (Straub & Martin del Pozzo 2001), which were interpreted as the result of mixing between mafic (derived from mantle) and felsic (derived from crust) magmas. Consequently, such a scenario can also be hypothesised for the SCN. See the Discussion section below.
Unzoned or slightly normally zoned olivine phenocrysts of the DISQ group have cores of Fo83.9±3.4 (n= 17; Appendix A4). Orthopyroxene (enstatite) cores have compositions (En82.4±3.6, n= 18; Appendix A6) comparable to those observed in other rock groups. Clinopyroxenes exhibit a varied morphology that includes euhedral, subeuhedral or skeletal crystals, showing an augitic composition (En45.0±1.8Wo44.5±1.6; n= 18; Appendix A7). In some samples, pyroxenes with normal and reversed zoning (e.g., opx: CHI08, CHI49, and CHI63, Appendix A6; cpx: CHI21, Appendix A7) are present. Several rounded quartz grains show hypersthene reaction rims (CHI11, En70Fs27). Compared to other rock groups, plagioclase cores in DISQ magmas vary more in composition (An54±13, n= 15). In some cases, as dacite CHI09, the plagioclases of groundmass display a bimodal composition (An20 and An60). Some dacitic thick lava flows, such as Lama CHI10 and Tabaquillo CHI79, include abundant large plagioclase phenocrysts (2–4 mm in length) characterised by concentric oscillatory zoning with the cores more calcic than the rims (Appendix A9). Additionally, these magmas contain hydrated minerals, amphibole (edenite, tschermakite, and hastingsite; Márquez & De Ignacio 2002) and brown biotite (annite; Appendix A10), strongly altered to iron oxides.
element compositions in DISQ magmas are comparable with those shown by felsic E2 magmas, except for La, Rb and Ta (more concentrated in E2) and Sr (with high content in DISQ). The Sr (0.7037–0.7045; n= 7) and Nd (0.5128–0.5130; n= 7) isotopic ratios of DISQ magmas are within the range defined by evolved magmas from SCN and the Mexican lower crust and crustal xenoliths from the Popocatépetl stratovolcano located near the SCN (Figure 6b).
6. Discussion
6.1. Origin of the mafic magmas
(1) SCN near-primary magmas –Following Luhr (1997),
35 samples of M magma were identified with geochemical characteristics of near-primary magmas (M1: (SiO2)adj= 49.0–52.7%, (MgO)adj= 7.0–9.3%, Mg#= 64.1–72.7): basalt
(12 samples); trachybasalt (8); and basaltic trachyandesite (15). Average compositions of these magma types are reported in Appendix A11.
(2) Trace element ratios (subduction vs mantle signature) –In addition to relatively high Mg#, M1 magmas do not show significant HFSE (Nb and Ta) depletion compared to LILE (Rb, Ba and Sr) (Figure 5a). These magmas also have low Ba/Nb (< 30), Sr/P (< 0.45), Rb/La (<1.3), and Cs/Th (< 0.5) ratios (Figure 7a, b), similar to those observed in most rocks from continental rifts and break-up areas (e.g., Verma 2006). This behaviour contrasts with that exhibited by island and continental arcs (Hawkesworth et al. 1991; Tatsumi & Eggins 1993; Verma 2002).
SCN near-primary magmas show significantly small negative Nb anomalies (expressed as [Nb/Nb*]Primitive-mantle defined by Verma (2006); Appendix A12; mean or median
Figure 7. Four binary diagrams constructed using slab-sensitive or mantle-sensitive parameters (Verma 2006) for near primary mafic
magmas from the SCN (open squares) and their comparison with similar rocks from continental rifts, including extension-related areas and continental break-up regions, as well as from island and continental arcs including the CAVA and Andes. Dotted lines in different diagrams give approximate reference values for the fields occupied by the SCN mafic rocks. (a) Slab-sensitive Ba/Nb–slab sensitive Sr/P (therefore, both parameters are likely to have high values for arcs); (b) slab-sensitive Rb/La–slab sensitive Cs/Th; (c) mantle sensitive Nb-[Nb/Nb*]Primitive mantle, where [Nb/Nb*]Primitive mantle is a quantitative measure of Nb anomaly defined as the ratio of actually measured Nb concentration of a sample normalized with respect to primitive mantle and the average value of primitive mantle-normalized concentrations of Ba and La in the same sample (primitive mantle values were from Sun & McDonough 1989); and (d) slab-sensitive [LILEE/LREEE]–slab sensitive [LILEE/HFSEE] where subscript E refers to bulk silicate earth-normalised values, LILEE= (KE + RbE + BaE + SrE)/4, LREEE = (LaE + CeE + NdE)/3, and HFSEE= (NbE + ZrE + TiE + PE)/4. All concentrations data in mg.g-1 were normalized against
value ~0.69; 95% and 99% confidence limits of 0.61–0.77 and 0.58–0.81, respectively), which are similar to those in extension-related areas (Figure 7c). For comparison, island and continental arc magmas have [Nb/Nb*] Primitive-mantle mean or median values of ~0.06–0.32 (Appendix A12; 95% and 99% confidence limits within the range ~0.03– 0.47 and ~0.01-0.60, respectively). A negative Nb anomaly is also a common characteristic of primitive rocks from rifts, extension-related regions, and continental break-up areas (Figure 7c and Appendix A12) although its value is different from that in arcs. Furthermore, in arcs the negative Nb anomaly is accompanied by low Nb contents (generally < 10 mg.g-1; Verma 2006). Additionally, the M1 magmas have LILEE/HFSEE < 2.2, comparable to extension and continental break-up magmas (Figure 7d; Verma 2004, 2006). Three samples of mafic magmas from the SCN (not included in our database) reported by Schaaf et al. (2005), also have geochemical characteristics similar to the M1 magmas.
(3) Discrimination diagrams – Major and trace
element signatures have been widely used in conventional discrimination diagrams to identify different tectonic settings (e.g., Pearce & Cann 1973; Shervais 1982; Meschede 1986; Cabanis & Lecolle 1989). However, the application of these older geochemical diagrams has been criticised (Verma 2010) on the basis of the following reasons: (a) the discrimination only uses bi- or tri-variate data drawn from ‘closed’ arrays; (b) the diagrams were generally constructed using a limited geochemical database; (c) they do not incorporate proper statistical treatment for compositional data (Aitchison 1986); (d) most such diagrams discriminate only broadly grouped settings, such as within-plate that combines continental rift basalt (CRB) and OIB settings; and (e) the boundaries in most tectonic discrimination diagrams are drawn by eye (Agrawal 1999).
All objections were in fact overcome in three sets of discriminant function based multi-dimensional diagrams (Verma et al. 2006; Agrawal et al. 2008; Verma & Agrawal 2011), in which natural-logarithm transformed ratios were used for LDA. These newer diagrams have been successfully used for the study of different areas (e.g., Srivastava et al. 2004; Rajesh 2007; Sheth 2008; Polat et al.
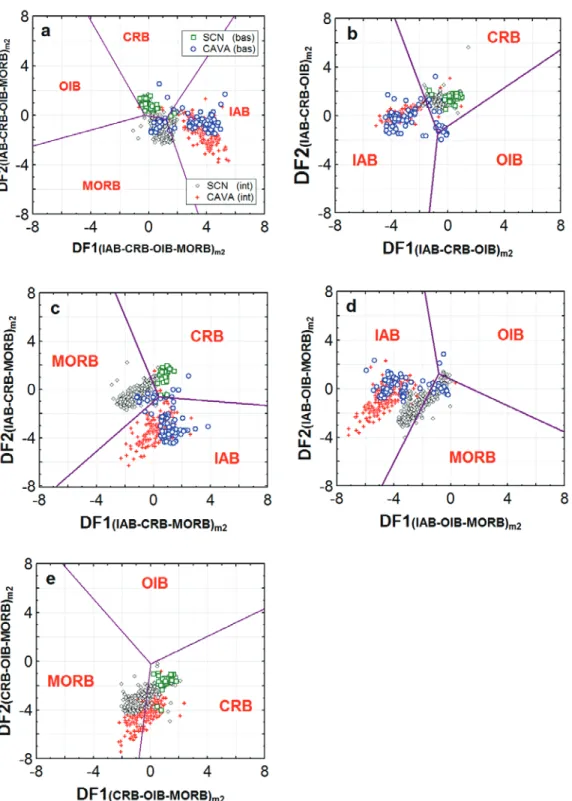
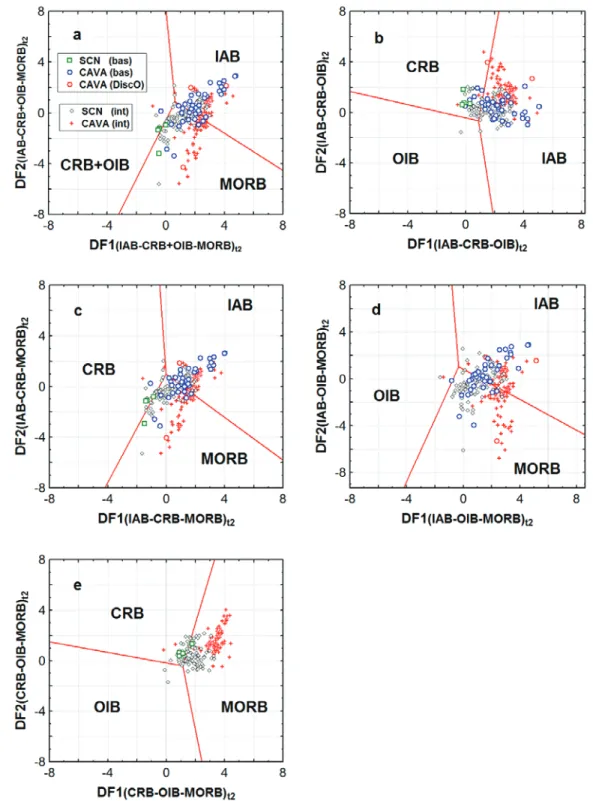
2009; Slovenec et al. 2010; Zhang et al. 2010). The results of their application to the SCN are summarised in Figure 8a–e for Verma et al. (2006) diagrams for major-elements and Figure 9a–e for Verma & Agrawal (2011) diagrams for the so called immobile elements – (TiO2)adj, Nb, V, Y, and Zr. For the other set of immobile elements (La, Sm, Yb, Nb, and Th), the set of diagrams proposed by Agrawal et al. (2008) could not be used, because complete data were available for only one mafic rock sample from the SCN. The results from Figure 8a–e show high success rates of
93% to 100% for the SCN as a continental rift setting and 76–80% for CAVA as an arc setting (Appendix A13). For Verma & Agrawal (2011) diagrams (Figure 9a–e) only four basic rock samples from the study area were available with complete data, although they indicated a continental rift setting. For CAVA an arc setting is fully confirmed (Appendix A13).
In a study of the SCN, Siebe et al. (2004; their figure 13) plotted data for mafic rocks in two conventional bivariate discrimination diagrams and, although clearly a within plate setting was indicated, these authors refrained from commenting on their results. How could these results for mafic magmas be explained by their preferred subduction-related model?
(4) Isotopic constraints –On a 87Sr/86Sr – 143Nd/144Nd diagram (Figure 6a), M1 magmas plot in the same field as the primitive rocks from continental rifts and extension-related areas as well as island and continental arcs. Altered basalts and sediments from the subducting Cocos plate (‘Downgoing slab’; Verma 1999) are included in the graph to show that slab composition (basalt-sediment mixing curve) plots considerably to the right of SCN near-primary magmas. These results contradict the conventional subduction-related models such as those proposed by Wallace & Carmichael (1999). In contrast, CAVA magmas (Carr et al. 1990) fall in an area to the right of the ‘mantle array’, closer to the basalt-sediment mixing curve for the Cocos plate. This shift towards the right of the ‘mantle array’ has been reported in many others arcs, as discussed by Verma (2006), such as Izu-Bonin arc (Taylor & Nesbitt 1998), Kamchatka arc (Kepezhinskas 1995), Lesser Antilles arc (Thirwall et al. 1997), South Sandwich island arc (Hawkesworth et al. 1977), Sunda arc (Hoogewerff et al. 1997), and Tonga-Kermadec arc (Gamble et al. 1995). This isotopic shift has also been detected in metabasaltic rocks from the Franciscan subduction complex (Nelson 1995) and altered oceanic basalts (Verma 1992).
primary magmas by considering a direct (slab melting) or indirect (fluid transport to the mantle) participation of the subducted Cocos plate.
(5) Spinel inclusions in olivine – Unlike Mg and Fe+2 in spinel trapped in olivine, magmatic abundances of trivalent (Al, Cr) and tetravalent (Ti) cations undergo very little, if any, change during post-entrapment re-equilibration because of their low diffusivity in olivine. For this reason, these cations have been used to discriminate between spinels that crystallised from different magmas in different geodynamic settings (Kamenetsky et al. 2001).
SCN chromian spinel inclusions in olivine phenocrysts have lower Cr/(Cr + Al) ratios (0.49±0.05; n=25; Figure 10a) compared to arc volcanic rocks, including boninites (>0.6), but similar or slightly lower than OIB (0.5–0.65; Dick & Bullen 1984; Kamenetsky et al. 2001). Also, SCN spinel inclusions display, in general, greater TiO2 contents that those observed in subduction-related magmas (Figure 10b), reflecting a non-depleted source in HFSE.
(6) Partial melting (PM) model of lithospheric mantle –
The failure of the slab-involvement model, as documented from geochemical, mineralogical, and isotopic constraints, suggests that the SCN near-primary magmas were generated solely in the underlying mantle. Following the criteria of Pearce & Peate (1995), trace-element ratios (Nb/Y ~0.65; Ti [in % m/m]/Yb (mg.g-1) ~0.37; Th/Yb ~0.68; Zr/Yb ~ 80) indicate an enriched mantle source for SCN M1 magmas, compared to N-MORB (Nb/Y ~0.083; Ti [in % m/m]/Yb (mg.g-1) ~0.25; Th/Yb ~0.039; Zr/Yb ~ 24) or even E-MORB (Nb/Y ~0.29; Ti [in % m/m]/Yb (mg.g-1) ~0.25; Th/Yb ~0.25; Zr/Yb ~ 31) compositions (Sun & McDonough 1989).
Trace element concentration data for near-primary M1
magmas were used to develop a partial melting inversion model, in order to establish the ‘average’ geochemical characteristics of heterogeneous lithospheric mantle beneath the SCN. This approach was previously applied in the SCN by Velasco-Tapia & Verma (2001b), although based on a smaller number of samples and elements, as well as in other localities of the MVB (Verma 2004) and in the Los Tuxtlas volcanic field (LTVF, Figure 1, Verma 2006). The selected samples probably show olivine fractionation, as reflected by the variation of Ni content (117–200 mg.g -1; Appendix A11), although the amount of fractionation may not be too large. About 5–15% removal of olivine could easily model the observed Ni concentration in the
M1 magmas from a primary magma in equilibrium with a peridotitic source. However, as a result of mineral/liquid partition coefficients <<1 for a typical upper mantle mineral assemblage (olivine, orthopyroxene, clinopyroxene, and spinel), this process will not produce any significant effect in the abundance of highly incompatible trace-elements or, more importantly, in their ratios (Rollinson 1993). Note
that the inverse model assumes that the peridotitic source is uniform with respect to trace element concentrations (Hofmann & Feigenson 1983). Although this requirement is not easily met, similar radiogenic isotopic ratios of primary magmas would suggest a relative homogeneity of the source region. The SCN M1 magmas display 87Sr/86Sr ratios of 0.70369±0.00027 (n= 10) and 143Nd/144Nd= 0.51286±0.00005 (n= 9). Finally, an additional assumption in the inversion model is that melting occurs in an invariant condition, which in theory will give constant primary melt major element composition. The average SiO2 (anhydrous 100% adjusted) concentration of the selected samples is 51.2±0.9 (n= 38). This relatively small variation in major Figure 10. Compositional relationships in spinel inclusions in
olivine (Fo85.9±2.5) from SCN mafic magmas. (a) Cr/(Cr + Al) and Mg/(Mg + Fe+2) ratios (in mol). For comparison, the diagram
elements is to be expected in natural systems with a minimal effect on trace element compositions in the set of cogenetic magmas (Ormerod et al. 1991).
The inverse modelling method applied to the SCN primary magmas is the same as that proposed by Hofmann & Feigenson (1983). Relevant equations can be consulted in this paper as well as in Velasco-Tapia & Verma (2001b). La was used as the most incompatible element, because it shows, in general, lower bulk mineral/melt partition coefficients for olivine + orthopyroxene + clinopyroxene + spinel assemblage than other REE, LILE and HFSE (e.g., Rollinson 1993; Green 1994). The results of linear regression element-element (CLa – Ci)
E and
element-element ratio (CLa – CLa/Ci)
E equations (where superscript
i refers to a trace element other than La, and subscript E
refers to normalisation against silicate earth-concentration values used, were those estimated by McDonough & Sun 1995) for the SCN near-primary magmas are presented in Appendix A14 and Figure 11. For REE with statistically valid correlations (CLa – Ci)
Eat 95% confidence level and n ≥
15, the incompatibility in (CLa – CLa/Ci)
E diagram decreases
in the sequence from Ce (LREE) to Lu (HREE). For other trace-elements (n ³ 12), the incompatibility sequence is U > P ~ Ba > Ta ~ K > Rb > Th ~ Nb ~ Zr > Hf > Y.
For comparison, (CLa – Ci)
E and (CLa – CLa/Ci)E linear
regressions (Appendix A15 and Figure 11) were prepared for near-primary magmas from the Central America Volcanic Arc database (downloaded from M.J. Carr’s website: http://www.rutgers.edu/~carr, June 2004); CAVA petrogenesis has been clearly related to subduction of the Figure 11. Inverse modelling (CLa/Ci)
E – (CLa)E diagrams for SCN near primary magmas following the methodology proposed by Hofmann & Feigenson (1983). Subscript E refers to normalization with respect to silicate earth: concentration values used were those estimated by McDonough & Sun (1995). (a) Rare-earth elements (Ce to Lu) and (b) Large-ion lithophile elements (LILE): K, Rb, Ba, and Sr; High-field strength elements (HFSE): P, Nb, Th, Zr, Hf, Ti, and Y.
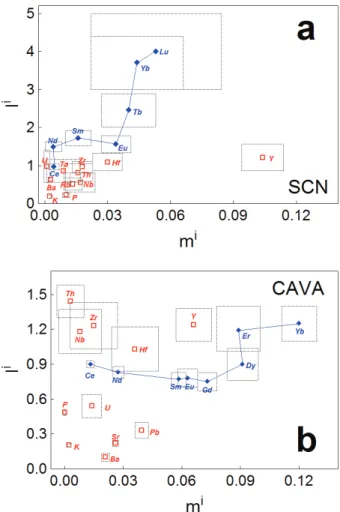
Figure 12. Diagrams of mi – Ii (slope – intercept) for near primary magmas from (a) SCN and (b) CAVA (database downloaded from M.J. Carr’s website: http://www.rutgers.edu/~carr, June 2004). The size for each rectangle (dashed lines) represents one standard error on the regression parameters, derived from the (CLa/Ci)
Cocos plate (Figure 1; Verma 2002 and references therein). REE incompatibility behaviour is similar to that observed in the SCN diagram, whereas the other trace elements show the incompatibility sequence P > K ~ Th > Nb > U ~ Zr > Ba > Sr > Hf ~ Pb > Y.
Intercept – slope (Ii – mi) diagrams (Figure 12) were also prepared from SCN and CAVA (CLa – CLa/Ci)
E linear
regression models, in which: Ii = (C
0La / C0i) (1 – Pi) and mi (D0i / C0i)
where C0i refers to the concentration of element i in the mantle source, D0i the bulk distribution coefficient for source prior to melting, and Pi the bulk partition coefficient
corresponding to the melting phases.
The slope values obtained from SCN linear regression models (Figure 12a) increase very slowly from Ce (0.0044) to Lu (0.053). For LREE (Ce and Nd), D0i ~0 and (1 –Pi)
~1. The increase in the intercept value from LREE to HREE can be interpreted as a decrease in C0i, as a result of moderate compatibility in clinopyroxene (Dcpx= 0.5 –0.6;
Rollinson 1993). The large difference in ICe and IYb (ratio
~4; Appendix A14) implies an enriched source in LREE, with a mantle normalised ratio (La/Yb)N > 1. However, positive intercepts of Tb to Lu are inconsistent with the presence of mineral phases with D0i > 1 for HREE, such as garnet in the source. On the other hand, LILE and HFSE display low slope values (mi < 0.03), except for Y
(mi= 0.104). Note that HFSE elements (Y, Ta, Hf, Th, and
Zr) are not as depleted as LREE and LILE, because they show low slope values (mi= 0.009–0.030) combined with
intercepts (Ii= 0.81–1.09) comparable to Ce (Nb showing
lower intercept value). This behaviour contrasts with that observed in subduction-related magmas, because the latter are generally characterised by low concentrations of HFSE (Tatsumi & Eggins 1993), as also confirmed from the inverse modelling of CAVA data (see below).
Slope values of REE in the CAVA near-primary magmas increase very rapidly from Ce to Yb, reaching mi= 0.12,
whereas intercepts show a slight variation from Ce to Dy (Ii= 0.75–0.90) and increase their values in HFSE (Figure
12b). An IYb/ICe ~1.4 is indicative of a peridotitic source enriched in LREE but less than the mantle source of the SCN magmas. The remaining trace elements display low slope values (mi= 0–0.04). However, LILE (K, Ba, and Sr)
show lower intercept values (Ii= 0.1–0.2) than HFSE (Nb,
Zr, Hf, and Th; Ii= 1.0–1.5). This decoupling is a typical
characteristic of subduction-related magmas, reflecting depletion of HFSE in the mantle source compared to LILE (Ormerod et al. 1991).
6.2. Origin of high-Mg intermediate magmas
The origin of HMI magmas has been generally attributed to an arc setting derived from partial melting of the subducted oceanic plate (e.g., Yogodzinski et al. 1994; Kelemen 1995). According to Castillo (2006), such
magmas display high SiO2 ≥ 56 %, Al2O3 ≥ 15%, Sr > 300 ppm, Sr/Y > 20, and La/Yb > 20, with no Eu anomaly in REE chondrite-normalized patterns and low Y < 15 ppm, Yb < 1.9 ppm, and 87Sr/86Sr < 0.704. HMI magmas in the central MVB have been interpreted as arc-related adakites (e.g., Martínez-Serrano et al. 2004; Gómez-Tuena et al.
2007b). However, these ‘adakite’ samples do not plot on or even close to the subducting Cocos plate (‘Downgoing slab’) in the Sr-Nd isotopic diagram (Figure 6a; data not plotted).
HMI magmas have been also observed in zones where the volcanic activity is produced in an extensional tectonic setting (e.g., Kirin Province, northeast China; Hsu et al.
2000; Nighzhen, east China, Xu et al. 2002). Therefore, the presence of such magmas alone cannot be used to unequivocally infer the tectonic setting. HMI magmas from the SCN do not have isotopic ratios similar to the Cocos plate (Figure 6a). However, these rocks have Sr and Nd isotopic ratios similar to the M magmas. Mafic magmas may interact with mantle peridotite (Fisk 1986) or lower continental crust (Kelemen 1995) rich in residual olivine and probably, to a lesser extent, other common minerals fractionated from earlier batches of mafic magmas. This interaction is likely to move their compositions towards higher MgO and Ni contents (Fisk 1986), and the resulting magmas are likely to become basaltic andesite (Kelemen 1995). The Sr and Nd isotopic composition of these high-Mg intermediate magmas (Figure 6a) supports this mechanism for their genesis.
6.3. Origin of the evolved magmas
magmas, as a high degree of partial melting (~50%) would be required and discrepancies exist between the predicted and measured LILE concentrations. As an alternative, these authors proposed the possibility that some evolved magmas were the result of partial melting of underplated mantle-derived magmas in the mantle-crust boundary under low water fugacity. This could well be a viable model but is not significantly different from that proposed by Verma (1999). The combined Sr-Nd isotope data from the Mexican lower crust and crustal xenoliths from the Popocatépetl stratovolcano (Figure 6b) are in general consistent with a significant crustal involvment in the genesis of SCN evolved magmas.
As Verma (1999) and Márquez & De Ignacio (2002) used a limited geochemical and isotopic database in hypothesis evaluation, the origin of SCN evolved magmas is still problematic. In the present study, several hypotheses were tested to explain their genesis.
(7) Fractional crystallisation (FC) model – In Figure 13 Harker diagrams of major- and trace-elements for the SCN evolved magmas and M magmas are presented. As expected, MgO and compatible element (e.g., Ni) contents diminish, up to four times, with the increment of %SiO2 in the SCN evolved magmas (linear correlation coefficient r of –0.901 and –0.713 for MgO (n= 289) and Ni (n= 259), respectively; statistically significant at 99% confidence level; Bevington & Robinson 2003). Also, LILE composition (e.g., K2O and Ba) is increased two or three times, as expected, for the most felsic rocks (r of 0.716 and 0.265 for K2O (n= 289) and Ba (n= 268), respectively). Initially, these observations could be explained as a result of fractional crystallisation. During progressive magma crystallisation, compatible elements are concentrated in the solids and incompatible elements are continuously enriched in the residual liquid. However, REE (e.g., La) concentrations do not increase with SiO2 (Figure 13; r of –0.237, n= 207), although these elements are, in general, incompatible with respect to the mineral assemblage observed in the evolved rocks. In fact, SCN dacites have lower concentrations than mafic magmas (Appendix A11; Figure 14). A similar situation is true for HFSE (e.g., Nb, r= –0.433, n= 204; Figure 13; for other elements Appendix A11 and Figure 14), which precludes simple fractional crystallisation as a viable process for generating evolved magmas in the SCN. Additionally, small but significant differences in 87Sr/86Sr and, to a lesser extent, in 143Nd/144Nd (Figure 6) rule out a simple fractional crystallisation of mafic magmas to generate the SCN evolved magmas. Although Schaaf et al. (2005) proposed (polybaric) fractional crystallisation as the dominant process for the genesis of magmas from Popocatépetl and the SCN and Valle de Puebla areas, they failed to explain their REE data from this simple process. Verma (1999) had already commented on this problem for
the SCN magmas. Additionally, their isotopic data will also rule out their proposed polybaric fractional crystallisation process as the main mechanism.
Nevertheless, we calculated detailed FC models using the average composition of basalt (B in Appendix A11) as the starting composition and common as well as accessory minerals (Figure 14). Note that the basaltic and basaltic andesite mafic magmas show higher REE concentrations than the evolved andesitic and dacitic magmas (compare B and BA with A and D in Figure 14a). The FC models, irrespective of whether common or accessory minerals are involved, show just the opposite, i.e., the liquids remaining after the removal of minerals would contain higher REE concentrations than the original basaltic magma (compare B with all L-FC patterns in Figure 14b). The multi-element plot for the SCN magmas (Figure 14c) shows that the evolved magmas have higher LILE (e.g., Rb and Ba) and Th and lower HFSE (e.g., Ta, Nb, P2O5, Zr, TiO2, and Y) and REE (e.g., Sm and Yb). The FC modelling (Figure 14d), on the other hand, shows that most elements would increase in concentrations and thus the depletions of most HFSE, such as Nb, P, Ti and Y, cannot be easily modelled.
(8) Assimilation-fractional crystallisation (AFC)
model – Mantle-derived mafic magmas can underplate
or stall within the lower and/or upper continental crust, cool, fractionally crystallise, and provide latent heat to cause assimilation of country rock. Consequently, the
AFC process in the SCN has been tested using major elements, REE, LILE, HFSE and 87Sr/86Sr ratios, applying the equations proposed by DePaolo (1981). M1 average compositional data (B in Appendix A11) were used as initial magma concentrations. To evaluate petrogenetic processes in the SCN, compositions of mafic meta-igneous xenoliths from the San Luis Potosí area (Schaaf et al. 1994) had to be used by Verma (1999) as assimilant, but now new compositional data for crustal xenoliths from the nearby Popocatépetl stratovolcano (Figure 1) are available (Schaaf
et al. 2005), which can be used to test the AFC process. The bulk partition coefficients were calculated for several different mineralogies from mineral-liquid partition coefficients compiled by Torres-Alvarado et al.
magmas (AFC curve with the fraction of remaining liquid F from 0.9 to 0.5 in Figure 15a), whereas in the chondrite-normalised diagram, all liquids remaining after AFC (corresponding to F from 0.9 to 0.7; Figure 15b) plot above the average basalt compositions away from the evolved SCN magmas, all of which plot below this mafic rock sample (see REE patterns for the andesite and dacitic rocks [A and D] in Figure 14a). Therefore, the AFC process does not seem to be appropriate to model the evolution of the SCN magmas.
(9) Continental crust partial melting – Information
on the continental crustal structure along MVB has been provided essentially by gravimetric, seismic and magneto-telluric studies (e.g., Valdés et al. 1986; Molina-Garza & Urrutia-Fucugauchi 1993; Campos-Enríquez & Sánchez-Zamora 2000; Jording et al. 2000). Geophysical data analysis has revealed that the thickest continental crust is present around the Toluca and Mexico valleys (~47 km; ~14 kbars; 700–800°C for the lower crust), near the SCN volcanic field. Ortega-Gutiérrez et al. (2008) suggested Figure 14. Chondrite-normalised REE and N-MORB-normalised multi-element diagrams for SCN
that, under these physical conditions, garnet granulites of gabbroic composition and Mg# <60 should compose most of the lower crust underlying the central MVB.
From a seismic model, Fix (1975) interpreted a zone with ~20% partial melting below central Mexico in the crust-mantle interface. Ortega-Gutierrez et al. (2008) proposed that Mexican lower crust, even if wet, cannot
melt at 700°C to produce andesitic magmas, but it certainly would do so for temperatures above 1000°C as modelled using temperature-stress dependent mantle rheologies. A periodic basaltic intrusion over a sustained but geologically short period could be a plausible mechanism to reach temperature above 1000°C at the crust-mantle interface in continental arc and other tectonic settings. Underplating of basaltic magma at the Moho and intrusion of basalt into the lower crust have been advocated for supplying heat for crustal anatexis (e.g., Bergantz 1989; Petford & Gallagher 2001). These mechanisms would result in heat transfer from the mantle to the lower crust, thus promoting melting. According to numerical simulations by Gallagher & Petford (2001), emplacing new basalt intrusions on top of earlier ones maximizes the amount of melt generated in the overlying protolith, and reduces greatly the heat loss through the base of the pile. The degree of partial melting is governed by the initial intrusion temperature and the periodicity, and yields a maximum predicted average melt fraction of 0.38. Dufek & Bergantz (2005) have modelled this process in 2-D for 30 to 50 km crusts in an arc environment. They pointed out that dacitic and rhyodacitic magmas can be generated in the crust although such magmas may not easily erupt at the surface. However, the eruption of such crustal melts may be facilitated in an extensional environment such as that inferred in the SCN (Márquez et al. 1999b).
The origin of some SCN felsic magmas has been interpreted as a product of partial melting of continental crust (Verma 1999). Because Mexican crust (e.g., Patchett & Ruiz 1987; Ruiz et al. 1998a, b; Roberts & Ruiz 1989; Heinrich & Besch 1992; Schaaf et al. 1994, 2005; Aguirre-Díaz et al. 2002) is highly heterogeneous both chemically Figure 15. Evaluation of assimilation-fractional crystallisation
(AFC) process for SCN magmas. AFC conditions: (1) Initial magma compositions: MB− average composition of basalt (Appendix A11); (2) Assimilant/fractionated ratio (r) of 0.5 for fractions of liquid remaining (F) between 0.9 and 0.5; (3) FC mineral assemblages (solid line): 0.25 olivine + 0.40 plagioclase + 0.25 clinopyroxene + 0.10 magnetite; (4) Assimilant: Crustal xenolith (A-ms; meta-sandstone) from Popocatépetl (Schaaf et al. 2005) used for (a) and crustal xenolith (A-sk; skarn) for (b). Other crustal xenoliths are also shown in these plots. (a) Ba/Nb–Y plot, PM paths refer to partial melting of different xenoliths, whereas the FC path gives the possible trajectory of fractional crystallization of MB mafic magma; and (b) Chondrite-normalised plot, for symbols of crustal xenoliths see (a).
Figure 16. Nb-Ba/Nb bivariate diagram for SCN rocks. The
and isotopically, as is the crust elsewhere (Taylor & McLennan 1985; Rudnick et al. 1998), the magmas generated from its partial melting should also be similarly heterogeneous (Figure 6). Migration of SCN M and HMI
melts upwards would result in crustal heating above the initial melting regions, and ultimately lead to assimilation and melting at shallower crustal levels. These petrological processes might be restricted to the middle crust (average worldwide composition: SiO2= 60.6%, Al2O3= 15.5%, MgO= 3.4%, Rudnick & Gao 2003; depth in MVB= 10–25 km, Ortega-Gutiérrez et al. 2008), because SCN evolved magmas display little or no negative Eu anomaly in chondrite-normalized REE patterns. Evidence of entrapment of melt inclusions has been reported from upper to middle crust in central Mexico (1-6 kbar or less; Cervantes & Wallace 2003).
As revealed by xenoliths in volcanic rocks from the central part of the MVB, the crust is highly heterogeneous, because it consists of orthoquarzite sandstone, metasandstone, metasiltstone, xenocrystic quartz, calc-silicate skarn, foliated fine-grained granodiorite, coarse-grained pyroxene diorite to gabbro, fine-grained hornblende-biotite granodiorite, and marble (Márquez
et al. 1999b; Siebe et al. 2004; Schaaf et al. 2005; Ortega-Gutiérrez et al. 2008). Partial melting of crustal xenoliths (gd in Figure 15a) can generate intermediate andesitic and dacitic SCN magmas (see PM paths in Figure 15a). The REE (Figure 15b) and Sr-Nd isotopic data (Figure 6a, b) of these xenoliths are also fully consistent with this partial melting model, because such melts are likely to have REE patterns below the B curve, i.e., similar to the evolved magmas (Figure 14a) and isotopic compositions similar to the SCN evolved magmas.
6.4. Origin of the disequilibrium magmas
DISQ magmas amounting to only ~7% represent incomplete mixing of at least two different types of magmas. Similar rock types with disequilibrium textures have also been observed in the nearby Iztaccíhuatl and Popocatépetl stratovolcanoes (Nixon 1988a, b; Straub & Martin del Pozzo 2001; Schaaf et al. 2005). Magma mixing is evaluated from one bivariate diagram (Figure 16). Mafic magmas show higher Nb concentrations than most other evolved magma varieties. Because Nb is an incompatible element in most common rock-forming minerals (e.g., Rollinson 1993), SCN magmas cannot be related to simple fractional crystallisation processes. Thus, the origin of the SCN evolved rocks with disequilibrium features could be explained as a result of the mixing of olivine-bearing mafic (M) magmas with evolved andesitic and dacitic (E1 and
E2) magmas generated by partial melting of the crust.
7. Conclusions
Compilation of 289 samples from the SCN shows that of the basaltic to dacitic magmas erupted, about 15% were
mafic magmas. The 87Sr/86Sr and 143Nd/144Nd of these mafic magmas are 0.7035–0.7043 and 0.51279–0.51294. In comparison, the evolved magmas have Sr and Nd isotopic compositions of 0.7036–0.7048 and 0.51270–0.51230 (slightly higher and lower, respectively). All samples from the SCN plot on the ‘mantle array’ in the Sr-Nd isotope diagram. Spinel inclusions in olivines have compositions different from those in arcs. Some of the evolved magmas show abundant textural evidence of mineralogical disequilibrium, such as coexisting olivine and quartz, quartz with pyroxene reaction rims, and plagioclase with oscillatory or complex zoning. On multi-dimensional log-ratio transformed major-element discriminant function based diagrams, most (93–100%) mafic rock samples plot in the continental rift setting. Similar multi-dimensional immobile element based diagrams support this conclusion. Inverse modelling of trace-element data for the SCN mafic magmas shows a source enriched in LILE, HFSE and LREE and absence of residual garnet. This modelling also shows the following incompatibility sequence for the SCN: U > P ~ Ba > Ta ~ K > Rb > Th ~ Nb ~ Zr > Hf > Y. In comparison, the incompatibility sequence for the CAVA was as follows: P > K ~ Th > Nb > U ~ Zr > Ba > Sr > Hf ~ Pb > Y. Evolved magmas from the SCN show a more complex history, although the involvement of the continental crust, particularly the lower crust, might be considered significant. Our preferred petrogenetic model for the SCN can be summarised as follows: (1) mantle-derived basic (basaltic) magmas intruded the base of the continental crust; (2) their periodic injection resulted in a significant increase in crustal temperatures to cause partial melting of the crust which produced evolved andesitic and dacitic magmas and their eruption was facilitated by an extensional regime beneath the SCN; and (3) fractional crystallisation of basic magmas and their incomplete mixing with the evolved magmas gave rise to disequilibrium magmas.
Acknowledgements