TítuloANN multiscale model of anti HIV Drugs activity vs AIDS prevalence in the US at county level based on information indices of molecular graphs and social networks
20
0
0
Texto completo
(2) 1 Introduction The acquired immunodeficiency syndrome (AIDS)(1) caused by the human immunodeficiency virus (HIV) is still considered as one of the most life-threatening diseases, and the HIV(2, 3) pandemic continues to spread. Since the beginning of the epidemic, more than 60 million people have been infected with HIV, and over 25 million have died from the disease. Since the first case of AIDS was reported by the US in 1981, tremendous progress has been made in the prevention and treatment of HIV/AIDS,(4) especially in the development of antiretroviral therapy(5) that has proven to be life-saving to millions of people. Therefore, the discovery and development of novel, highly potent anti-HIV drugs remain imperative, although the eradication is still a difficult goal to achieve due to a low level of viral persistence in treated subjects.(6) In this context, different Computer-Aided Drug Design (CADD) techniques, useful to predict the behavior of anti-HIV drugs, may play an important role in reducing the number of preclinical and clinical studies. For instance, we could use chemoinformatics models that link the chemical structure of drugs with their biological activity. In fact, there are many reports of chemoinformatics models, useful to predict anti-HIV activity in preclinical assays.(7) In principle, we could upgrade these models to predict the anti-HIV activity of drugs not only in preclinical screening but also in clinical and pharmacoepidemiology studies. Such a model may become a very useful tool not only for the Pharmaceutical Industry in order to reduce clinical assays. They should ideally be useful also for Public entities responsible for implementation of Health policies in the phase IV of drug development. However, there are no reports of models useful to predict the performance of anti-HIV drugs in both preclinical and pharmacoepidemiology studies on large populations without carrying out clinical studies. We neither had at our disposal models able to extrapolate, at least, the performance of anti-HIV drugs from preclinical studies to epidemiology studies on large populations without carrying out clinical studies. A useful chemoinformatics-pharmacoepidemiology model should be multilevel by definition as it is expected to account for both molecular and population structure. It means that, in order to develop such computational models, we need to process different types of input data coming from many different levels of organization of matter. On the one hand, we need to introduce information about the anti-HIV drugs including at least the chemical structure of the drug (level i) and the preclinical assay information, such as biological targets (level ii), organisms (level iii), or assay protocols (level iv). On the other hand, we need to incorporate population structure descriptors (level v) that quantify the epidemiological and social and economic factors affecting the population selected for the study. Last, as populations in modern society are not close systems we should also quantify the effect of interaction of the population under study with other populations that may influence the pharmacoepidemiology study (level vi). The data for levels i--iv were obtained from public databases of biological activity of organic compounds. These databases accumulated immense data sets of experimental results of pharmacological trials for many compounds. For instance, ChEMBL (https://www.ebi.ac.uk/chembl/)(8, 9) is one of the biggest with more than 11,420,000 activity data for >1,295,500 compounds and 9,844 targets. Specifically, ChEMBL contains >43,000 outcomes for assays of anti-HIV compounds. In addition, we obtained the data for levels v and vi from public epidemiological databases. For instance, AIDSVu(10) (http://aidsvu.org/about-aidsvu/) is the most detailed publicly available view of HIV prevalence in the US. AIDSVu is a compilation of interactive online maps that displays the HIV prevalence data at the national, state, and local levels and by different demographics, including age, race, and sex. Researchers at the Rollins School of Public Health at Emory University compiled the county-level data displayed on AIDSVu from the CDC (U.S. Centers for Disease Control and Prevention). State, county, and city health departments, depending on the entity responsible for HIV surveillance provided data on the HIV prevalence at the ZIP code and census tract. An Advisory Committee and a Technical Advisory Group guide the project with representatives from federal agencies, state health departments, and nongovernmental organizations working in HIV prevention, care, and research..
(3) The formulation of mathematical models of this large data set from ChEMBL is very complex per se(9, 11) but becomes an even more complicated problem when AIDSVu data are added. This is not only a problem of analysis of a huge number of data points (Big Data),(12-17) it is also a problem of dealing with the mathematical representation/codification of such diverse information from many different levels of organization of matter and areas of scientific knowledge. We can talk about three features of the problem resulting from the combination of chemical, pharmacological, and epidemiological information: (1) multitargeting, (2) multiobjective, and/or (3) multiscaling features. The multitargeting nature of the problem(18-20) refers to the existence of multitarget compounds that can interact with more than one molecular or cellular target. The multiobjective optimization problem (MOOP)(21-25) refers to the necessity of prediction/optimization of results for different experimental measures obtained in different pharmacological assays. Last, multiscaling refers to the different structural levels of the organization (i–vi) of matter that input variables. It means that we need to develop models able to link the changes in the AIDS prevalence in a given ath population with the changes in the biological activity of the qth drug (dq), due to variations in the chemical structure, detected in preclinical assays carried out under a set of jth conditions (cj). We can use numerical descriptors of the molecular graph of the drug. In particular, some of these parameters are useful to quantify information about the properties of molecular, biological, and/or social systems (information measures). For instance, Shannon’s entropy measures are universal parameters used to codify biologically relevant information in many systems. In the 1970s Bonchev and Trinajstic et al. published some works about the use of Shannon’s entropy to calculate a structural information parameter.(26-29) Kier published other seminar works on the use of Shannon’s entropy to encode molecular structure in chemoinformatics studies in 1980.(29) In this context, a drug molecule is considered an information source. Many other authors used Shannon’s entropy parameters to encode small molecule structure.(30-35) Graham et al.(36-40) used entropy measures to study in depth the information properties of organic molecules. These concepts were extended to describe protein,(41, 42) DNA sequences,(43) or protein–protein interaction networks.(44) Mikoláš et al.(45) reviewed several studies about the use of entropy measures in functional magnetic resonance. In a recent work we have used Shannon entropy measures and the idea of Moving Average (MA) operators in a time series analysis with a similar purpose.(46) Additionally, information indices are graph-theoretical invariants that view the molecular graph as a source of different probability distributions to which information theory definitions can be applied. They can be considered a quantitative measure of the lack of structural homogeneity or the diversity of a graph, in this way being related to the symmetry associated with structure.(47-49) Ivanciuc and Balaban(50) defined the indices for simple and weighted molecular graphs and tested the information theory-indices for modeling alkane densities. Moreover, Ivanciuc et al.(51) also found that the information indices were extended for any symmetric molecular matrix derived from vertex-and edge-weighted molecular graphs. Dehmer et al.(52-55) mentioned the Balaban information indices(56) in their work about novel topological descriptors for biological networks. However, the codification of the molecular structure of the drug is only the first step here. We have information about a high number of assays carried out in very different conditions (cj) for the same or different targets, which may be molecular or not. The nonstructural information herein refers to different assay conditions (cj) like time, concentrations, temperature, cellular targets, tissues, organisms, etc. A possible solution may rely upon the use of the idea of MA operators used in a time series analysis with a similar purpose.(46) MA models became popular after the initial works conducted by Box and Jenkins.(57) In a time series analysis, MA models may combine other operators I = Integrated, AR = Autoregressive, N = Nonlinear operators, or X = Exogenous effects. In this sense, we can develop models like ARMA, ARIMA, VARIMA, ARIMAX, NARMA, etc., combining different operators. The MA operators used in time series are the average value of a characteristic of the system for different intervals of time or seasons. In multiobjective modeling, we calculate the MA operators as the average of the property of the system (molecular descriptors or others) for all drugs or targets with a specific response in an assay carried out at under a subset of conditions (cj). Consequently, our MA operator does not act over a time domain but over a subset of conditions of the pharmacological assays. The idea of application of MA operators to other domains different from time is gaining adepts due to its.
(4) advantages. For instance, Botella-Rocamora et al.(58) developed a model map of diseases called SMARS: Spatial Moving Average Risk Smoothing. They applied the MA of time series theory to the spatial domain, making use of a spatial MA to define dependence on the risk of a disease occurring. Certainly, we can see this entire problem as the prediction of a complex network represented by the Boolean matrix L with elements Laq. That is, we have to seek a model able to assess the formation (Laq = 1) or not (Laq = 0) of links between nodes in a complex network of AIDS pharmacoepidemiology in the US. Two different classes of nodes make up this network, the first representing the US counties (a) and the other class of nodes representing drugs (dq). In the present context, we can use MA of properties of network nodes (drugs, proteins, organisms, counties, etc.) that form links (Laq) in a specific subset of conditions (cj). For this reason, we decided to call this strategy ALMA (Assessing of Links with Moving Averages) models. Speck-Planche and Cordeiro(59-61) have reported different multitarget models using the same type of ALMA approach. Last, we can use these information descriptors and MA operators as inputs for a Machine Learning (ML) algorithm. This ML has to seek the coefficients of the ALMA model able predict the correct links in L. The neural network approximates the operation of the human brain,(62, 63) and this initially ″trained″ or fed large amounts of data and rules about data relationships. ANNs are in general nonlinear algorithms with a high number of processors (called neurons) which, in a classic picture, are distributed in layers and act in parallel (neurons in the same layer) or in series (pairs of neurons connected in different layers). In recent years, ANNs(64, 65) have turned out to be a powerful method for various practical applications in a great variety of disciplines, and they can be used to find complex relationships between inputs and outputs or to find models in data. Another aspect of ANNs(66, 67) is that there are different architectures, which require different types of algorithms for training; the trained ANN do not need to be reprogrammed.. 2 Materials and Methods Linear and Nonlinear ALMA Models The ALMA models are useful to assess the formation of links in different complex networks that are representations of complex systems. They are adaptable to all types of molecular descriptors and/or graphs invariants or descriptors for complex networks. In this work, we tried to seek a classification model. The overall output of this model is Laq(cj)pred. This variable is a prediction of the observed variable Laq(cj)obs. Both the observed and predicted variables are discrete Boolean variables (1, 0). The observed variable takes the value Laq(cj)obs = 1 if the observed score Saq(cj)obs > input cutoff or Laq(cj)obs = 0 otherwise. In analogy, the predicted variable Laq(cj)pred = 1 if the predicted score Saq(cj)pred > output cutoff or Laq(cj)pred = 0 otherwise. More specifically, we can say that the value is Laq(cj)obs = 1 when the Saq(cj)obs = Drug-Disease Ratio = DDRaq(cj) > cutoff and Laq(cj)obs = 0 otherwise. We defined the ratio as follows: Saq(cj)obs = DDRaq(cj) = [Dq(cj)/Da]. We calculated the numerator term as Dq(cj) = δj·zq(cj) = δj·[vq(cj) – AVG(v(cj))]/SD(v(cj)). In this operator, vq(cj) is the value of biological activity (EC50, IC50, Ki, ..., etc.) reported in the ChEMBL database for the qth drug assayed under the set of conditions cj = (cl, c2, c3, c4). The parameter δj is similar to a Kronecker delta function. The parameter δj = 1 when the biological activity parameter vq(cj) is directly proportional to the biological effect (e.g., K i values, Activity (%) values, etc.). Conversely, δj = −1 when the biological activity parameter vq(cj) is in inverse proportion to the biological effect (e.g., EC50 values, IC50 values, etc.). The parameter zq(cj) is the z-score of the biological activity that depends on the functions AVG and SD. These functions are the average and standard deviation of vq(cj) for all drugs assayed under the same conditions. In this sense, c1 = is the experimental measure of activity, c2 = is the protein target, c3 = is the organism that expresses the target, and c4 = is the assay protocol per se. In the denominator, we used the term Da that is the AIDS prevalence rate for the ath county. We can conclude that Laq(cj)obs and consequently Laq(cj)pred depend on both the prevalence of the disease and the.
(5) effectiveness of the drug due to the definition of DDRaq(cj). In Table 1, a simple example of calculation of MA operators is shown. In this example, we only use the condition (c2), i.e., Balaban information index U= Iq1 and the target of the drug, to illustrate the method. First, we have the SMILE codes of the compounds obtained from ChEMBL. Next, using the DRAGON Software(68) we calculated the Balaban Information Indices (in this case only U = Iq1). Afterward, we calculated ⟨Iq1⟩ the average of the information index Iq1 for the compounds with the same targets. Last, we calculated the MA operators with the formula ΔIq1(c2) = (Iq1 – ⟨Iq1⟩c2. In our work, this method was applied to the 43,249 molecules characterized by different Balaban Information indices (U = Iq1, V = Iq2, X = Iq3, Y = Iq4) and assay conditions cj = (cl, c2, c3, c4). In addition, ⟨Dq(cj)⟩ is the average value of the biological activity for all the drugs assayed under the same conditions. Consequently, ΔDq(cj) is an MA operator that accounts for the deviation of the biological activity of the drug Dq(cj) in a preclinical assay with respect to the average value ⟨Dq(cj)⟩ of this activity for all drugs assayed under the same conditions cj.. In order to seek a model able to predict Laq(cj)pred, we used as input different information descriptors for drugs and populations. In general, we refer to an information index Iqk of type kth for the system (drug or county in this case) represented by a matrix L. The aim of this model is to predict scores Saq(cj) of the formation of links Laq using as input the structural information quantified by the indices Ia0(t) for the population (county) and Iqk of a given compound dq. The simplest model may be based on the additive hypothesis H0. The hypothesis H0 states that Saq(cj) = q Sk + qjSk + asSk + e0. It means that it can be calculated as a summation of different scores or measures of factors plus a model error e0. We have three types of scores or factors divided into two subtypes. The first subtype includes the scores for drugs and the second subtype the scores for counties. The first scores qSk ≈ ek·p(cl)·Iqk account for information on both the contributions of the kth molecular descriptor and for the quality of raw data p(cl) to the final activity score Saq(cj). In fact, we used the probability p(c1) = 1.0; 0.75; or 0.5 for data curated in CHEMBL database at expert, intermediate, or autocuration levels, respectively. The second scores qjSk ≈ ekj·ΔIqk(cj) account for the contributions of deviations ΔIqk(cj) = (Iqk – ⟨Iqk⟩j) in the structure of the drug from the average of all those molecules assayed under the conditions cj. In order to test this hypothesis we used the information indices and their MA operators ΔIqk(cj) = Iqk – ⟨Iqk(cj)⟩ to express the different assay conditions for the drugs. We also used a simple information index Ia0(t) for income inequality in the different counties. The linear model ALMA has the following general form:.
(6) The reader should note that the predicted, output, or dependent variable Saq(cj) is not a discrete variable but a real-valued numerical score. However, the variable Saq(cj) is directly proportional to the observed variable (Laq). Please, note that all the parameters Saq(cj) => Laq(cj) => DDRaq(cj) => Dq(cj) form a series that in the last instance depends on (=>) the conditions of the initial preclinical assay used to measure the activity of the drug cj = (cl, c2, c3, c4). In general, cj refers to different boundary conditions for the assay, e.g., targets, assays, cellular lines, organisms, organs, etc. In this sense, c1 = is the experimental measure of activity, c2 = is the protein target, c3 = is the organism that expresses the target, and c4 = is the assay protocol per se. Some inputs of the models depend on parameters of the type of deviations ΔIqk(cj), which are similar to the MA operators used in the time series analysis for ARIMA models and others.(57) This means that, first, we add up for instance the values of Iqk for all the nj drugs under the assay conditions cj. Next, we divide this sum by the number of compounds nj under this condition.. In order to seek the coefficients of the model, we can use a linear classification technique like ANN implemented in the STASTITICA 6.0 software package.(69) The statistical parameters used to corroborate the model were as follows: Number of cases in training (N), and overall values of Specificity (Sp), Sensitivity (Sn), and Accuracy (Ac).(70) CHEMBL Data Set of Drugs We downloaded from the public database CHEMBL a general data set composed of >8,000 multiplexing assay end points (results of multiple assays).(8, 9) The data set used to perform the model included N = 43,249 statistical cases made up of Nd = 21,582 unique drugs. These drugs have been assayed one by one in at least one out of 10 possible standard type measures determined in at least one out of 4,856 different assays (experimental protocols reported as different in ChEMBL). Each assay involved, in turn, at least one out of 9 nonmolecular or protein targets expressed in tissues, cells, or viral particles of at least one out of 5 different organisms (including human cells lines). Balaban Information Indices of Molecular Graphs of Drugs The Balaban information indices(56) U, V, X, and Y are very useful to quantify information about the chemical structure of drugs.(71) These indices use some the following parameters: σx = vertex distance degree of xth atom (i.e., sum of topological distances from the considered atom to any other atom), dxy is the topological distance between atoms xth and yth atoms; n is the number of non-H atoms. Other parameters used are gfx = the number of distances from the xth vertex equal to g and ηx = the eccentricity of the xth atom (i.e., the maximum topological distance from the considered atom). We denoted these indices in the present work as Iqk. In this notation, the letter I.
(7) stands for the information index, q indicates the number of order (label) of the drug in the data set, and k indicates the type of index. The mathematical formulas for calculation of these indices are. AIDSvu Data Set of AIDS Prevalence in the US at County Level Data were drawn from the AIDSVu database of the Rollins School of Public Health at Emory University (www.aidsvu.org). We downloaded the values of epidemiological variables for AIDS in the US at county level from the public database. The values used in this study included the percentage of adults/adolescents living with an HIV diagnosis in 2010 per 100,000 populations. The county-level HIV surveillance data displayed on AIDSVu are estimated data for persons aged 13 and older living with an HIV infection diagnosis. All race groups are non-Hispanic, and the Hispanic/Latino ethnicity is inclusive of all races. Sex is defined as “sex at birth”. Data are not displayed at the county level for Asians, Native Hawaiians/Other Pacific Islanders, and American Indians/Alaska Natives because these data do not meet CDC’s criteria for statistical reliability, data quality, or confidentiality due to small population denominators and HIV case counts. The total number of counties is na = 2,310. Shannon Information Indices of Income Inequality We can calculate an information index to quantify the possibility of AIDS spreading/prevalence in different counties (a) of the US. Let be an initial situation in which each county has a value of AIDS prevalence rate Da at the initial time (t0 = 2010). We used here a simple information index Ia0(t) for income inequality in the different counties that year. This index depends on the probability 0pa with which the county presents certain income inequality. We set here this probability 0pa = Ga. In this definition, Ga is the Gini measure of income inequality in the ath county of (a) given state(s) in the US.(72) The class of information indices selected by us was the Shannon entropy indices.(73).
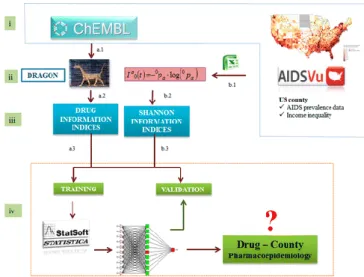
(8) 3 Results and Discussion Definition of the Algorithm In this work, we report for the first time a model based on information indices of chemical structure, biological assay, and county level income inequality. The model is able to link the deviations in the AIDS prevalence in the ath county with the changes in the biological activity of the qth drug (dq). In so doing, the model considers the biological activity of anti-HIV compounds detected in preclinical assays carried out under a set of jth conditions (cj). Using this type of model, we can predict the pharmacoepidemiology complex network for AIDS in the United States at county level. First, we propose a new algorithm to construct this type of models. The algorithm/model used as input both drug structures and preclinical information as well as county income inequality data. We understand here as algorithm the series of all steps given in different stages in order to seek and use the model. We illustrate the different steps of this algorithm in Figure 1. The stages of the algorithm proposed are the following: (i) data compilation, (ii) data preprocessing, (iii) calculation of inputs, (iv) development, and use of the model. These stages are similar and divided into two parallel branches (A and B). Both branches have different steps, one for the chemical and biological information of drugs and the other for the information about county pharmacoepidemiology. Next, after the preprocessing stage (ii), the two branches are joined into a single branch (C) that enters a cycle of training vs validation of the different ANN models and ends with the selection and use of the best model found. In this context, we understand as model the ANN trained and validated in the final step of the algorithm. The most important steps for the branches A and B are the following (the software/databased used are between round brackets): a.1. Gathering of the chemical structure and biological activity information from public sources (ChEMBL). a.2. Processing of the information about molecular structure (SMILE codes) and biological activity (EXCEL). a.3. Calculation of Iqk values and MA operators for the molecules (DRAGON,(68) EXCEL). b.1. Downloading the US AIDS prevalence and income inequality data (AIDSVu). b.2. Calculation of the simple information index Ia0(t) for income inequality in the different counties. c.5. Training and validation of ANN predictive models (STATISTICA).(69). Figure 1. Flowchart of all steps given to construct the ANNs for the DrugCounty Pharmacoepidemiology model in the United States..
(9) Model Training and Validation In the first step, we calculated the values drug-disease ratio DDRaq(cj)obs for the 43,249 drugcounty pairs. After that, we carried out a cutoff scanning and found that we can split the data set into 11,089 cases with Laq(cj)obs = 1 and 32,160 cases with Laq(cj)obs = 0 using a cutoff = 500. This is 25.6% of the positive cases that ensure a ratio of above 1/4 of positive vs control cases. The data set used to train the model includes N = 32,437 statistical cases. The data set used to validate the model includes N = 10,812 statistical cases. The cases used in the validation set (external validation set) were never used to train the model. Overall, training + validation sets include N = 43,249 statistical cases. Next, we calculated the values of the Balaban information indices Iqk for all the drugs/organic compounds present in our ChEMBL subset (step a.2). Table 2 shows some examples of these values Iqk for known drugs. In addition, in Table SM1 of the Supporting Information content we list the values of Iqk for all the drugs studied. We can see that the information indices Iqk have different numerical values for different molecular structures of drugs. After that, we calculated the average values of these indices ⟨Iqk⟩ for the different boundary conditions (cj). In Table 3, you can see some examples of these average values for different boundary conditions like targets, organisms, etc. After a visual inspection, one can note that the ⟨Iq1⟩ values seem to distinguish more clearly between the different boundary conditions. For instance, they have differences in the range of 10–100 units for 9 different protein targets (4 HIV vs five human proteins) present in the data set. However, the other averages <Iqk> with k > 1 seem to be worse at differentiating the proteins. In Table SM2 of the Supporting Information, we list the values of <Iqk> for all the organisms, assay protocols, protein targets, and experimental measures studied. Next, we calculated the values of the information indices Ia0(t) for different US counties. Consequently, we used only the Ia0(t) as inputs for the model. After that, we obtained the ANN models using as input 19 descriptors: 4 Balaban information indices of the molecules (Iqk), 14 MA operators (ΔIqk(cj)) for the different assay conditions for drugs (c1,c2,c3,c4), and the Ia0(t) of the US counties. In Table 4, we illustrate the values of Ia0(t) for some counties of different states. In Table SM3 of the Supporting Information, we list the values of Ia0(t) for the 2,310 US counties studied here. Figure 2 shows the AUROC values for the different ANN models. The LNN network shows values of AUROC = 0.82 in the training and external validation set. These values are typical of a classifier with a classification behavior different from a random classifier (AUROC = 0.5).(70) The sensitivity analysis allowed us to quantify (rank) and order (ratio) into a sequence the importance of the different chemoinformatics vs pharmacoepidemiology inputs. This kind of model may be useful to predict different situations of interest in pharmacoepidemiology. For instance, the model is able to identify when the same drugs present a strong effect on population epidemiology for different counties (Laq(cj)pred = 1). Table 6 shows the predictions for some cases with the LNN model. In the table we can see that the model predicts Laq(cj)pred =1 for Nevirapine(75) in different counties, which is a drug Laq(cj)obs = 1 for these counties. In Table SM4 of the Supporting Information, we provide the results predicted with the LNN model for all the cases in training and external validation series..
(10) Table 2. Values of Balaban Information Indices for Some Anti-HIV Compounds Iq1. Iq2. Iq3. Iq4. Ciprofloxacin. 33.562. 0.236. 0.352. 0.705. Apigenin. 29.885. 0.27. 0.407. 0.789. 50. Quercetin. 34.277. 0.276. 0.413. 0.819. 54. Haloperidol. 44.833. 0.185. 0.303. 0.477. 57. Nevirapine. 25.731. 0.284. 0.406. 0.916. 169. Ursolic Acid. 47.503. 0.217. 0.323. 0.663. 58. Mitoxantrone. 60.8. 0.236. 0.363. 0.671. 61. Podofilox. 41.071. 0.211. 0.314. 0.644. 66. (+)-Taxifolin. 34.277. 0.276. 0.413. 0.819. 76. Chloroquine. 42.46. 0.26. 0.414. 0.696. 107. Colchicine. 51.672. 0.287. 0.423. 0.882. 114. Saquinavir. 86.9. 0.151. 0.237. 0.415. 115. Indinavir. 76.144. 0.147. 0.233. 0.403. 116. Amprenavir. 69.801. 0.221. 0.342. 0.621. 117. Chrysin. 27.677. 0.282. 0.42. 0.837. 129. Zidovudine. 33.488. 0.331. 0.497. 0.973. 141. Lamivudine. 23.582. 0.349. 0.519. 1.03. 150. Kaempferol. 32.004. 0.278. 0.416. 0.828. 151. Luteolin. 32.088. 0.267. 0.404. 0.78. 160. Cyclosporine. 582.739. 0.44. 0.689. 1.214. 163. Ritonavir. 103.789. 0.161. 0.256. 0.435. 164. Myricetin. 36.608. 0.275. 0.412. 0.817. 168. Oleanolic Acid. 47.52. 0.215. 0.32. 0.653. 193. Nifedipine. 50.628. 0.377. 0.547. 1.204. 413. Sirolimus. 159.248. 0.178. 0.28. 0.488. 483. Tenofovir. 33.803. 0.293. 0.455. 0.81. 484. Adefovir. 31.274. 0.282. 0.443. 0.764. 593. Delavirdine. 52.159. 0.166. 0.267. 0.439. 625. Thiabendazole. 18.185. 0.311. 0.458. 0.935. 713. Entecavir. 29.767. 0.29. 0.43. 0.875. 729. Lopinavir. 90.532. 0.173. 0.271. 0.477. 853. Zalcitabine. 23.582. 0.349. 0.519. 1.03. 885. Emtricitabine. 25.889. 0.35. 0.52. 1.041. 964. Disulfiram. 60.801. 0.685. 1.063. 1.887. 991. Stavudine. 25.889. 0.35. 0.52. 1.041. 7187. Costatolide. 39.569. 0.262. 0.381. 0.826. 1460. Didanosine. 23.687. 0.29. 0.432. 0.863. 6246. Ellagic Acid. 29.481. 0.287. 0.412. 0.927. 7187. Costatolide. 39.569. 0.262. 0.381. 0.826. 8260. Baicalein. 29.825. 0.28. 0.418. 0.83. 9352. Naringenin. 29.885. 0.27. 0.407. 0.789. 12014. Harman. 18.019. 0.355. 0.502. 1.146. 13134. Palinavir. 95.629. 0.142. 0.226. 0.386. 16901. Honokiol. 36.232. 0.315. 0.478. 0.909. CMPD_ID. name. 8 28.
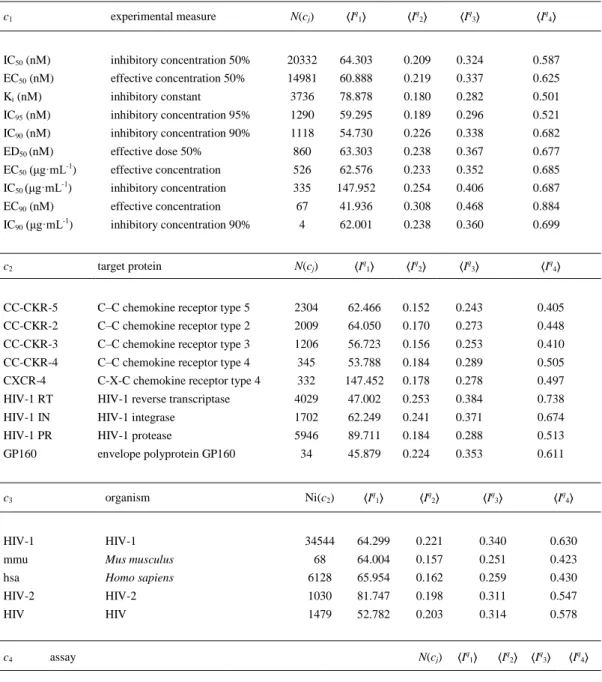
(11) Table 3. Average Values of the Information Descriptors of Molecular Structure under Different Boundary Conditions c1. experimental measure. N(cj). ⟨Iq1⟩. ⟨Iq2⟩. ⟨Iq3⟩. ⟨Iq4⟩. IC50 (nM). inhibitory concentration 50%. 20332. 64.303. 0.209. 0.324. 0.587. EC50 (nM). effective concentration 50%. 14981. 60.888. 0.219. 0.337. 0.625. Ki (nM). inhibitory constant. 3736. 78.878. 0.180. 0.282. 0.501. IC95 (nM). inhibitory concentration 95%. 1290. 59.295. 0.189. 0.296. 0.521. IC90 (nM). inhibitory concentration 90%. 1118. 54.730. 0.226. 0.338. 0.682. ED50 (nM). effective dose 50%. 860. 63.303. 0.238. 0.367. 0.677. EC50 (μg·mL-1). effective concentration. 526. 62.576. 0.233. 0.352. 0.685. IC50 (μg·mL-1). inhibitory concentration. 335. 147.952. 0.254. 0.406. 0.687. EC90 (nM). effective concentration. 67. 41.936. 0.308. 0.468. 0.884. IC90 (μg·mL-1). inhibitory concentration 90%. 4. 62.001. 0.238. 0.360. 0.699. c2. target protein. N(cj). ⟨Iq1⟩. ⟨Iq2⟩. ⟨Iq3⟩. ⟨Iq4⟩. CC-CKR-5. C–C chemokine receptor type 5. 2304. 62.466. 0.152. 0.243. 0.405. CC-CKR-2. C–C chemokine receptor type 2. 2009. 64.050. 0.170. 0.273. 0.448. CC-CKR-3. C–C chemokine receptor type 3. 1206. 56.723. 0.156. 0.253. 0.410. CC-CKR-4. C–C chemokine receptor type 4. 345. 53.788. 0.184. 0.289. 0.505. CXCR-4. C-X-C chemokine receptor type 4. 332. 147.452. 0.178. 0.278. 0.497. HIV-1 RT. HIV-1 reverse transcriptase. 4029. 47.002. 0.253. 0.384. 0.738. HIV-1 IN. HIV-1 integrase. 1702. 62.249. 0.241. 0.371. 0.674. HIV-1 PR. HIV-1 protease. 5946. 89.711. 0.184. 0.288. 0.513. GP160. envelope polyprotein GP160. 34. 45.879. 0.224. 0.353. 0.611. c3. organism. Ni(c2). ⟨Iq1⟩. ⟨Iq2⟩. ⟨Iq3⟩. ⟨Iq4⟩. HIV-1. HIV-1. 34544. 64.299. 0.221. 0.340. 0.630. mmu. Mus musculus. 68. 64.004. 0.157. 0.251. 0.423. hsa. Homo sapiens. 6128. 65.954. 0.162. 0.259. 0.430. HIV-2. HIV-2. 1030. 81.747. 0.198. 0.311. 0.547. HIV. HIV. 1479. 52.782. 0.203. 0.314. 0.578. c4. assay. N(cj). ⟨Iq1⟩. ⟨Iq2⟩. ⟨Iq3⟩. ⟨Iq4⟩. 1033994 antiviral activity against HIV1. 282 44.250 0.261 0.398 0.752. 708445 effective concentration required for the inhibition of HIV-1 IIIB in MT-4 cells. 176 102.090 0.158 0.251 0.424. 859312 inhibitory activity was determined against HIV type 1 protease. 175 112.916 0.164 0.258 0.450. 659084 inhibitory conc for displacement of [125I]-MIP-1 alpha from human CCR5 141 73.162 0.131 0.210 0.345 in CHO cell 763303 inhibition of HIV-1 protease. 118 72.588 0.177 0.269 0.515. 974332 displacement of [125I]MIP1alpha from human CCR5 expressed in CHO cells. 109 57.925 0.137 0.219 0.367. 660813 inhibitory activity against recombinant human Chemokine receptor type 3 (CCR3) expressed in Chinese hamster ovary cells. 108 57.228 0.154 0.248 0.406. 833931 inhibitory activity against wild type HIV-1 LAI cell line. 106 46.897 0.306 0.459 0.906.
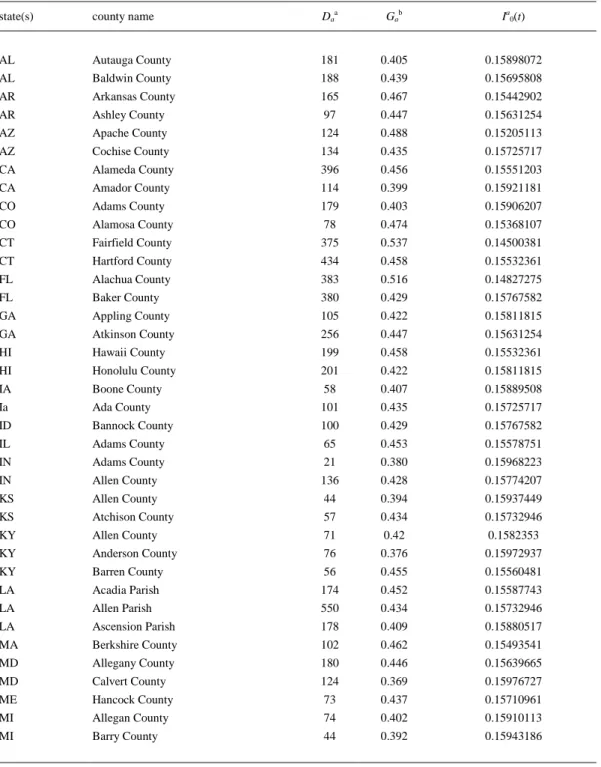
(12) Table 4. Values of Ia0(t) for Some Counties of Different States state(s). county name. Daa. Gab. Ia0(t). AL. Autauga County. 181. 0.405. 0.15898072. AL. Baldwin County. 188. 0.439. 0.15695808. AR. Arkansas County. 165. 0.467. 0.15442902. AR. Ashley County. 97. 0.447. 0.15631254. AZ. Apache County. 124. 0.488. 0.15205113. AZ. Cochise County. 134. 0.435. 0.15725717. CA. Alameda County. 396. 0.456. 0.15551203. CA. Amador County. 114. 0.399. 0.15921181. CO. Adams County. 179. 0.403. 0.15906207. CO. Alamosa County. 78. 0.474. 0.15368107. CT. Fairfield County. 375. 0.537. 0.14500381. CT. Hartford County. 434. 0.458. 0.15532361. FL. Alachua County. 383. 0.516. 0.14827275. FL. Baker County. 380. 0.429. 0.15767582. GA. Appling County. 105. 0.422. 0.15811815. GA. Atkinson County. 256. 0.447. 0.15631254. HI. Hawaii County. 199. 0.458. 0.15532361. HI. Honolulu County. 201. 0.422. 0.15811815. IA. Boone County. 58. 0.407. 0.15889508. Ia. Ada County. 101. 0.435. 0.15725717. ID. Bannock County. 100. 0.429. 0.15767582. IL. Adams County. 65. 0.453. 0.15578751. IN. Adams County. 21. 0.380. 0.15968223. IN. Allen County. 136. 0.428. 0.15774207. KS. Allen County. 44. 0.394. 0.15937449. KS. Atchison County. 57. 0.434. 0.15732946. KY. Allen County. 71. 0.42. 0.1582353. KY. Anderson County. 76. 0.376. 0.15972937. KY. Barren County. 56. 0.455. 0.15560481. LA. Acadia Parish. 174. 0.452. 0.15587743. LA. Allen Parish. 550. 0.434. 0.15732946. LA. Ascension Parish. 178. 0.409. 0.15880517. MA. Berkshire County. 102. 0.462. 0.15493541. MD. Allegany County. 180. 0.446. 0.15639665. MD. Calvert County. 124. 0.369. 0.15976727. ME. Hancock County. 73. 0.437. 0.15710961. MI. Allegan County. 74. 0.402. 0.15910113. MI. Barry County. 44. 0.392. 0.15943186. a b. Da is the AIDS prevalence rate in the county ath in 2010. Ga is the Gini income-inequality measure of the US county in 2010..
(13) Figure 2. ROC curve analysis of LNN (gray color) vs MLPs (other colors) classifiers..
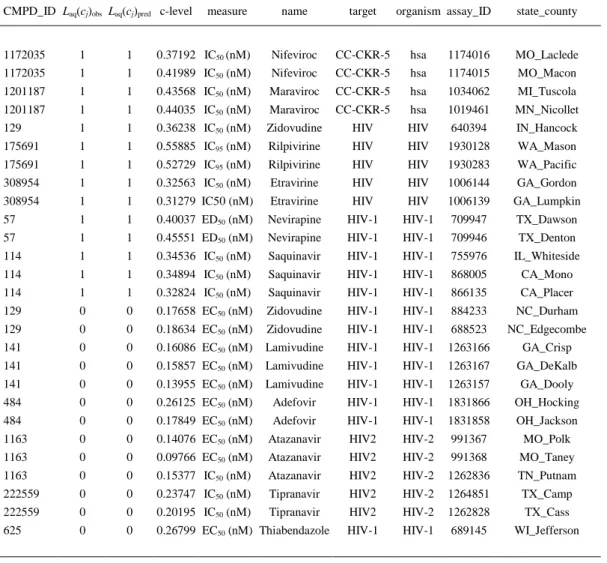
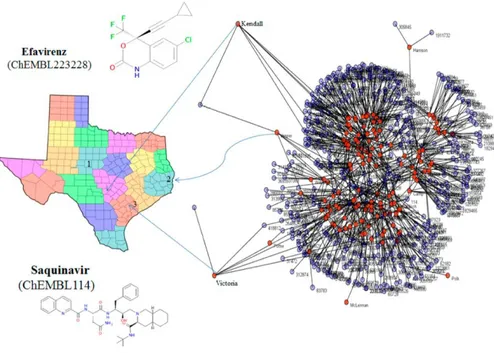
(14) Table 6. Predictions of Some Cases with the LNN Network CMPD_ID Laq(cj)obs Laq(cj)pred c-level. measure. name. target. organism assay_ID. state_county. 1172035. 1. 1. 0.37192 IC50 (nM). Nifeviroc. CC-CKR-5. hsa. 1174016. MO_Laclede. 1172035. 1. 1. 0.41989 IC50 (nM). Nifeviroc. CC-CKR-5. hsa. 1174015. MO_Macon. 1201187. 1. 1. 0.43568 IC50 (nM). Maraviroc. CC-CKR-5. hsa. 1034062. MI_Tuscola. 1201187. 1. 1. 0.44035 IC50 (nM). Maraviroc. CC-CKR-5. hsa. 1019461. MN_Nicollet. 129. 1. 1. 0.36238 IC50 (nM). Zidovudine. HIV. HIV. 640394. IN_Hancock. 175691. 1. 1. 0.55885 IC95 (nM). Rilpivirine. HIV. HIV. 1930128. WA_Mason. 175691. 1. 1. 0.52729 IC95 (nM). Rilpivirine. HIV. HIV. 1930283. WA_Pacific. 308954. 1. 1. 0.32563 IC50 (nM). Etravirine. HIV. HIV. 1006144. GA_Gordon. 308954. 1. 1. 0.31279 IC50 (nM). Etravirine. HIV. HIV. 1006139. GA_Lumpkin. 57. 1. 1. 0.40037 ED50 (nM). Nevirapine. HIV-1. HIV-1. 709947. TX_Dawson. 57. 1. 1. 0.45551 ED50 (nM). Nevirapine. HIV-1. HIV-1. 709946. TX_Denton. 114. 1. 1. 0.34536 IC50 (nM). Saquinavir. HIV-1. HIV-1. 755976. IL_Whiteside. 114. 1. 1. 0.34894 IC50 (nM). Saquinavir. HIV-1. HIV-1. 868005. CA_Mono. 114. 1. 1. 0.32824 IC50 (nM). Saquinavir. HIV-1. HIV-1. 866135. CA_Placer. 129. 0. 0. 0.17658 EC50 (nM). Zidovudine. HIV-1. HIV-1. 884233. NC_Durham. 129. 0. 0. 0.18634 EC50 (nM). Zidovudine. HIV-1. HIV-1. 688523. NC_Edgecombe. 141. 0. 0. 0.16086 EC50 (nM). Lamivudine. HIV-1. HIV-1. 1263166. GA_Crisp. 141. 0. 0. 0.15857 EC50 (nM). Lamivudine. HIV-1. HIV-1. 1263167. GA_DeKalb. 141. 0. 0. 0.13955 EC50 (nM). Lamivudine. HIV-1. HIV-1. 1263157. GA_Dooly. 484. 0. 0. 0.26125 EC50 (nM). Adefovir. HIV-1. HIV-1. 1831866. OH_Hocking. 484. 0. 0. 0.17849 EC50 (nM). Adefovir. HIV-1. HIV-1. 1831858. OH_Jackson. 1163. 0. 0. 0.14076 EC50 (nM). Atazanavir. HIV2. HIV-2. 991367. MO_Polk. 1163. 0. 0. 0.09766 EC50 (nM). Atazanavir. HIV2. HIV-2. 991368. MO_Taney. 1163. 0. 0. 0.15377 IC50 (nM). Atazanavir. HIV2. HIV-2. 1262836. TN_Putnam. 222559. 0. 0. 0.23747 IC50 (nM). Tipranavir. HIV2. HIV-2. 1264851. TX_Camp. 222559. 0. 0. 0.20195 IC50 (nM). Tipranavir. HIV2. HIV-2. 1262828. TX_Cass. 625. 0. 0. 0.26799 EC50 (nM) Thiabendazole. HIV-1. HIV-1. 689145. WI_Jefferson. Last, we used this LNN-ALMA model to generate/predict a complex network of the AIDS prevalence in the US at county level with respect to the preclinical activity of anti-HIV drugs in preclinical assays. The network is bipartite with two classes of nodes (counties vs drugs). In this sense, it is a multiscale network similar to the bipartite networks of drugs vs target proteins reported by other groups.(76-80) However, the drug nodes of the present network contain information about the drug structure as well as all the assay conditions (target protein, organism, assay protocol, experimental measure). In addition, the other set of nodes is typical of a social network because they contain information about the income inequality in the county. Therefore, this complex network is multiscale, linking information about drugs, targets, assays, and society in the same line of thinking expressed by Barabasi et al.(81) The links of this complex network are the outputs Laq(cj)pred = 1 of our model. That is why we analyzed 43,249 data points to fit the model and predict the complex network at the same time. Consequently, we have to include values of AIDS prevalence in 2,310 US counties vs ChEMBL results for 21,582 unique drugs, 9 viral or human protein targets, 4,856 protocols, and 10 possible experimental measures. In Figure 3, we illustrate the subnetwork of AIDS prevalence vs anti-HIV drug preclinical activity for the state of Texas. We include some examples of drugs like Efavirenz (ChEMBL223228) and Saquinavir (ChEMBL114) with observed and predicted Laq(cj)obs = Laq(cj)pred = 1 effects on AIDS prevalence in the counties of Kendall, Jasper, and Victoria, respectively..
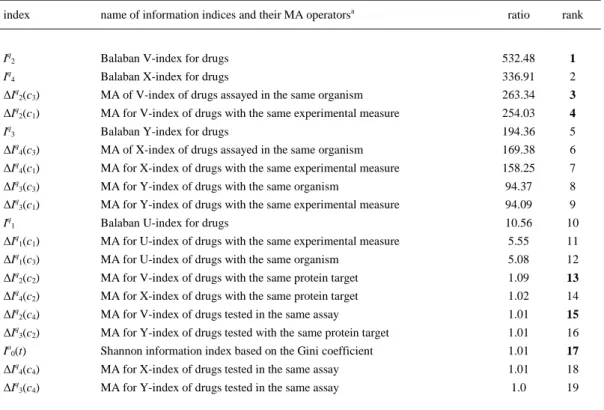
(15) Figure 3. Predicted subnetwork of AIDS prevalence vs anti-HIV drug preclinical activity for Texas.. We used the sensitivity analysis of the ANN module implemented in STATISTICA to detect the parameters with the higher contribution to the model. We can conduct the sensitivity analysis on the inputs to one ANN by a STATISTICA Neural Networks algorithm. The sensitivity analysis ranks the order of input importance by treating each input variable in turn as if it were “unavailable”.(82) It is defined a missing value substitution procedure, which allows predictions to be made in the absence of values for one or more inputs. To define the sensitivity of a particular variable X, the first run uses the network on a set of test cases and accumulates the network error. In the second step, the network is employed again using the same cases but replacing the observed values of X with the value estimated by the missing value procedure, and again it calculated the accumulated network error. By removing the variable X, it is expected for some deterioration in error to occur. Therefore, the measure of sensitivity is the ratio of the error with missing value substitution to the original error. The more sensitive the network is to a particular input, the greater the deterioration is expected, and therefore the greater the ratio. The elimination of a variable with ratio ≤1 improves or has no effect on the performance of the ANN. After the sensitivities are calculated, they are ranked in order. In Table 7 we can see that the model shows a higher relevance to the information about the molecular structure, parameters of type Iqk. Second, the model ranks the information about the organism used to measure the biological activity, parameters of type ΔIqk(c3). The third type of relevant input is the experimental measure used to quantify the activity of the drug, parameters of type ΔIqk(c1). The fourth ranked inputs in order of importance are parameters of type ΔIqk(c2), which quantify the target protein. The fifth type of input quantifies information about the assay protocol used to test the drug. The last effect introduced in the model was the information about income inequality in the county Ia0(t). Thus, the sensitivity analysis shows that the model is ranked according to the importance of factors in the following order (AIDS epidemiology/anti-HIV drug) ≈ structure of drug > organism in preclinical assay > experimental measure of activity > drug target > pharmacological assay > county income inequality. Table 7 depicts the parameters in decreasing order of their contribution to the model (higher contribution => higher ratio => lower rank). The five parameters with higher contribution are the following: Iq2, Iq4, ΔIq2(c3), ΔIq2(c1), Iq3. The parameters of higher contribution for each type of information are the following: Iq2 with rank = 1, ΔIq2(c3) rank = 3, ΔIq2(c1) with rank = 4, ΔIq2(c2) with rank = 13, ΔIq2(c4) with rank = 15, and Ia0(t) with rank = 17 (shown in boldface in Table 7)..
(16) We retrained the model using only these parameters, but the new ANN fails to generate good predictive models with Sp and Sn < 50%. It means that the model provides a greater importance to the chemical structure and pharmacological information (branch A), with respect to county information (branch B), but it needs all the parameters. This could be explained taking into consideration that branch A includes the higher number of input factors (information considered), whereas branch B includes only one input factor, the income-inequality in the county with respect to the state. We should also note that the only epidemiological feature used as input to calculate the Shannon information indices of the county was the Ga measure of income inequality. The Ga measure of income-inequality is widely used as a descriptor to approach the study of the epidemiology of different diseases.(83, 84) The values of Ga ≈ 0 are characteristic of societies with near-to-ideal equalitarian distribution of income, whereas values of Ga ≈ 1 are typical of inequality in income distribution.(85) Gant et al.(86) found a positive value of the Pearson correlation coefficient ρ = 0.40 between AIDS diagnosis rates and Ga for 1,560 US counties between 2006 and 2008. However, they also found a positive correlation (ρ = 0.52) with proportion unmarried – ages >15 years. The AIDSVu data presented an average value of Ga = 0.435 and a standard deviation of only 0.03. The AIDSVu data set analyzed in this work presents an even weaker correlation (ρ = 0.31) between AIDS diagnosis rates in 2010 and Ga for the 2,310 US counties studied in this work. It may indicate that possibly we should include other factors in branch B in order to collect additional epidemiological information relevant to the present problem. In upcoming papers we will continue working on the strategy described here, including other information indices of the molecules, other epidemiological factors, different disease transmission matrices, and using different types of machine learning algorithms.. Table 7. Sensitivity Analysis for the LNN Network index. name of information indices and their MA operatorsa. Iq2 Iq4. ratio. rank. Balaban V-index for drugs. 532.48. 1. Balaban X-index for drugs. 336.91. 2. ΔIq2(c3). MA of V-index of drugs assayed in the same organism. 263.34. 3. ΔIq2(c1). MA for V-index of drugs with the same experimental measure. 254.03. 4. Iq3. Balaban Y-index for drugs. 194.36. 5. ΔIq4(c3). MA of X-index of drugs assayed in the same organism. 169.38. 6. ΔIq4(c1). MA for X-index of drugs with the same experimental measure. 158.25. 7. ΔIq3(c3). MA for Y-index of drugs with the same organism. 94.37. 8. ΔIq3(c1). MA for Y-index of drugs with the same experimental measure. 94.09. 9. Iq1. Balaban U-index for drugs. 10.56. 10. ΔIq1(c1). MA for U-index of drugs with the same experimental measure. 5.55. 11. ΔIq1(c3). MA for U-index of drugs with the same organism. 5.08. 12. ΔIq2(c2). MA for V-index of drugs with the same protein target. 1.09. ΔIq4(c2). MA for X-index of drugs with the same protein target. 1.02. 13 14. ΔIq2(c4). MA for V-index of drugs tested in the same assay. 1.01. 15. ΔIq3(c2). MA for Y-index of drugs tested with the same protein target. 1.01. 16. I 0(t). Shannon information index based on the Gini coefficient. 1.01. 17. ΔIq4(c4). MA for X-index of drugs tested in the same assay. 1.01. 18. ΔIq3(c4). MA for Y-index of drugs tested in the same assay. 1.0. 19. a. a. MA = Moving Average operator of Box-Jenkins..
(17) 4 Conclusions We developed a model called LNN-ALMA to generate complex networks of the AIDS prevalence in the US counties with respect to the preclinical activity of anti-HIV drugs. The best classifier found was the LNN; the inputs of this classifier are based on Balaban information indices. Consequently, this model may be useful to predict the most effective drugs to treat HIV in different populations (from the US counties) with a given epidemiological prevalence. In future work, we will continue to improve the models, and we will include other information indices, social and economic factors, machine-learning techniques, etc.. Supporting Information The additional tables include the information indices for all the molecules, averages of information indices of the molecules, information indices for the all the US counties, and the results of the LNN model. This material is available free of charge via the Internet at http://pubs.acs.org. The authors declare no competing financial interest.. Acknowledgment The authors sincerely thank the kind attention of the JCIM Editor Anton J. Hopfinger, University of New Mexico, College of Pharmacy as well as excellent recommendations made by unknown reviewers of this manuscript. R.O.M acknowledges financial support of the FPI fellowship associated with the research project (AGL2011-30563-C03-01) funded by MECD (Spanish Ministry of Education, Culture and Sport).. References (1) (2). (3) (4). (5). (6). (7) (8) (9). (10) (11) (12) (13) (14) (15) (16) (17). Yu, F.; Lu, L.; Du, L.; Zhu, X.; Debnath, A. K.; Jiang, S.Approaches for identification of HIV-1 entry inhibitors targeting gp41 pocket Viruses 2013, 5, 127– 149 Gengiah, T. N.; Baxter, C.; Mansoor, L. E.; Kharsany, A. B.; Abdool Karim, S. S.A drug evaluation of 1% tenofovir gel and tenofovir disoproxil fumarate tablets for the prevention of HIV infection Expert Opin. Invest. Drugs 2012, 21, 695– 715 Cohen, M. S.; Hellmann, N.; Levy, J. A.; DeCock, K.; Lange, J.The spread, treatment, and prevention of HIV-1: evolution of a global pandemic J. Clin. Invest. 2008, 118, 1244– 1254 Zuo, T.; Liu, D.; Lv, W.; Wang, X.; Wang, J.; Lv, M.; Huang, W.; Wu, J.; Zhang, H.; Jin, H.; Zhang, L.; Kong, W.; Yu, X.Small-molecule inhibition of human immunodeficiency virus type 1 replication by targeting the interaction between Vif and ElonginC J. Virol. 2012, 86, 5497– 5507 Sun, L. Q.; Zhu, L.; Qian, K.; Qin, B.; Huang, L.; Chen, C. H.; Lee, K. H.; Xie, L.Design, synthesis, and preclinical evaluations of novel 4-substituted 1,5-diarylanilines as potent HIV-1 non-nucleoside reverse transcriptase inhibitor (NNRTI) drug candidates J. Med. Chem. 2012, 55, 7219– 7229 Deng, K.; Zink, M. C.; Clements, J. E.; Siliciano, R. F.A quantitative measurement of antiviral activity of anti-human immunodeficiency virus type 1 drugs against simian immunodeficiency virus infection: dose-response curve slope strongly influences class-specific inhibitory potential J. Virol. 2012, 86, 11368– 11372 Liao, C.; Nicklaus, M. C.Computer tools in the discovery of HIV-1 integrase inhibitors Future Med. Chem. 2010, 2, 1123– 1140 Heikamp, K.; Bajorath, J.Large-scale similarity search profiling of ChEMBL compound data sets J. Chem. Inf. Model. 2011, 51, 1831– 1839 Gaulton, A.; Bellis, L. J.; Bento, A. P.; Chambers, J.; Davies, M.; Hersey, A.; Light, Y.; McGlinchey, S.; Michalovich, D.; Al-Lazikani, B.; Overington, J. P.ChEMBL: a large-scale bioactivity database for drug discovery Nucleic Acids Res. 2012, 40, D1100– 1107 AIDSVu. http://aidsvu.org/ (accessed September 21, 2013) . Mok, N. Y.; Brenk, R.Mining the ChEMBL database: an efficient chemoinformatics workflow for assembling an ion channel-focused screening library J. Chem. Inf. Model. 2011, 51, 2449– 2454 Chiolero, A.Big data in epidemiology: too big to fail? Epidemiology 2013, 24, 938– 939 Hamilton, B.Impacts of big data. Potential is huge, so are challenges Health Manage. Technol. 2013, 34, 12– 13 Mallon, W. J.Big data J. Shoulder Elbow Surg. 2013, 22, 1153 Moore, K. D.; Eyestone, K.; Coddington, D. C.The big deal about big data Healthc. Financ. Manage. 2013, 67 ( 60–66) 68 Toh, S.; Platt, R.Big data in epidemiology: too big to fail? Epidemiology 2013, 24, 939 Gijzen, H.Development: Big data for a sustainable future Nature 2013, 502, 38.
(18) (18) Hu, Y.; Bajorath, J.Molecular scaffolds with high propensity to form multi-target activity cliffs J. Chem. Inf. Model. 2010, 50, 500– 510 (19) Erhan, D.; L’Heureux P, J.; Yue, S. Y.; Bengio, Y.Collaborative filtering on a family of biological targets J. Chem. Inf. Model. 2006, 46, 626– 635 (20) Namasivayam, V.; Hu, Y.; Balfer, J.; Bajorath, J.Classification of compounds with distinct or overlapping multi-target activities and diverse molecular mechanisms using emerging chemical patterns J. Chem. Inf. Model. 2013, 53, 1272– 1281 (21) Cruz-Monteagudo, M.; Cordeiro, M. N.; Tejera, E.; Dominguez, E. R.; Borges, F.Desirability-based multi-objective QSAR in drug discovery Mini-Rev. Med. Chem. 2012, 12, 920– 935 (22) Machado, A.; Tejera, E.; Cruz-Monteagudo, M.; Rebelo, I.Application of desirability-based multi(bi)objective optimization in the design of selective arylpiperazine derivates for the 5-HT1A serotonin receptor Eur. J. Med. Chem. 2009, 44, 5045– 5054 (23) Saiz-Urra, L.; Bustillo Perez, A. J.; Cruz-Monteagudo, M.; Pinedo-Rivilla, C.; Aleu, J.; HernandezGalan, R.; Collado, I. G.Global antifungal profile optimization of chlorophenyl derivatives against Botrytis cinerea and Colletotrichum gloeosporioides J. Agric. Food Chem. 2009, 57, 4838– 4843 (24) Cruz-Monteagudo, M.; Borges, F.; Cordeiro, M. N.; Cagide Fajin, J. L.; Morell, C.; Ruiz, R. M.; Canizares-Carmenate, Y.; Dominguez, E. R.Desirability-based methods of multiobjective optimization and ranking for global QSAR studies. Filtering safe and potent drug candidates from combinatorial libraries J. Comb. Chem. 2008, 10, 897– 913 (25) Nicolaou, C. A.; Brown, N.; Pattichis, C. S.Molecular optimization using computational multi-objective methods Curr. Opin. Drug Discovery Dev. 2007, 10, 316– 324 (26) Mekenyan, O.; Bonchev, D.; Trinajstic, N.Chemical graph theory modeling the thermodynamic properties of molecules Int. J. Quantum Chem., Symp. 1980, 18, 369– 380 (27) Bonchev, D.; Trinajstic, N.Information theory, distance matrix, and molecular branching J. Chem. Phys. 1977, 67, 4517– 4533 (28) Bonchev, D.; Kamenski, D.; Kamenska, V.Symmetry and information content of chemical structures Bull. Math. Biol. 1976, 38, 119– 133 (29) Kier, L. B.Use of molecular negentropy to encode structure governing biological activity J. Pharm. Sci. 1980, 69, 807– 810 (30) Stahura, F. L.; Godden, J. W.; Bajorath, J.Differential Shannon entropy analysis identifies molecular property descriptors that predict aqueous solubility of synthetic compounds with high accuracy in binary QSAR calculations J. Chem. Inf. Comput. Sci. 2002, 42, 550– 558 (31) Stahura, F. L.; Godden, J. W.; Xue, L.; Bajorath, J.Distinguishing between natural products and synthetic molecules by descriptor Shannon entropy analysis and binary QSAR calculations J. Chem. Inf. Comput. Sci. 2000, 40, 1245– 1252 (32) Agrawal, V. K.; Khadikar, P. V.Modelling of carbonic anhydrase inhibitory activity of sulfonamides using molecular negentropy Bioorg. Med. Chem. Lett. 2003, 13, 447– 453 (33) Katritzky, A. R.; Lomaka, A.; Petrukhin, R.; Jain, R.; Karelson, M.; Visser, A. E.; Rogers, R. D.QSPR correlation of the melting point for pyridinium bromides, potential ionic liquids J. Chem. Inf. Comput. Sci. 2002, 42, 71– 74 (34) Katritzky, A. R.; Perumal, S.; Petrukhin, R.; Kleinpeter, E.Codessa-based theoretical QSPR model for hydantoin HPLC-RT lipophilicities J. Chem. Inf. Comput. Sci. 2001, 41, 569– 574 (35) Roy, K.; Saha, A.Comparative QSPR studies with molecular connectivity, molecular negentropy and TAU indices. Part I: molecular thermochemical properties of diverse functional acyclic compounds J. Mol. Model. 2003, 9, 259– 270 (36) Graham, D. J.; Schacht, D. V.Base information content in organic formulas J. Chem. Inf. Comput. Sci. 2000, 40, 942– 946 (37) Graham, D. J.Information content in organic molecules: structure considerations based on integer statistics J. Chem. Inf. Comput. Sci. 2002, 42, 215 (38) Graham, D. J.; Schulmerich, M. V.Information content in organic molecules: reaction pathway analysis via Brownian processing J. Chem. Inf. Comput. Sci. 2004, 44, 1612– 1622 (39) Graham, D. J.Information content in organic molecules: Brownian processing at low levels J. Chem. Inf. Model. 2007, 47, 376– 389 (40) Graham, D. J.Information content in organic molecules: aggregation states and solvent effects J. Chem. Inf. Model. 2005, 45, 1223– 1236 (41) Strait, B. J.; Dewey, T. G.The Shannon information entropy of protein sequences Biophys. J. 1996, 71, 148– 155 (42) Dima, R. I.; Thirumalai, D.Proteins associated with diseases show enhanced sequence correlation between charged residues Bioinformatics 2004, 20, 2345– 2354 (43) Loewenstern, D.; Yianilos, P. N.Significantly lower entropy estimates for natural DNA sequences J. Comput. Biol. 1999, 6, 125– 142 (44) Manke, T.; Demetrius, L.; Vingron, M.Lethality and entropy of protein interaction networks Genome Inform. 2005, 16, 159– 163.
(19) (45) Mikolas, P.; Vyhnanek, J.; Skoch, A.; Horacek, J.Analysis of fMRI time-series by entropy measures Neuroendocrinol. Lett. 2012, 33, 471– 476 (46) Tenorio-Borroto, E.; Garcia-Mera, X.; Penuelas-Rivas, C. G.; Vasquez-Chagoyan, J. C.; Prado-Prado, F. J.; Castanedo, N.; Gonzalez-Diaz, H.Entropy model for multiplex drug-target interaction endpoints of drug immunotoxicity Curr. Top. Med. Chem. 2013, 13, 1636– 1649 (47) Bonchev, D.; Mekenyan, O.; Trinajstic, N.Isomer discrimation by topological information approach J. Comput. Chem. 1981, 2, 127– 148 (48) Bonchev, D. Information Theoretic Indices for Characterization of Chemical Structures; Research Studies Press: Chichester, U.K., 1983. (49) Todeschini, R.; Consonni, V. Handbook of Molecular Descriptors; Wiley-VCH Verlag GmbH: Weinheim, Germany, 2000. (50) Ivanciuc, O.; Balaban, A. T.Design of topological indices. Part 20. Molecular structure descriptors computed with information on distances operators Rev. Roum. Chim. 1999, 44, 479– 489 (51) Ivanciuc, O.; Ivanciuc, T.; Klein, D. J.Quantitative structure-property relationships generated with optimizable even/odd Wiener polynomial descriptors SAR QSAR Environ. Res. 2001, 12, 1– 16 (52) Dehmer, M. M.; Barbarini, N. N.; Varmuza, K. K.; Graber, A. A.Novel topological descriptors for analyzing biological networks BMC Struct. Biol. 2010, 10, 18 (53) Dehmer, M.; Grabner, M.; Varmuza, K.Information indices with high discriminative power for graphs PLoS One 2012, 7, e31214 (54) Dehmer, M.; Mowshowitz, A.A history of graph entropy measures Inf. Sci. (N.Y.) 2011, 181, 57– 58 (55) Emmert-Streib, F.; Dehmer, M.Information theoretic measures of UHG graphs with low computational complexity Appl. Math. Comp. 2007, 190, 1783– 1794 (56) Balaban, A. T.; Balaban, T. S.New vertex invariants and topological indices of chemical graphs based on information on distances J. Math. Chem. 1991, 8, 383– 397 (57) Box, G. E. P.; Jenkins, G. M. Time series analysis: Forecasting and control; Holden-Day: San Francisco, CA, 1970. (58) Botella-Rocamora, P.; Lopez-Quilez, A.; Martinez-Beneito, M. A.Spatial moving average risk smoothing Stat. Med. 2013, 32, 2595– 2612 (59) Speck-Planche, A.; Kleandrova, V. V.; Cordeiro, M. N.Chemoinformatics for rational discovery of safe antibacterial drugs: simultaneous predictions of biological activity against streptococci and toxicological profiles in laboratory animals Bioorg. Med. Chem. 2013, 21, 2727– 2732 (60) Speck-Planche, A.; Kleandrova, V. V.; Luan, F.; Cordeiro, M. N.Chemoinformatics in multi-target drug discovery for anti-cancer therapy: in silico design of potent and versatile anti-brain tumor agents AntiCancer Agents Med. Chem. 2012, 12, 678– 685 (61) Speck-Planche, A.; Kleandrova, V. V.; Luan, F.; Cordeiro, M. N.Chemoinformatics in anti-cancer chemotherapy: multi-target QSAR model for the in silico discovery of anti-breast cancer agents Eur. J. Pharm. Sci. 2012, 47, 273– 279 (62) Goles, E.; Palacios, A. G.Dynamical complexity in cognitive neural networks Biol. Res. 2007, 40, 479– 485 (63) Ramesh, A. N.; Kambhampati, C.; Monson, J. R.; Drew, P. J.Artificial intelligence in medicine Ann. R. Coll. Surg. Engl. 2004, 86, 334– 338 (64) Wesolowski, M.; Suchacz, B.Artificial neural networks: theoretical background and pharmaceutical applications: a review J. AOAC Int. 2012, 95, 652– 668 (65) Baykal, H.; Yildirim, H. K.Application of artificial neural networks (ANNs) in wine technology Crit. Rev. Food Sci. Nutr. 2013, 53, 415– 421 (66) Ponulak, F.; Kasinski, A.Introduction to spiking neural networks: Information processing, learning and applications Acta Neurobiol. Exp. 2011, 71, 409– 433 (67) Ghosh-Dastidar, S.; Adeli, H.A new supervised learning algorithm for multiple spiking neural networks with application in epilepsy and seizure detection Neural Netw. 2009, 22, 1419– 1431 (68) DRAGON, version 5.3; Talete srl: Milano, Italy, 2005. (69) STATISTICA, version 6.0; StatSoft Inc.: Tulsa, OK, 2001. (70) Hill, T.; Lewicki, P. STATISTICS Methods and Applications. A Comprehensive Reference for Science, Industry and Data Mining; StatSoft: Tulsa, OK, 2006. (71) Ivanciuc, O.; Balaban, T. S.; Balaban, A. T.Chemical graphs with degenerate topological indices based on information on distances J. Math. Chem. 1993, 14, 21– 33 (72) Pabayo, R.; Kawachi, I.; Gilman, S. E.Income inequality among American states and the incidence of major depression J. Epidemiol. Community Health 2014, 68, 110– 115 (73) Riera-Fernandez, P.; Munteanu, C. R.; Escobar, M.; Prado-Prado, F.; Martin-Romalde, R.; Pereira, D.; Villalba, K.; Duardo-Sanchez, A.; Gonzalez-Diaz, H.New Markov-Shannon entropy models to assess connectivity quality in complex networks: from molecular to cellular pathway, parasite-host, neural, industry, and legal-social networks J. Theor. Biol. 2012, 293, 174– 188 (74) Rosenblatt, F. Principles of neurodynamics; perceptrons and the theory of brain mechanisms; Spartan Books: Washington, DC, 1962..
(20) (75) Shubber, Z.; Calmy, A.; Andrieux-Meyer, I.; Vitoria, M.; Renaud-Thery, F.; Shaffer, N.; Hargreaves, S.; Mills, E. J.; Ford, N.Adverse events associated with nevirapine and efavirenz-based first-line antiretroviral therapy: a systematic review and meta-analysis AIDS 2013, 27, 1403– 1412 (76) Hecker, N.; Ahmed, J.; von Eichborn, J.; Dunkel, M.; Macha, K.; Eckert, A.; Gilson, M. K.; Bourne, P. E.; Preissner, R.SuperTarget goes quantitative: update on drug-target interactions Nucleic Acids Res. 2012, 40, D1113– 1117 (77) Prado-Prado, F.; Garcia-Mera, X.; Escobar, M.; Alonso, N.; Caamano, O.; Yanez, M.; Gonzalez-Diaz, H.3D MI-DRAGON: new model for the reconstruction of US FDA drug- target network and theoretical-experimental studies of inhibitors of rasagiline derivatives for AChE Curr. Top. Med. Chem. 2012, 12, 1843– 1865 (78) Prado-Prado, F.; Garcia-Mera, X.; Abeijon, P.; Alonso, N.; Caamano, O.; Yanez, M.; Garate, T.; Mezo, M.; Gonzalez-Warleta, M.; Muino, L.; Ubeira, F. M.; Gonzalez-Diaz, H.Using entropy of drug and protein graphs to predict FDA drug-target network: theoretic-experimental study of MAO inhibitors and hemoglobin peptides from Fasciola hepatica Eur. J. Med. Chem. 2011, 46, 1074– 1094 (79) Araujo, R. P.; Liotta, L. A.; Petricoin, E. F.Proteins, drug targets and the mechanisms they control: the simple truth about complex networks Nat. Rev. Drug Discovery 2007, 6, 871– 880 (80) Vina, D.; Uriarte, E.; Orallo, F.; Gonzalez-Diaz, H.Alignment-free prediction of a drug-target complex network based on parameters of drug connectivity and protein sequence of receptors Mol. Pharmaceutics 2009, 6, 825– 835 (81) Barabasi, A. L.; Gulbahce, N.; Loscalzo, J.Network medicine: a network-based approach to human disease Nat. Rev. Genet. 2011, 12, 56– 68 (82) Hunter, A.; Kennedy, L.; Henry, J.; Ferguson, I.Application of neural networks and sensitivity analysis to improved prediction of trauma survival Comput. Methods Programs Biomed. 2000, 62, 11– 19 (83) Burns, J. K.; Tomita, A.; Kapadia, A. S. Income inequality and schizophrenia: Increased schizophrenia incidence in countries with high levels of income inequality. Int. J. Soc. Psychiatry 2013, in press (84) Green, C.; Yu, B. N.; Marrie, R. A.Exploring the implications of small-area variation in the incidence of multiple sclerosis Am. J. Epidemiol. 2013, 178, 1059– 1066 (85) Feigl, A. B.; Ding, E. L.Evidenced formal coverage index and universal healthcare enactment: A prospective longitudinal study of economic, social, and political predictors of 194 countries Health Policy 2013, 113, 50– 60 (86) Gant, Z.; Lomotey, M.; Hall, H. I.; Hu, X.; Guo, X.; Song, R.A county-level examination of the relationship between HIV and social determinants of health: 40 states, 2006–2008 Open AIDS J. 2012, 6, 1– 7.
(21)
Figure

+5

Documento similar