Industrial pollution and adverse reproductive outcomes in Spain 2004 2008
118
0
0
Texto completo
(2)
(3) A mi madre, por creer en mí cuando era casi imposible hacerlo. A mi padre, por enseñarme a luchar. A mis hermanos, por existir..
(4)
(5) ACKNOWLEDGEMENTS En primer lugar me gustaría dar las gracias a mi director de tesis, Francisco Bolumar Montrull por acogerme en su grupo hace ya más de cuatro años. Porque siempre me ha demostrado que lo más importante es mi bienestar y felicidad por encima de sus propios intereses. Por permitirme desarrollarme profesionalmente a su lado, por entenderme y acompañarme en todas mis decisiones y locuras, dejarme siempre decidir sin presiones ni exigencias. Ha sido un placer trabajar todos estos años con el que el ser humano más positivo, vital y lleno de energía que he conocido en mi vida. Mi más sincero agradecimiento Gonzalo López-Abente, por embarcarse en este proyecto de forma totalmente altruista y desinteresada. Sin su inestimable guía y su continuo apoyo esto habría sido imposible. Gracias al grupo de epidemiologia ambiental y cáncer del centro nacional de epidemiología del Carlos III por cedernos todas sus bases de contaminación y coordenadas, construidas con una gran dedicación de tiempo y esfuerzo. Mi agradecimiento a Jesús por iniciarme en el camino y a los departamentos de salud pública y ciencias sanitarias de de la UMH y UAH. Especialmente a Inma, Cris, Blanca, Juanjo, Ramón y María por las risas, la complicidad y la compañía desde los inicios. Gracias a toda mi familia y amigos, por entender mis ausencias y despistes durante este camino hacia la tesis y porque vaya donde vaya, cuando vuelvo, ellos siempre están ahí. Y por ultimo pero no menos importante, me gustaría dar las gracias a Isabel Rio, mi compañera y gran apoyo durante todos estos años. Porque crecer a su lado y aprender de ella ha sido maravilloso, porque jamás me falló y siempre supo entenderme, hasta cuándo ni yo misma lo hacía. Isabel querida, gracias por enseñarme mucho más que ciencia..
(6)
(7) RESUMEN ANTECEDENTES: Una de las consecuencias de los procesos industriales modernos es la liberación al medio ambiente de una gama cada vez más amplia, y a mayores niveles, de nuevas sustancias químicas, la mayor parte de ellas persistentes a lo largo de años. Esto ha despertado una creciente preocupación sobre sus efectos en la salud reproductiva. Las investigaciones se han centrado principalmente en el análisis de los efectos sobre la capacidad reproductiva del adulto y, en menor medida, en los efectos sobre el desarrollo fetal y la salud del recién nacido. Por otro lado la mayor parte de los estudios publicados hacen referencia a exposiciones ocupacionales o desastres naturales pero en España no se ha llevado a cabo ninguna investigación sobre los efectos de la contaminación industrial en la salud reproductiva. OBJETIVOS: Describir la distribución espacial del riesgo de muy prematuro (MPT), prematuro moderado (PTM), muy bajo peso (MBP), bajo peso moderado (BPM) y pequeño para edad gestacional (PEG) para todos los nacimientos ocurridos en España en el periodo 2004-2008. Explorar la posible asociación entre estos resultados reproductivos adversos y la proximidad a industrias contaminantes. METODOLOGIÁ: Estudio ecológico. Se utilizaron modelos jerárquicos bayesianos para calcular la distribución del riesgo de MPT, PTM, MPB, BPM y PEG en todos los municipios españoles, así como para explorar la asociación entre el riesgo de dichos resultados con la proximidad del municipio de residencia de la madre a industrias contaminantes (<3.5km). RESULTADOS: Algunos municipios de las Islas Canarias mostraron alto riesgo para todos los resultados adversos mencionados. El sur de España mostró un mayor riesgo de prematuridad, mientras que para la distribución de bajo peso y pequeño para edad gestacional no observó ningún patrón espacial.. Las asociaciones más fuertes se. encontraron con proximidad a empresas de manejo de residuos (peligrosos, no peligrosos y sobre todo residuos animales) seguidas de empresas de productos farmacéuticos. No se encontró asociación con proximidad a refinerías, industria metalúrgica, producción de explosivos, depuradoras de agua, empresas textiles y astilleros..
(8)
(9) INDEX. CHAPTER 1: INTRODUCCTION. 1. 1.1 Environment and reproductive health. 1. 1.2 Effects of industrial pollution in reproductive health. 3. 1.3 Industrial pollution and reproductive health in Spain. 5. 1.4 Industrial pollution information sources. 6. 1.5 Spatial Epidemiology. 10. 1.6 Objectives. 15. 17. CHAPTER 2: METHODS 2.1 Design. 17. 2.2 Sources of Data. 17. 2.3. Database. Transformation:. From. administrative. data. to. 24. geographical units of analysis 2.4 Descriptive analysis and mapping. 26. 2.5 Sensitivity Analysis: Choosing the distance threshold for near vs.. 29. far analysis 2.6 Assessing the association between proximity to pollutant. 32. industrial facilities and risk of adverse reproductive outcomes. CHAPTER 3: RESULTS. 35. 3.1 Descriptive analysis and mapping. 35. 3.2 Sensitivity Analysis: Choosing the distance threshold for near vs.. 46. far analysis 3.3 Assessing the association between proximity to pollutant. 53. industrial facilities and risk of adverse reproductive outcomes. CHAPTER 4: DISCUSSION. 65. CHAPTER 5: CONCLUSIONS. 79.
(10) BIBLIOGRAPHY. 81. APPENDIX. 87. Appendix I: Official Form For Deliveries And Abortions Registry. 89. Appendix II: Information On Grouping Of Variables.. 93. Appendix III: Other Results. 95. III.1 Disease Mapping. 95. III.2 Municipalities With Highest Risk. 97. III.3 Sensitivity Analysis. 101. III.4 Final Results. 107.
(11) 1. CHAPTER 1: INTRODUCTION. 1.1 Environment and reproductive health. The prenatal period encompasses the most rapid and most important phase of human development. Poor intrauterine growth is an important predictor of survival and morbidity in childhood and can also have a big negative impact in adult health [1-9]. Prenatal development appears to proceed largely under instruction and direction from individuals’ genes. However this does not mean that it is immune to external influences. Indeed, numerous studies have demonstrated a high risk of abnormal fetal development and adverse reproductive outcomes associated with unfavorable socioeconomic conditions, mothers’ life-style and health status. Low socio-economic and educational level [10-13], maternal age [14-17], racial disparities [18-20], bad prenatal care [21, 22], or maternal occupation [23-25] are some examples of socio-demographic factors related to high risk of preterm birth (PTB), low birth weight (LBW) and small for gestational age (SGA). Regarding to mother’s life-style and health status during pregnancy, nutritional factors [26-29], cigarette consumption [30, 31], substance abuse [32-34] or stress [35] are also widely established as risk factors for adverse reproductive outcomes. However, although etiologic research has focused mainly on these proximate risk factors, individual characteristics and behaviors, it seems that individual-level factors have only been able to partially explain poor reproductive.
(12) 2. outcomes in some populations. In the last years, many epidemiologists have pointed out the neglected importance of environment as a major contributor to reproductive risk.. Humans are exposed to environmental pollution at home, in the workplace, or in the community via contaminated soil, air, water or food. Environmental pollutants include organic and inorganic substances that are harmful to human health. Pollutants enter the body in one or more of three ways: inhalation, ingestion, or absorption through the skin and can be stored in the organism for long periods of time.. Every person exposed to pollution does not necessarily experience the same adverse health effects. It is obvious that, in addition to the exposure dose and the type of pollutants, many other factors can affect whether an exposure ultimately results in a harmful health effect [36]. Pregnant women and developing fetus are particularly vulnerable to the adverse impact of environmental aggressions [37-39]. Some recent reviews have revealed the existence of new evidence of the harmful effects that ambient pollution has in reproductive health [36, 40-42]. However large variability across studies in design, methods in exposure assessment and type of pollutant considered, limits the strength of the evidence of adverse affects of ambient air pollution on birth outcomes. One of the main sources of pollution is the industrial activity and nowadays its potential health effects are t of a growing concern in the population..
(13) 3. 1.2 Effects of industrial pollution in reproductive health. One of the consequences of the modern industrial processes is the release to the environment of wider and higher levels of new chemical substances, most of them persistent in the environment through the years. During the last decades, an increased number of studies have been carried out looking for the links between environmental pollution and health.. Some studies have provided evidence that environmental. exposure result in adverse effects on reproduction, suggesting that fetal development is one of the periods of greatest vulnerability to its effect, highlighting the need to prioritize research in this area.. Research studies directly addressing the reproductive toxicity of industrial pollution have been conducted primarily on individuals subjected to occupational exposures [23, 43-47] or exposed to severe industrial accidents [48-50]. Moreover, the industrial pollutants studied are still a minority within the wide range of pollutants dispersed in our environment. In addition, research has focused mainly on the analysis of effects on the reproductive capacity and, to a lesser extent, on effects on fetal development and newborns’ heath.. The evidence about the influence of occupational exposition to. pollutants on the fetal development is not conclusive.. Heavy metals such as mercury, lead or cadmium, solvents such as benzene and toluene and endocrine disrupters that interfere with hormonal activity as dioxins or polychlorinated biphenyls (PCBs) are an example of three toxic categories whose effects on the human reproductive process have been analyzed.. There are also studies identifying residential exposure to industrial pollution as a risk factor for PTB, LBW or birth defects. Associations between risk of LBW or SGA and.
(14) 4. proximity to combustion and thermal [51, 52], coke works or coal combustion [52-54] and hazardous and non hazardous waste [55, 56] plants have been described in the literature. However, its effect on preterm birth is less conclusive. Most studies on industrial pollution do not mention an effect on gestational age and the ones that do usually dismiss the evidence of association [57, 58]. Some other studies have suggested the absence of association between certain types of industrial pollution and adverse reproductive outcomes. [59-62] . Studies addressing the effects of specific contaminants also offer inconclusive results. It has been demonstrated that exposure in uterus to heavy metals like lead or cadmium, or to mercury or arsenic is associated with increased risk for brain damage, neurodevelopmental problems, congenital malformations, miscarriage and LBW [6366]. Air pollutants such as sulfur dioxide, pesticides, polychlorinated biphenyls (PCBs) or DDT are also linked to poor pregnancy outcomes such as abortion, stillbirth, PTB, LBW and miscarriage [45, 67-71]. However, other studies have not confirmed these associations [71-73]. Regarding the exposure to solvents, its negative influence on embryonic human development remains also inconsistent, with some studies reporting increased risk of spontaneous abortion or congenital malformations and others not [7476]. The absence of conclusive evidence can be due, in many cases, to methodological difficulties addressing environmental studies. On the one hand, pollution is often a complex phenomenon frequently involving a multi-pollutant exposure and making it difficult to document scientifically a clear link between a specific toxic agent and a specific health effect. Even beyond, the isolate effect of some pollutants on health could differ from its effects when combined with other pollutants as often in real world. Timing of exposure is also another factor that strongly influences the ultimate.
(15) 5. biological effect of continuous contact with several environmental pollutants. Although exposure to some substances can affect individuals at all stages of life, exposure during critical windows of susceptibility may have more significance. These windows can differ depending on the particular pollutants but probably include periods during gestation, childhood, adolescence, and adulthood. Regarding specifically the embryonic period, an additional challenge to demonstrate a relationship between some industrial pollutants and fetal health is the fact that damage caused by pollutants may be evident months or years after maternal exposure. The picture is further complicated when the aim is to identify the effects of low exposure to industrial pollutants on health. In this scenario, comparison with control subjects is difficult because in general, the entire population is exposed to some level of contamination.. 1.3 Industrial pollution and reproductive health in Spain In Spain, interest on the effect of environmental pollution on health has increased during the last years. However, it has mainly focused on its effects on mortality and cancer [77-79], especially in the case of industrial pollution. Few groups in our country are currently working in projects exploring effects of air pollution in reproductive results and none of them focus their attention on industrial pollution. As far as we know they are all part of the INMA (INfancia y Medio Ambiente [Spanish for Environment and Childhood]) project, that is a cooperative research network that aims to explore the effects of environment and diet on fetal and early childhood development [80, 81]. Some important results about exposure to certain pollutants and its effects on length of gestation and birth size had already been published as a result of this research [82-84]..
(16) 6. However, the number of pollutants measured and the number of areas participating in the study is still limited leaving many potential harmful exposures and high risk areas unexplored.. 1.4 Industrial pollution information sources. One of the major limitations when exploring the relationship between pollution and health has been the lack of reliable and public information about the emission levels and class of industrial pollutants released to the environment. The situation has begun to change since the establishment of specific legislations and more rigorous controls about the amount of pollutants released to the environment. In this context emerged in Spain in 2001 the Integrated pollution prevention and control (IPPC) directive [85], whose objective was “to avoid, and whenever not possible, to reduce and control the pollution by means of prevention and control”. From 2007 all facilities developing some of the industrial activities described in Annex 1 of the IPPC legislation are obliged to hold an environmental authorization to start their activity; the existing had to obtain the permit before October 2007. Therefore, all industries operating legally in Spain should be registered in IPPC databases. In line with this legislation the European Pollution Emission Register (EPER), adopted by the European Union in 2001 was implemented in Spain in 2007 as part of the IPPC register. The Pollutant Release and Transfer Registry (PRTR) came up as a modified version of EPER (2001), including more substances, pollutant releases to soil and information on accidental emissions, diffuse sources and off-site transfers. The new protocol’s objective was to encourage pollution reduction as well as to enhance public.
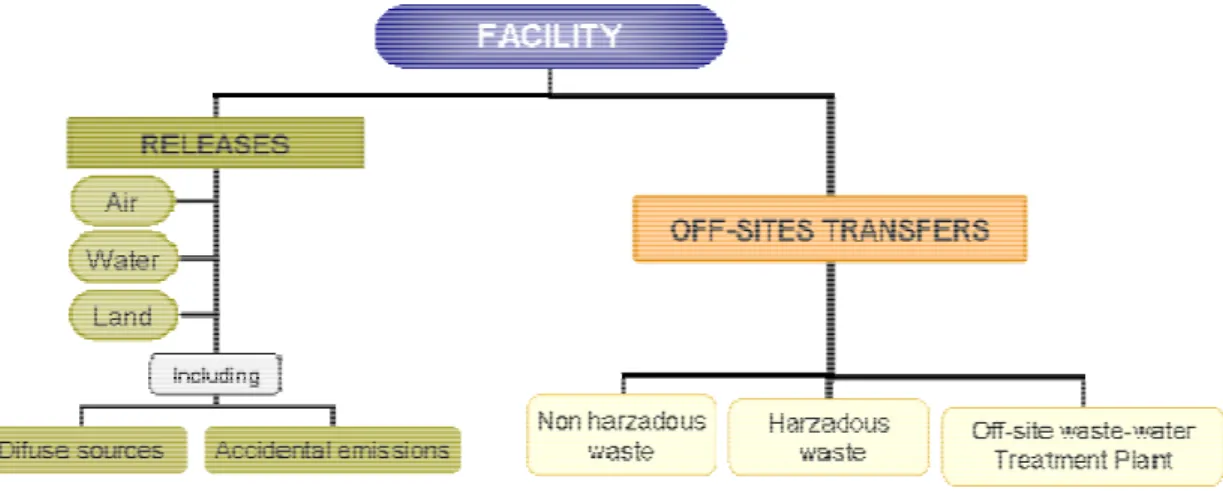
(17) 7. access to information and to facilitate public participation. Indeed, it gives a great a source of information for environmental studies on effects of pollution in health.. PRTR-Spain is the Spanish register of emission and pollutant sources that provides information on the pollutant releases from the industrial facilities under the specific legislation [86].. The operator of each of the facilities undertaking one or more of the 65 different activities registered in legislation with certain measures above the established thresholds, reports yearly the annual amounts to the competent authority of the following: • Releases to air, water and soil of 91 pollutants for which the release threshold is exceeded; • Off-site transfers of pollutants in waste water, for which the emission threshold is exceeded; and • Off-site transfers of hazardous waste exceeding 2 tons per year or of non-hazardous waste exceeding 2000 tons per year. The report indicates whether the waste is destined for recovery (R) or disposal (D) and, for trans-boundary movements of hazardous waste, the name and address of the recoverer or the disposer of the waste and the actual recovery or disposal site..
(18) 8. Figure 1.4.1 Information available in PRTR-Spain. Figure 1.4.2 draws the structure of the flux of information used in PRRT-Spain to collect the information on pollutant releases. Facilities specified must provide with information about all its emissions at least once per year to the Competent Authorities in each of the autonomous communities. They can have their own reporting system or use the directly national tool of PRTR as shown in figure 1.3.3. This information is forwarded to the ministry of environment that incorporates this data to its IPPC register and sends PRTR the required information for the pertinent industries. PRTRSpain gives to the public all the information following the criteria of the European Regulation 166/2006 (E-PRTR) [86].. Figure 1.4.2 Collection of information.
(19) 9. Figure 1.4.3 Reporting System. To ensure the quality of the data on emissions provided, facilities should report, besides the emission data, in kg/year, also the method and, when appropriate, the standards used to determine the measurements. Environmental authorization usually includes, not only the requirement on monitoring but also on how to determine emission data. The specification of estimation method as well as the actual measurement encourages consistency of reporting methodologies by facilities and therefore consistency of the data. In addition, the European PRTR requires operators to ensure the quality of the information that they report, which is afterwards assessed by the competent authorities to check the completeness, consistency, and credibility of the data. The Member States of the European Union should undertake inspections of facilities to check whether data are being reported accurately. They should also lay down the rules on penalties applicable to infringements of the provisions of the European PRTR Regulation and take all measures necessary to ensure that they are implemented [87]. Therefore IPPC register counts on information of all industrial facilities legally operating in our country with information on the amount of releases to air, water or.
(20) 10. soil. This register allows identifying industries with emissions over certain thresholds that should be reported to PRTR. This database represents a reliable and pretty detailed source of information on industrial pollution that combined with birth data in an ecological study could answer some questions about the relationship between industrial pollution and adverse reproductive outcomes. Ecological research is experiencing an important enhancement with the advances in the field of spatial epidemiology. At the same time, advances in spatial epidemiology are due to new developments in geographic information systems and computer technology as well as to awareness about the importance of the relationship between environment and health and the availability of address-level health data.. 1.5 Spatial Epidemiology Spatial data in epidemiology. Back in 1854 we found the first and most famous case of spatial epidemiology: John Snow’s study of cholera outbreak in Soho neighborhood of London in 1854. By talking to local residents he identified the source of the outbreak as the public water pump on Broad Street. In order to demonstrate this theory Snow represented all cholera cases and pumps in the Soho area and found cluster of disease around this pump [88] ..
(21) 11. Figure 1.2.1 John Snow Map of cases of cholera location for the cholera outbreak of London in 1854. Applying statistical methods in spatial setting raises several challenges. Geographer and statistician Waldo Tobler summarized a key component affecting any analysis of spatially referenced data through his widely quoted and paraphrased firs law of geography: “Everything is related to everything else but near things are more related than far things”. The increasing interest in environmental studies to determine the effects of pollution in health has awaken an especial interest in spatial methods of analysis and many advances in computing, statistical methodology and geographical information system have been developed. This together with the availability of geographical indexed health and population data have enabled the realistic investigation of spatial variation of disease risk and exposure and how they relate..
(22) 12. Disease mapping Disparities in health outcomes across communities are a central concern in public health and epidemiology. Methods of exploratory data analysis and geo-visualization are commonly used to provide insight into the patterns of the health outcomes. Disease mapping allows the estimation and presentation of areal summary measures of health outcomes to describe the spatial pattern of disease of a certain disease [89]. Choropleth maps of health outcome’s counts or rates, calculated for administrative units and drawn at a variety of scales, have long been used in public health and epidemiology, and their preparation is now supported by geographic information systems [90]. However mapping counts is not the best tool for inference about disease risk, since areas with larger population are expected to have larger disease counts. Rates account for population differences, but a map of rates might still obscure the spatial pattern in disease risk, particularly if the rates are based on populations of very different sizes. Since variability in the estimated local rate depends on population size, some rates might be better estimated than others. Rates based on small populations or small numbers of disease cases are likely to be elevated artificially, reflecting a lack of data rather than true elevated risk [91]. This problem is especially latent when doing estimations in small areas, since counts of population and disease tend to be also small. Standardizing rates to make them comparable is another approach commonly used, however it can also mask important differences in the distribution of the numerator and the denominator. Standardization presents the risk of an outcome but obscures the absolute number of outcomes present. There are several solutions to avoid the problem and most of them use information from neighbours to smooth the risk of adverse results by taking into account the adjacent areas’ risk, generally using hierarchical.
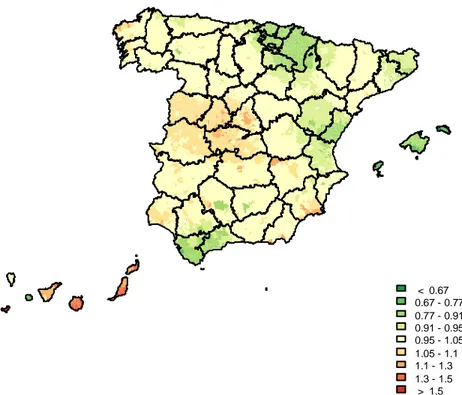
(23) 13. regression models with spatial random effects. Smoothing models used for this study are explained in more detail in the methods section. As an example we show figures 1.3.2 and 1.3.3 were the difference between a map of a comparative indicator figure and a map of smoothed relative risk (RR) can be observed. The comparative figure was calculated from dividing the standardized rate by the population rate and the smoothed relative risk was calculated using Bayesian hierarchical models. Both high and low raw relative risks are smoothed approaching the picture to a more realistic result where risks are not so extreme and close areas are more related than far areas. Figure 1.3.2 Map of municipal Preterm Birth comparative figure. < 0.67 0.67 - 0.77 0.77 - 0.91 0.91 - 0.95 0.95 - 1.05 1.05 - 1.1 1.1 - 1.3 1.3 - 1.5 > 1.5.
(24) 14. Figure 1.3.2 Map of municipal Preterm Birth smoothed relative risk. < 0.67 0.67 - 0.77 0.77 - 0.91 0.91 - 0.95 0.95 - 1.05 1.05 - 1.1 1.1 - 1.3 1.3 - 1.5 > 1.5. On the other hand, maps display the spatial properties of a data distribution. (outcomes and covariates) but do not directly present the associated statistical distribution of the data. There is, however, an alternative approach based on the use of spatial regression models that allow to link health and exposure data to analyze associations between exposures and adverse health events. It also allows to adjust analyses and maps for important covariate information and to more explicitly use spatial exposure measurement to help describe the spatial distribution of health events..
(25) 15. Ecological Inference Ecological studies allow exploring associations using information on disease and exposure factors at an aggregated scale but have the disadvantage that results might lead to conclusions different from those based on individual data. However, when previous studies in a new scenario are scarce (or inexistent) an ecological study represents the best options to set out the bases for future studies.. 1.6 Objectives General objective:. Our main aim was to explore the association between pregnant women’s residential proximity to polluting industrial facilities in Spain and the risk of adverse reproductive outcomes during the period 2004-2008.. Specific Objectives:. 1. To describe the spatial pattern of very and moderate preterm births, very and moderate low weight at birth and small for gestational age among all births registered in Spain between 2004 and 2008. 2. To analyze the association between the women’s residential proximity to industrial facilities during gestational period and the risk of having a very or moderate preterm delivery, a newborn with very or moderate low weight or small for its gestational age..
(26) 16.
(27) 17. CHAPTER 2: METHODS. 2.1 Design Ecological study using municipalities as the units for analysis.. 2.2 Sources of Data Data from births was collected from the vital statistics registry of the Spanish National Statistics Institute (INE). In order to preserve the anonymity of registers, individual information on municipality of residence and mother address is not published in vital statistics webpage. Therefore, this data was formally requested and, after the formalization of a confidentiality agreement between the research group members and the registry, data was provided. The Environment Ministry facilitated to the group of Environmental and Cancer area of National Center of Epidemiology form Carlos III Health Institute a database on industrial facilities releasing pollutants to air. The group gave us the database together with the shape files of Spanish provinces and municipalities, the municipal coordinates of the administrative centroids (town centre) and the adjacency matrix defining the neighbours of each of the Spanish municipalities..
(28) 18. Municipal level covariates information was downloaded from the Population and Housing Section of the National Statistics Institute.. Birth data: Spanish vital statistics collects annual information from civil registries on all births, death or alive, occurred in the country and individual information about some characteristics of mothers and newborns (Appendix I). Registration is compulsory for all births occurring in the Spanish territory. The Spanish National Statistics Institute provided us with a database of all singleton live births registered in the country between 2004 and 2008. Individual sociodemographic and sanitary information included in this database were: municipality of residence, age, country of origin, educational level and profession of the mother and gestational age (weeks) and birth weight (grams) of the newborns. -. Municipality of residence of the mother includes name of municipality and an INE code that allows to identifying each municipality uniquely.. -. Mother age was classified according to the very established categorization used in reproductive health studies: adolescent mothers (<20 years old), normal age mothers (20-34) and mature mothers (≥35).. -. Country of origin was classified into two big groups attending to economical situation of the country: •. Non-economic Immigrants: Immigrant mothers coming from countries with similar or better economical condition than Spain, including Central and North-West Europe, North America and Oceania countries..
(29) 19. •. Economic Immigrants: Immigrant mothers coming from countries with unfavorable economical conditions, including Latin-America, NorthEast Europe, Northern-Africa and Sub-Sahara countries.. -. Educational level of the mother was classified into two big groups: Primary school or higher education finished and illiterate or without primary school finished.. -. Profession of the mother was classified into four big groups: Non Manual work, manual work, no work and not classified.. More detailed information on categorization of variables is available in appendix II. Using data on gestational age and birth weight, the adverse reproductive outcomes of interest were defined as: -. Very preterm birth (VPTB): Born before 33 weeks of gestation.. -. Preterm Birth (PTB): Born between 33-36 weeks of gestation.. -. Very low birth weight (VLBW): Weight at birth less than 1500 grams.. -. Low Birth Weight (LBW): Birth weight between 1500 and 2500 grams.. -. Small for gestational age (SGA): Gender-specific birth weight below the 10th percentile for local babies of the same gender and gestational age.. Pollution Data: Databases on Spanish industrial facilities and their releases to air are available for 2007, 2008 and 2009. They collect information about name, address, coordinates of location and type of activity. In addition, 91 different types of specific pollutant releases from all industries whose emissions to air, water and land are over the established thresholds are registered..
(30) 20. All regulations about the quality of the data collected in the European PRTR registries refer to the quality of the reported emissions but do not pay much attention to the accuracy of the reported geographic position of EPER industries. A recent validation study of the geographic position of EPER-Spain (the antecedent of PRTR-Spain in force until 2007) industries revealed that for 2001 database of EPER registry, only 7% of industries where accurately positioned (less than 500 meters from the registered coordinates). Updates of these coordinates carried out in 2006 aroused this percentage to 34%, which still leaves a huge amount of industries wrongly positioned [92]. The group of Environmental and Cancer area of The National Center of Epidemiology in Carlos III Health Institute and specifically Javier Garcia Perez, Pablo Fernandez , Rebeca Ramis and Elena Boldo under the direction of Gonzalo Lopez-Abente, have been working in the meticulous revision of each of the industries included in IPPC database for 2007, first year of obligatory reporting. As a result they count with a dataset containing all geo-coded addresses on all industries releasing pollutants to air, checked and corrected. Description on this database has already been published [93]. For this ecological study we used the information on 2458 facilities, representing all industrial facilities registered in IPPC releasing pollutants to air (whether or not they exceed the established thresholds). Despite the fact that births database collects information on all births registered from 2004-2008, we only used 2007 data since we considered that it was the only set with accurate and reliable geographic information and there will be slight, if any, changes along 2008 and 2009..
(31) 21. The industrial facilities were classified into 24 groups of activity summarized and described in table 2.2.1. From the original dataset, facilities developing activities with scarce industrial presence (less than 2 plants in the whole Spanish territory) and facilities not releasing pollutants to the atmosphere were excluded. Table 2.2.1: Description of activity groups. Activity Groups Combustion Refineries and coke ovens Metallurgical Galvanization Surface treatment of metals and plastic Mineral industry Cement and Lime. Description Thermal power stations and other combustion installations with a power superior of 50MW Mineral Refineries and coke ovens Production and transformation of metals Plants for galvanization of metals Surface treatment of metals and plastic materials using an electrolytic or chemical process Underground Mineral industry and related operations Installations for the production of: Cement clinker in rotary kilns, Lime in rotary kilns, Cement clinker or lime in other furnaces. Glass and mineral fibers. Installations for the manufacture of glass, including glass fibers and installations for melting mineral substances, including the production of mineral fibers. Ceramic. Installations for the manufacture of ceramic products by firing, in particular roofing tiles, bricks, refractory bricks, tiles, stoneware or porcelain Chemical installations for the production on an industrial scale of basic Organic chemical industry Chemical installations for the production on an industrial scale of basic Inorganic chemical industry Chemical installations for the production on an industrial scale of phosphorous-, nitrogen- or potassium-based fertilizers (simple or compound fertilizers) Chemical installations for the production on an industrial scale of basic plant health products and of biocides Installations using a chemical or biological process for the production on an industrial scale of basic pharmaceutical products Installations for the production on an industrial scale of explosives and pyrotechnic products Installations for the recovery or disposal of hazardous waste Installations for the incineration of non-hazardous waste in the scope of Directive 2000/76/EC of the European Parliament and of the Council of 4 December 2000 on the incineration of waste and Landfills.. Organic chemical industry Inorganic chemical industry Fertilizers. Biocides Pharmaceutical products. Production of explosives Hazardous waste. Non-hazardous waste.
(32) 22. Table 2.2.1(cont): Description of activity groups. Activity Groups Disposal or recycling of animal waste. Urban waste-water treatment plants Paper and board Pre-treatment or dyeing of textiles Food and beverages sector Organic Solvents Use. Shipyards. Description Installations for the disposal or recycling of animal carcasses and animal waste and independently operated industrial waste-water treatment plants which serve one or more activities of this annex. Urban waste-water treatment plants Industrial plants for the production of paper and board and other primary wood products Plants for the pre-treatment (operations such as washing, bleaching, mercerization) or dyeing of fibers or textiles Food and beverages sector Installations for the surface treatment of substances, objects or products using organic solvents, in particular for dressing, printing, coating, degreasing, waterproofing, sizing, painting, cleaning or impregnating Installations for the building of, and painting or removal of paint from ships. Census data: The Spanish National Statistics Institute publishes yearly information about population size for all Spanish municipalities. This data was used to calculate a unique population size for each municipality as an average of the population size between 2003-2008. This variable was afterwards categorized in three levels: less than 2000 inhabitants, 2000-10000 inhabitants, more than 10000 inhabitants. Population and Housing census are published every 10 years by the National Statistics Institute and collects very important socio-demographic information at a census section level. Last census data was published in 2001. For this study we used information on: -. Habitability index (0-100): Starting at 100 and losing scores for noise, pollution and bad smells, dirty streets, bad communications, scarce green areas, delinquency and vandalism, absence of bathroom inside the house, dilapidated building, absence of running water or sewage water evacuation system, no gas.
(33) 23. pipe, non accessible with a wheel chair, no elevator for houses over 3rd floor, absence of heating devices, overcrowding, very old building or unfavorable type of accommodation (Mobile, semi permanent or improvised). -. Unemployment rate: Calculated as a rate between unemployed population 16 years old or over and active population 16 years old or over.. -. Socioeconomic level: Calculated as a combination of occupation, activity and professional situation.. -. Percentage of mono-parental families: Percentage of families composed by an only parent without a partner and one or more children.. -. Number of vehicles per household: Number of vehicles divided by number of households in each municipality.. The National Statistics Institute provides more detailed information on the definition of these variables [94] .. Municipal coordinates and maps: The already mentioned group of Environmental and Cancer area of National Center of Epidemiology form Carlos III Health Institute, with a long experience in industrial pollution and cancer research also provided us with the shape files of municipalities and provinces of Spain to map the distribution of our events. They also facilitated the coordinate’s information of municipality administrative centroids defined as the town administrative center, necessary for the analysis of effects of residential proximity to industrial facilities in reproductive outcomes. The adjacency matrix defining the neighbors for each of the Spanish municipalities used in models to smooth rates was also provided by this group..
(34) 24. 2.3 Database Transformation: From administrative data to geographical units of analysis To explore the association between industrial pollution and birth outcomes, the information contained in both databases needed to be linked by identifying proximity of mother’s residence to each type of industry. Since it was not possible to have access to the coordinates of exact location of mothers address it was necessary to decide which geographical unit will be used for the mapping of the outcomes and posterior analyses. Thus, births database contains information about municipality of the mother, population size information is given at a municipal level, population and housing census database contains information on municipality to which each of the census section belongs and information on coordinates of municipal centroid was available. Given that the smaller geographical unit common to all databases for which we have geographical information was municipality, we worked at a municipal geographical level. Population size database was already built at a municipal level but births database had individual information on each birth and population and housing census summarized information for census sections (smaller than municipalities). Therefore, to combine all three databases it was necessary to aggregate data of birth and population and housing census to a municipal level.. Birth data: Individual data on singleton births was aggregated to a municipal level by counting: Number of live births; number of cases of very preterm birth, moderate preterm birth, very low birth weight, moderate low birth weight and small for.
(35) 25. gestational age. It was also calculated for each of the municipalities: proportion of adolescent mothers (<20 years old), proportion of mature mothers (≥35 years old), proportion of immigrant mothers coming from countries with economical difficulties, proportion of illiterate mothers or without primary school education completed, proportion of mothers with manual work. The number of municipalities was smaller in the births database than in coordinates, population and census databases because only 7221 of the 8098 municipalities had at least one birth registered for the period 2004-2008. In order to check that none of these municipalities were missing in births database for administrative errors we checked the population size of all of them. All 877 municipalities were relatively small (7 to 895 inhabitants) and therefore number of births for these municipalities were assumed to be 0.. Census data: Data on population and housing was provided at a census section level and was also aggregated by calculating the municipal average weighted by size of the census section for: habitability index, unemployment rate, socioeconomic level, percentage of mono-parental families and number of vehicles per home. All three sets of births, population size and population and housing census data, were combined into one database with information for the 8098 Spanish municipalities on: number of live births, number of VPTB, MPTB, VLBW, MLBW and SGA births, proportion of adolescent mothers (<20), proportion of mature mothers (≥35 years old), proportion of immigrant mothers coming from countries with economical difficulties, proportion of illiterate mothers or without primary school education completed, proportion of mothers with manual work, population size in 3 categories (<2000, 2000-.
(36) 26. 10000, ≥1000), habitability index, unemployment rate, socioeconomic index, proportion of mono-parental families and mean number of vehicles per household.. 2.4 Descriptive analysis and mapping Outcomes of interest and other variables included in the study were described by means of basic descriptive statistics. As stated in the introduction describing municipal distribution of risk is not that straightforward, using municipal counts or rates (number of cases/number of live births) is not the best option to draw general conclusions, especially when estimations are based on populations of very different size as is the case. Areas with low population have a small denominator and therefore rates with large variability and extreme values may appear misleading the interpretation of the map. The most widely used strategy to approach this problem is to estimate the spatial distribution of risk by means of Bayesian hierarchical models [95] and specifically using Besag, York and Mollié model (BYM). This model was introduced by Clayton and Kaldor [96], developed by Besag, York and Mollié [97] and subsequently applied in the field of ecological studies [98]. Traditionally these types of models have been adjusted using Markov chain Montecarlo (MCMC) sampling techniques that require a huge amount of resources in terms of computation capacity and time. Recently Harvard Rue and Sara Martino have published a new technique to approximate Bayesian inference for latent Gaussian models by using integrated nested Laplace approximation [99]. The group developed the package INLA that allows the user to implement such models using R software to obtain results in a few minutes reducing dramatically the time of computation and the amount of resources used..
(37) 27. The class of “disease mapping” models is often latent [97, 100, 101] and therefore the INLA approach is fully applicable and give practically identical results to MCMC sampling methods when adjusting BYM models [99, 102]. Adjustment of such models requires the calculation of the number of expected cases in each municipality that in this case was calculated using national rates as the reference value:. Expectedi = National Raw Rate of outcome ×. population size. i = 1...8098. of municipality i. Where the national raw rate for each of the outcomes was calculated as follows:. Very Preterm Rate (VPTBR) =. Number of VPTB Number of live births *. Moderate Preterm Rate (MPTBR) =. × 1000. Number of MPTB Number of live births *. Very Low Birth Weight Rate (VLBWR)=. Number of VLBW Number of live births**. ModerateLow Birth Weight Rate (VLBWR)=. Smallfor Gestational Age Rate (SGAR)=. × 1000. × 1000. Number of MLBW Number of live births** Number of SGA. Number of live births***. × 1000. × 1000. * All live births with complete information on gestational age ** All live births with complete information on birth weight *** All live births with complete information on gestational age and birth weight.
(38) 28. The Besag, York and Mollié model for a given outcome was therefore formulated as follows:. Oi ~ Po(E i λ i ). i = 1 ... 8098. log( λ i ) = α + hi + bi hi ~ Normal( µ ,τ h ) bi ~ Car.Normal (η i ,τ b ). τ h ~ Gamma( α , ϕ ) τ h ~ Gamma( γ , δ ) Where: λi is the relative risk in municipality i Oi is the number of observed cases of the outcome in area i. Ei is the expected number of cases of the outcome in area i. hi is the municipal heterogeneity term form a Normal distribution. bi is the spatial term from a Car.Normal distribution τh is the hyperparameter of the normal distribution τb is the hyperparameter of the Car.Normal distribution. BYM model includes two random effects: hi that is independent for each area and represents the heterogeneity among municipalities and bi that allows each area to borrow information from neighbors so that the expected value of the spatial random effect for municipality i conditioned to the rest of the areas is an average of such effect in the contiguous municipalities. The criterion of contiguity used was adjacency of municipal boundaries as shown in figure 2.4.1..
(39) 29. Figure 2.4.1 Random Effects. h. b. Smoothed municipal relative risk and posterior probabilities were calculated for each of the outcomes and municipalities by fitting BYM models using the integrated nested Laplace approximation. Smoothed relative risk and posterior probabilities (PP) of relative risks being greater than one were drawn in a Spanish map of municipalities for each of the reproductive outcomes. The smoothed RRs maps enable homogeneous areas to be delimited and PP maps allows determining which of the areas have a significant higher risk. Posterior probabilities over 0.8 identify regions with higher risk [103].. 2.5 Sensitivity Analysis: Choosing the distance threshold for near vs. far analysis. After describing the spatial distribution of relative risk of very and moderate preterm, very and moderate low birth weight and small for gestational age, linking birth with industrial pollution data was needed to measure the effect that proximity of mother’s residence to industrial pollutant facilities has in reproductive outcomes. For that.
(40) 30. purpose a near vs. far analysis was proposed. This sort of analysis measure the increase in risk due to proximity of residence to a pollutant point by identifying which municipalities (and its births) have “near” at least one facility developing each type of industrial activity. When individual geo-coded information is available proximity analysis is less problematic since it is sensible to think that, for significant associations, risks will be higher as we get closer to the pollutant point. In those cases small distances are selected as a threshold to define near vs. far. As has already been mentioned, the geographical unit for this ecological study was defined as the municipality of inscription of birth, assumed to be the residence of the mother during pregnancy. Distance from the industrial facility to mother’s residence was calculated as the distance from the facility to the administrative centroid of the municipality of residence of the mother. Therefore, choosing a small distance to define the threshold would exclude a considerable amount of cases from the analyses, especially in big municipalities where industries are localized in the surroundings. That would reduce the number of observations, increasing the variability with the consequence of more imprecise estimations. On the other hand choosing long distances would mix exposed with non-exposed (or less exposed mothers) diluting the real effect that residing close to a pollutant resource can have in reproductive results. In order to choose the most convenient distance to fix the threshold to classify municipalities into near and far from each type of industrial facility, a sensitivity analysis was carried out. A variety of threshold distances lying within the most commonly used in environmental studies at a Spanish municipality level [79, 104-106].
(41) 31. or birth outcomes and pollution studies in other countries [51, 58, 107] were considered: 2km, 3km , 4km and 5km. Euclidean distance between each 8098 of the municipality centroids (xi, yi) and each of the 2458 industrial facilities coordinates (xj, yj) was calculated as follows:. d ij =. ( xi − x j ) 2 + ( yi − y j ) 2. i = 1 ... 8098 j = 1 ... 2458. For each of the 4 threshold distances considered 24 new categorical variables were calculated, one for each of the industrial activities explored. For each distance threshold d and industrial facility type k, the new variable would have the following three possible categories for municipality i: No industrial pollutant facilities within a radius of d km form municipality’s i centroid; One or more industrial pollutant facilities within a radius of d km form municipality’s i centroid but not of type k; One or more industrial pollutant facilities, at least one of type k, within a radius of d km form municipality’s i centroid [106]. To obtain the crude smoothed relative risk of very and moderate preterm, very and moderate low birth weight and small for gestational age associated to each of the industrial activities, a BYM model was adjusted for each combination of the 5 outcomes, 24 activity groups and 4 threshold distances (480 models in total). The Besag, York and Mollié models were built by adding the new variable with information about proximity to pollutant resources to the formulation:.
(42) 32. Oi ~ Po(E i λ i ). i = 1 ... 8098. log( λ i ) = log[ E i ] + ∑ ( β j x i ) +hi + bi. j = 1, 2. i. hi ~ Normal( µ ,τ h ) bi ~ Car.Normal (η i ,τ b ). τ h ~ Gamma( α , ϕ ) τ h ~ Gamma( γ , δ ) Relative risks (RR) and 95% credible intervals (CrI) resulting from models where summarized by means of forest plots.. 2.6 Assessing the association between proximity to pollutant industrial facilities and risk of adverse reproductive outcomes. After choosing the most adequate threshold distance d to classify municipalities into near and far from each type of industrial facility considered in the study, raw and adjusted BYM models were fitted using nested Laplace approximation. Defining near as those municipalities within a radius of d km, a raw model for each combination of the 5 outcomes and 24 industrial activity groups was fitted. Relative risks and 95% credible intervals resulting from models where summarized by means of forest plots. Considering the same distance threshold, an adjusted model for each combination of the 5 outcomes and 24 industrial activity groups was fitted. Variables included in the model as potential confounders were: proportion of adolescent mothers (<20 years old), proportion of mature mothers (≥35 years old), proportion of immigrant mothers.
(43) 33. coming from countries with economical difficulties, proportion of illiterate mothers or without primary school education completed, population size (<2000 inhabitants, 200010000 inhabitants and ≥10000 inhabitants), habitability index, unemployment rate, socioeconomic level, percentage of mono-parental families and number of vehicles per household.. Relative risks and credible intervals resulting from models where. summarized by means of forest plots..
(44) 34.
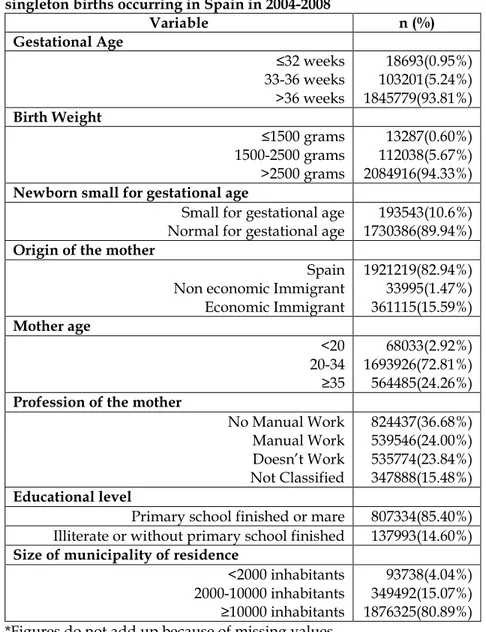
(45) 35. CHAPTER 3: RESULTS. 3.1 Descriptive analysis and mapping During the period 2004-2008, 2326444 single births were registered in the 8098 municipalities of the Spanish territory, of whom 2319555 (99.65%) were live births. Data on gestational age and birth weight was missing for 15.17% and 4.71% of live births respectively and data on small for gestational age was missing for 17.06% of live births. Table 3.1.1 summarizes the distribution of the characteristics of newborn and the mother. Prevalence of very and moderate preterm birth was 0.95% and 5.24% respectively, while 0.60% and 5.67% of newborns had very and moderate low birth weight and 10.6% babies were classified as small for gestational age. The proportion of women coming from countries with unfavourable economical conditions was 15.60%, 2.92% and 24.26% of deliveries were from adolescent and mature mothers respectively, 24.00% of the women developed a manual work and 14.60% were illiterate or did not finish primary school. Regarding the distribution of births by population size of municipalities, 93738(4.04%) births were inscribed in small municipalities with <2000 inhabitants, 349492(15.07%) in municipalities between 2000 and 10000 inhabitants and 1876325 (80.90%) in municipalities with more than 10000 inhabitants..
(46) 36. Table 3.1.1 Main characteristics of newborns and mothers or all singleton births occurring in Spain in 2004-2008 Variable n (%) Gestational Age ≤32 weeks 18693(0.95%) 33-36 weeks 103201(5.24%) >36 weeks 1845779(93.81%) Birth Weight ≤1500 grams 13287(0.60%) 1500-2500 grams 112038(5.67%) >2500 grams 2084916(94.33%) Newborn small for gestational age Small for gestational age 193543(10.6%) Normal for gestational age 1730386(89.94%) Origin of the mother Spain 1921219(82.94%) Non economic Immigrant 33995(1.47%) Economic Immigrant 361115(15.59%) Mother age <20 68033(2.92%) 20-34 1693926(72.81%) ≥35 564485(24.26%) Profession of the mother No Manual Work 824437(36.68%) Manual Work 539546(24.00%) Doesn’t Work 535774(23.84%) Not Classified 347888(15.48%) Educational level Primary school finished or mare 807334(85.40%) Illiterate or without primary school finished 137993(14.60%) Size of municipality of residence <2000 inhabitants 93738(4.04%) 2000-10000 inhabitants 349492(15.07%) ≥10000 inhabitants 1876325(80.89%) *Figures do not add up because of missing values. Table 3.1.2 summarizes the main characteristics of Spanish municipalities according to the last census, elaborated in 2001. Despite the fact most births occur in municipalities with more than 10000 inhabitants, they represent only the 8.64% of the municipalities, followed by a 19.25% of municipalities with a population size between 2000 and 10000, being the majority (72.10%) of them municipalities with less than 2000 inhabitants. The mean (sd) habitability index was 57.53 (sd=11.25) over a maximum score of 100 and socioeconomic level mean score was 0.93. The median unemployment rate was.
(47) 37. 9.30% of active population, 15% of the families have a mono-parental family nucleus and the mean number of vehicles per household was 0.95. Table 3.1.2 Main characteristics of Spanish municipalities (census 2001) Variable Descriptive Size of municipality of inscription n (%) <2000 inhabitants 5839(72.10%) 2000-10000 inhabitants 1559(19.25%) ≥10000 inhabitants 700(8.64%) Habitability Index mean(sd) 57.53(11.25) Socioeconomic Level mean(sd) 0.93(0.20) Unemployment Rate median(IQ) 9.30(5.79-14.18) Proportion of mono-parental families mean(sd) 0.15(0.07) Number of vehicles per household mean(sd) 0.95(0.30). Figure 3.1.1 summarizes the spatial distribution of the total number of live births. There is a great concentration of births in municipalities from Andalusia, Murcia, Madrid and most of Castilla la Mancha as well as Alicante, Asturias, Badajoz some areas of Zaragoza and all seaside municipalities (including the islands). On the other hand a very low number of births in most of the areas of Castilla León and Aragón is expected. Maps for outcomes are very similar since bigger absolute numbers are expected where higher number of births happens..
(48) 38. Figure 3.1.1 Distribution of total number of births. < 2 2-4 4-7 7 - 13 13 - 43 43 - 86 86 - 186 186 - 516 > 516. The following maps draw the spatial distribution of the smoothed relative risk and posterior probability of very and moderate preterm birth, very and moderate low birth weight and small for gestational age. Distribution. of. relative. risk. and. posterior. probability. for. preterm. birth. (PTB=VPTB+MPTB) and low birth weight (LBW=VLBW+MLBW) is available in appendix III. Figures 3.1.2 and 3.1.3 depict the smoothed RRs and spatial distribution of posterior probabilities being greater than 1 for very preterm birth. There is a big area of RRs between 1.05-1.10 that covers municipalities in middle Spain in provinces of Avila, Salamanca North Caceres and Toledo, however only the subareas with RRs bigger than 1.1 were significant. As posterior probabilities map shows, some municipalities of Canary Islands, Ceuta and Melilla, Almeria, Murcia, Madrid and Toledo have a significant higher risk of VPTB. However no spatial pattern was observed..
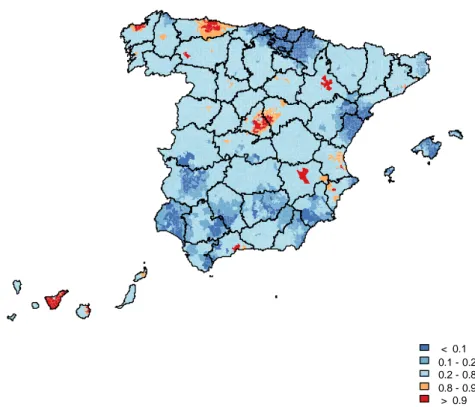
(49) 39. Figure 3.1.2 Municipal distribution of smoothed relative risk of VPTB. < 0.67 0.67 - 0.77 0.77 - 0.91 0.91 - 0.95 0.95 - 1.05 1.05 - 1.1 1.1 - 1.3 1.3 - 1.5 > 1.5. Figure 3.1.3 Municipal distribution of posterior probability of VPTB. < 0.1 0.1 - 0.2 0.2 - 0.8 0.8 - 0.9 > 0.9.
(50) 40. Municipal distribution of smoothed relative risk and posterior probability of MPTB are summarized in figures 3.1.4 and 3.1.5. Some significantly high (PP>0.8) and very high (PP> 0.9) risk areas of MPTB where found in many of the Andalusian municipalities except for those from Jaen. There are also some significant spots in Tenerife, Ciudad Real, Badajoz, Madrid and Zaragoza and Huesca and catches especial attention the case of Murcia, with most of its municipalities showing significant risks over 1.3. The Andalusia and Murcia focuses of high risk might be indicating a pattern north-south with increased risk in the south of Spain. Figure 3.1.4 Municipal distribution of smoothed relative risk of MPTB. < 0.67 0.67 - 0.77 0.77 - 0.91 0.91 - 0.95 0.95 - 1.05 1.05 - 1.1 1.1 - 1.3 1.3 - 1.5 > 1.5.
(51) 41. Figure 3.1.5 Municipal distribution of posterior probability of MPTB. < 0.1 0.1 - 0.2 0.2 - 0.8 0.8 - 0.9 > 0.9. From relative risks and posterior probabilities municipal distribution described in figures 3.1.6 and 3.1.7 only a significant higher but weak risk of VLBW in Madrid Capital, and a bit stronger significant RR in the islands of El Hierro, Tenerife, Gran Canarias and Lanzarote was found..
(52) 42. Figure 3.1.6 Municipal distribution of smoothed relative risk of VLBW. < 0.67 0.67 - 0.77 0.77 - 0.91 0.91 - 0.95 0.95 - 1.05 1.05 - 1.1 1.1 - 1.3 1.3 - 1.5 > 1.5. Figure 3.1.7 Municipal distribution of posterior probability of VLBW. < 0.1 0.1 - 0.2 0.2 - 0.8 0.8 - 0.9 > 0.9.
(53) 43. As shown in Figures 3.1.8 and 3.1.9 relative risk of moderate low birth weight was especially high in medium size clusters of municipalities belonging to Asturias and Madrid some of them extending to Guadalajara, an area in Lugo, a few of municipalities in Tenerife and Albacete and Zaragoza capital. Again, no pattern was observed.. Figure 3.1.8 Municipal distribution of smoothed relative risk of MLBW. < 0.67 0.67 - 0.77 0.77 - 0.91 0.91 - 0.95 0.95 - 1.05 1.05 - 1.1 1.1 - 1.3 1.3 - 1.5 > 1.5.
(54) 44. Figure 3.1.9 Municipal distribution of posterior probability of MLBW. < 0.1 0.1 - 0.2 0.2 - 0.8 0.8 - 0.9 > 0.9. Municipal distribution of relative risk of SGA and posterior probability are depicted in figures 3.1.10 and 3.1.11. A high risk cluster municipalities with high of SGA was found in Asturias and A Coruña. In those areas low risk of preterm and high risk of low birth weight were found indicating that babies form those regions are small even being delivered after the 36th week of gestation. Some other areas, previously identified as neutral risk areas of preterm and low birth weight (neither higher nor lower risk) are pointed out in SGA maps as high risk areas, whole Salamanca and Avila, part of Caceres, Zamora, Leon, Valladolid municipalities and a small cluster in Palencia and Burgos, nearly the whole territory of Guadalajara, part of Cuenca, Girona, Albacete and Valencia and some municipalities of Cordoba, Jaen and Granada. Newborns from these areas are therefore, mostly babies with an adequate gestational age and birth weight, even though they have a lower weight than expected. To end up, some municipalities of Zaragoza, Alicante, Tenerife, Gran Canaria and Lanzarote showed.
(55) 45. high risk of preterm, low weight and small for gestational age. Therefore babies in these areas have a weight under the expected for their gestational age even if they already are premature. These areas represent the most extreme cases of adverse results in Spain. Figure 3.1.10 Municipal distribution of smoothed relative risk of SGA. < 0.67 0.67 - 0.77 0.77 - 0.91 0.91 - 0.95 0.95 - 1.05 1.05 - 1.1 1.1 - 1.3 1.3 - 1.5 > 1.5.
(56) 46. Figure 3.1.11 Municipal distribution of posterior probability of SGA. < 0.1 0.1 - 0.2 0.2 - 0.8 0.8 - 0.9 > 0.9. List of municipalities showing the highest significant risk of each of the outcomes are available in Appendix II for more detailed information.. 3.2 Sensitivity Analysis: Choosing the distance threshold for near vs. far analysis. Ceramic (457), followed by food and beverages sector (310), treatment of metals and plastics (248), production of transformation of metals (172), Organic chemical industry (149), non-hazardous waste (144) and combustion (138) are the most common type of industries in Spain. Shipyards (8), refineries and coke ovens (12) and biocides (12) are the less frequent activities developed by Spanish industries. In all cases the number of municipalities around pollutant industrial facilities increases dramatically as the radius threshold is expanded, indicating that there is a big difference in the number of cases.
(57) 47. considered “near” on which estimations will be based depending on the distance threshold selected. Table 3.2.1 Total number of facilities of each type and number of municipalities within a radius of 2km, 3km, 4km and 5km from each of them.. Number of municipalities within a radius of Activity Groups Combustion Oil and gas refineries Production/transformation of metals Galvanization Treatment of metals and plastic Mining Cement and Lime Glass and mineral fibers Ceramics Organic chemicals Inorganic chemicals Production of Fertilizers Production of Pesticides Production of Pharmaceutical products Production of explosives Recovery or disposal of hazardous/municipal waste. Incineration of non-hazardous waste and landfills Disposal or recycling of animal carcasses/waste Urban waste-water treatment plants Paper and board Textile (treatment) Slaughterhouses Organic Solvents Use Shipyards. Total industrial facilities 138(5.61%) 12(0.49%) 172(7%) 36(1.46%) 248(10.09%) 33(1.34%) 70(2.85%) 56(2.28%) 457(18.59%) 149(6.06%) 70(2.85%) 23(0.94%) 12(0.49%). 2km 48 4 142 23 189 14 34 28 300 98 35 17 8. 3km 95 8 270 39 386 23 68 56 465 206 86 30 18. 4km 160 12 404 57 595 37 122 93 699 319 130 46 25. 5km 233 20 550 74 840 58 172 137 976 448 182 62 33. 55(2.24%) 58(2.36%). 38 31. 91 59. 146 96. 196 151. 90(3.66%). 45. 93. 171. 255. 144(5.86%). 28. 85. 147. 231. 38(1.55%) 86(3.5%) 88(3.58%) 25(1.02%) 310(12.61%) 80(3.25%) 8(0.33%). 23 32 86 28 171 49 4. 48 93 148 47 326 101 7. 88 164 231 65 525 160 9. 118 253 326 91 731 232 11. The sensitivity analysis was carried out by calculating, for each of the outcomes and distance threshold, the increase in risk due to proximity to each type of industry. Risks for 2km, 3km, 4km and 5km where compared for all outcomes. Only results for MLBW.
(58) 48. and VLBW are used to justify the conclusion reached, but decision was made based on all 5 outcomes behavior (very similar to the ones exposed). Those two outcomes were chosen because they showed the most significant associations with industrial pollution making differences between different thresholds more noticeable. They also constitute two examples of a relatively high prevalence and late stage pregnancy adverse reproductive outcome (MLBW) and low prevalence and early stage pregnancy reproductive adverse outcome (VLBW). Both frequency and stage of pregnancy can make a difference in associations found, the former because precision of estimations depend greatly in the frequency of occurrence of the event and the last because the length of pregnancy is an indicator of the length of the time of exposure. Additional information on the risk behavior for the other outcomes in relation to distance threshold analyzed is available in appendix III. Figure 3.2.1 summarizes the RR and 95% credible intervals for moderate low birth weight. Comparing results obtained with 2km and 3km results, substantial differences in Risk Ratio values and credible intervals amplitude can be observed. From all significant associations found between VPTB and proximity to each type of industrial facility few groups showed smaller RRs for 2km than for 3km threshold (biocides (1.13 vs. 1.09), non-hazardous waste (1.10 vs. 1.08) and disposal or recycling of animal waste (1.13 vs. 1.09) and for most of them risk was higher when using 3km threshold. Lower risk for 3km distance might be due to a dilution of the effect (since includes further and less exposed births) or due to more precise estimations, but, whichever the cases is the estimations did not lose its significance. Extending distance to 4km did not seem to have a general effect in RRs, sometimes increase, and sometimes decrease. However CrIs narrow and some associations became significant (Refineries and coke ovens, production and transformation of metals, Mineral industry and Fertilizers). For 5km.
(59) 49. the trend was to shrank RRs towards 1 making some significant associations non significant even with narrower credible intervals. Similar results were observed for MPTB and SGA also relatively high prevalence and late stage pregnancy adverse reproductive outcomes. Based on these first comparisons we could conclude that, for this type of outcomes and using Spanish municipalities as geographical units, we need to define thresholds above 3km to increase the sample size and get stable estimations. However, widening the limit too much could dilute the effect, missing some associations as happens when increasing the distance threshold form 4 to 5km..
(60) 50. Figure 3.2.1 Non-Adjusted relative risk of MLBW by type of industrial activity and distance threshold. 2 km. 3 km. Combustion. RR Lower Upper 1.05 0.98 1.11. RR Lower Upper 1.07 1.02 1.11. Refineries and coke ovens Metallurgical Galvanization Surface treatment metals/plastic Mineral industry. 1.06 1.00 1.06 1.05 1.01. 0.90 0.95 0.99 1.02 0.85. 1.23 1.04 1.14 1.09 1.20. 1.13 1.03 1.09 1.08 1.04. 0.98 0.99 1.04 1.05 0.93. 1.29 1.06 1.15 1.10 1.16. Cement and lime Glass and mineral fibres Ceramic Organic chemical industry Inorganic chemical industry. 1.00 1.07 1.02 1.05 1.04. 0.92 0.98 0.99 1.01 0.97. 1.10 1.16 1.07 1.09 1.12. 1.02 1.08 1.04 1.08 1.06. 0.96 1.02 1.01 1.05 1.02. 1.08 1.13 1.07 1.12 1.11. Fertilizers Biocides Pharmaceutical products Explosives and pyrotechnic Hazardous waste. 1.01 1.13 1.09 0.94 1.00. 0.94 1.00 1.03 0.87 0.93. 1.10 1.27 1.15 1.03 1.06. 1.03 1.09 1.10 0.98 1.07. 0.97 1.01 1.06 0.92 1.03. 1.11 1.17 1.15 1.05 1.12. Non-hazardous waste Disposal or recycling of animal waste Urban waste-water treatment plants Paper and board Pre-treatment or dyeing of textiles. 1.10 1.13 1.05 1.05 1.01. 1.00 1.02 0.99 0.99 0.92. 1.22 1.26 1.10 1.11 1.11. 1.08 1.09 1.03 1.08 1.03. 1.03 1.02 1.00 1.03 0.95. 1.14 1.17 1.07 1.12 1.11. Food and Beverages sector Organic Solvents Use Shipyards. 1.04 1.01 1.03. 1.01 0.96 0.93. 1.08 1.06 1.14. 1.07 1.05 1.04. 1.04 1.01 0.95. 1.10 1.09 1.14. 0.9. 1. 1.1. 1.2. 0.9. 4 km RR Lower Upper 1.06 1.03 1.10. RR Lower Upper 1.07 1.04 1.10. Refineries and coke ovens Metallurgical Galvanization Surface treatment metals/plastic Mineral industry. 1.11 1.05 1.09 1.08 1.10. 1.01 1.01 1.04 1.05 1.01. 1.22 1.08 1.14 1.10 1.21. 1.12 1.05 1.07 1.07 1.05. 1.04 1.02 1.02 1.04 0.97. 1.20 1.09 1.11 1.10 1.14. Cement and lime Glass and mineral fibres Ceramic Organic chemical industry Inorganic chemical industry. 1.03 1.08 1.03 1.09 1.07. 0.99 1.04 1.00 1.06 1.03. 1.08 1.13 1.06 1.12 1.11. 1.02 1.06 1.04 1.07 1.06. 0.98 1.02 1.01 1.04 1.02. 1.06 1.11 1.07 1.10 1.10. Fertilizers Biocides Pharmaceutical products Explosives and pyrotechnic Hazardous waste. 1.06 1.08 1.09 1.00 1.09. 1.00 1.01 1.05 0.95 1.05. 1.12 1.16 1.13 1.05 1.13. 1.06 1.09 1.08 0.99 1.08. 1.01 1.02 1.04 0.95 1.04. 1.12 1.16 1.12 1.04 1.12. Non-hazardous waste Disposal or recycling of animal waste Urban waste-water treatment plants Paper and board Pre-treatment or dyeing of textiles. 1.05 1.09 1.03 1.08 1.01. 1.01 1.03 1.00 1.04 0.94. 1.10 1.14 1.06 1.12 1.08. 1.05 1.08 1.04 1.08 1.00. 1.02 1.04 1.02 1.04 0.93. 1.09 1.13 1.08 1.11 1.07. Food and Beverages sector Organic Solvents Use Shipyards. 1.07 1.06 1.04. 1.04 1.02 0.95. 1.09 1.09 1.13. 1.06 1.05 1.03. 1.04 1.02 0.95. 1.08 1.09 1.11. 1. 1.1. 1.2. 5 km. Combustion. 0.9. 1. 1.1. 1.2. 0.9. 1. 1.1. 1.2.
(61) 51. Figure 3.2.2 summarizes the RRs and 95% credible intervals for very low birth weight. Credible intervals narrowed greatly when expanding radius from 2km to 3km. No association between VLBW and proximity to any of the industrial groups was found for 2km threshold distance but borderline significant association between risk of VLBW and proximity to pharmaceutical products production, hazardous, non-hazardous and animal waste, food and beverage plants and shipyards was found when using 3km threshold. Credible intervals continue to narrow as radius increased but effect was diluted, approaching RRs to one and loosing significance of effects found with 3km analyses. Behavior was similar for very preterm birth, also a low prevalence early stage outcome. Based on these observations, we also conclude that we should define thresholds above 3km to get a sufficient sample size to make stable estimations. Again, we need to be careful and stay close to this distance since effect dilutes as we increase the threshold.. In both cases, low and high prevalence outcomes, pattern seemed to be the same for all distances, modifying the increase in the threshold distance the magnitude and significance of the association but not its direction. Given that the most commonly used threshold distances used in these type of studies lye between 2 and 7.5km [51, 58, 79, 104-107] and that our sensitivity analysis suggest that under 3km we do not get enough sample size to make stable estimations but as we approach to 5km effects dilutes we decided to use a middle point between 2km and 5km distances. 3.5km was the distance threshold used for the assessment of the association between proximity to pollutant industrial facilities (by group of activity) and risk of very preterm birth, moderate preterm birth, very low birth weight, moderate low birth weight and small for gestational age..
(62) 52. Figure 3.2.2 Non-Adjusted Relative risk of VLBW by type of industrial activity and distance threshold. 2 km. 3 km. Combustion. RR Lower Upper 1.04 0.90 1.22. RR Lower Upper 1.03 0.94 1.13. Refineries and coke ovens Metallurgical Galvanization Surface treatment metals/plastic Mineral industry. 1.09 1.00 0.98 1.01 1.20. 0.83 0.91 0.84 0.94 0.80. 1.44 1.10 1.16 1.08 1.81. 1.09 1.01 1.04 1.02 1.17. 0.83 0.94 0.93 0.97 0.89. 1.41 1.08 1.16 1.07 1.54. Cement and lime Glass and mineral fibres Ceramic Organic chemical industry Inorganic chemical industry. 1.13 0.92 1.03 1.02 0.99. 0.92 0.74 0.94 0.93 0.83. 1.39 1.15 1.13 1.11 1.18. 1.00 1.03 1.06 1.01 1.06. 0.88 0.93 0.98 0.95 0.97. 1.15 1.15 1.14 1.09 1.16. Fertilizers Biocides Pharmaceutical products Explosives and pyrotechnic Hazardous waste. 1.13 0.80 1.05 0.98 1.10. 0.96 0.57 0.93 0.80 0.95. 1.32 1.13 1.17 1.21 1.27. 1.13 0.92 1.09 1.01 1.08. 0.98 0.78 1.00 0.86 0.99. 1.30 1.08 1.19 1.18 1.18. Non-hazardous waste Disposal or recycling of animal waste Urban waste-water treatment plants Paper and board Pre-treatment or dyeing of textiles. 1.11 1.11 1.09 0.95 0.93. 0.88 0.84 0.97 0.84 0.73. 1.39 1.46 1.21 1.07 1.19. 1.13 1.17 1.05 0.99 0.87. 1.01 1.00 0.98 0.90 0.70. 1.26 1.36 1.13 1.09 1.07. Food and Beverages sector Organic Solvents Use Shipyards. 1.04 1.02 1.07. 0.96 0.91 0.91. 1.13 1.14 1.26. 1.05 1.01 1.16. 0.99 0.93 1.01. 1.12 1.10 1.34. 0.6. 0.8. 1. 1.2. 1.4. 1.6. 1.8. 0.6. 0.8. 4 km. 1. 1.2. 1.4. 1.6. 1.8. 1.4. 1.6. 1.8. 5 km RR Lower Upper 1.03 0.96 1.10. Combustion. RR Lower Upper 1.03 0.96 1.11. Refineries and coke ovens Metallurgical Galvanization Surface treatment metals/plastic Mineral industry. 1.07 1.01 1.05 1.04 1.11. 0.89 0.95 0.95 0.98 0.88. 1.28 1.08 1.16 1.09 1.40. 1.05 1.00 1.01 1.04 1.03. 0.92 0.94 0.92 0.99 0.85. 1.19 1.06 1.10 1.09 1.25. Cement and lime Glass and mineral fibres Ceramic Organic chemical industry Inorganic chemical industry. 1.02 1.04 1.05 1.02 1.04. 0.92 0.95 0.98 0.96 0.96. 1.12 1.13 1.12 1.09 1.13. 1.02 1.05 1.05 1.02 1.03. 0.94 0.97 0.99 0.96 0.96. 1.11 1.13 1.12 1.08 1.11. Fertilizers Biocides Pharmaceutical products Explosives and pyrotechnic Hazardous waste. 1.10 0.95 1.10 1.03 1.06. 0.97 0.82 1.02 0.92 0.99. 1.24 1.11 1.19 1.15 1.15. 1.06 0.95 1.07 0.98 1.05. 0.95 0.82 0.99 0.89 0.98. 1.18 1.11 1.15 1.09 1.12. Non-hazardous waste Disposal or recycling of animal waste Urban waste-water treatment plants Paper and board Pre-treatment or dyeing of textiles. 1.10 1.10 1.05 1.02 0.87. 0.99 0.99 0.99 0.95 0.72. 1.21 1.22 1.11 1.10 1.06. 1.02 1.06 1.06 1.00 0.87. 0.94 0.97 1.01 0.93 0.72. 1.10 1.15 1.12 1.07 1.04. Food and Beverages sector Organic Solvents Use Shipyards. 1.05 1.01 1.15. 1.00 0.94 1.00. 1.11 1.08 1.32. 1.03 0.98 1.11. 0.98 0.92 0.98. 1.09 1.05 1.27. 0.6. 0.8. 1. 1.2. 1.4. 1.6. 1.8. 0.6. 0.8. 1. 1.2.
Figure


+7


Documento similar
Statistical results of the comparison between prevalence of Small for Gestational age of males by vaginal delivery to primiparous mothers and prevalence of Small
In the preparation of this report, the Venice Commission has relied on the comments of its rapporteurs; its recently adopted Report on Respect for Democracy, Human Rights and the Rule
To investigate the association of early life factors such as anthropometric neonatal data (i.e., birth weight and birth length) and breastfeeding practices (i.e.,
were used in 94 patients with a mean age if 52 years among others. Methotrexate was used as a systemic anti-inflamma- tory therapy, mainly in moderate and severe psoriasis, a doses
The expansionary monetary policy measures have had a negative impact on net interest margins both via the reduction in interest rates and –less powerfully- the flattening of the
In our sample, 2890 deals were issued by less reputable underwriters (i.e. a weighted syndication underwriting reputation share below the share of the 7 th largest underwriter
This control is relevant not only because it purges our measure of effort of any differences in cognitive ability, but also because it controls out part of the
The aim of this study was to determine the prevalence of late fetal mortality and risk factors for cesarean birth in women with a dead fetus of 28 or more weeks of gestation in
