Bacterial Translocation Is Linked to
Increased Intestinal IFN-
γγγγγ
,
IL-4, IL-17, and mucin-2 in Cholestatic Rats
Natali Vega-Magaña,* Vidal Delgado-Rizo,† Leonel García-Benavides,‡ Susana del Toro-Arreola,* Jorge Segura-Ortega,§ Adelaida Sara M. Zepeda Morales,* José Sergio Zepeda-Nuño,|| Marta Escarra-Senmarti,* Jorge Gutiérrez-Franco,* Jesse Haramati,¶ Miriam R. Bueno-Topete*
* Instituto de Investigación en Enfermedades Crónico-Degenerativas, Departamento de Biología Molecular y Genómica. Centro Universitario de Ciencias de la Salud, Universidad de Guadalajara. Guadalajara, Jalisco, México.
† Laboratorio de Inmunología, Departamento de Fisiología, Centro Universitario de Ciencias de la Salud,
Universidad de Guadalajara. Guadalajara, Jalisco, México.
‡ Instituto de Terapéutica Experimental y Clínica, Departamento de Fisiología,
Centro Universitario de Ciencias de la Salud, Universidad de Guadalajara. Guadalajara, Jalisco, México.
§ Servicio de Gastroenterología, OPD Hospital Civil de Guadalajara “Juan I. Menchaca”.
Guadalajara, Jalisco, México.
|| Laboratorio de Patología, Departamento de Microbiología y Patología, Centro Universitario de Ciencias de la Salud.
Universidad de Guadalajara. Guadalajara, Jalisco, México.
¶ Laboratorio de Inmunología, Departamento de Biología Celular y Molecular,
Centro Universitario de Ciencias Biológicas y Agropecuarias, Universidad de Guadalajara. Guadalajara, Jalisco, México. March-April, Vol. 17 No. 2, 2018: 318-329
INTRODUCTION
Bacterial translocation (BT) in chronic liver diseases is an important triggering factor of infections and sepsis. Moreover, bacterial infections are responsible for 30-50% of deaths in cirrhosis. Systemic alterations to the immune
system with respect to BT have been thoroughly reported in the literature; the most notable of these include de-creased phagocytic capacity, lower production of comple-ment molecules, and chronic inflammation.1 However, intestinal alterations that promoted BT have yet to be well explored and should be considered a novel research frontier.
Manuscript received: Manuscript received: Manuscript received: Manuscript received:
Manuscript received: April 09, 2017. Manuscript accepted:Manuscript accepted:Manuscript accepted:Manuscript accepted:Manuscript accepted: July 03, 2017.
DOI:10.5604/01.3001.0010.8662 A B S T R A C T A B S T R A C T A B S T R A C T A B S T R A C T A B S T R A C T
Background and rationale for the study. Background and rationale for the study.Background and rationale for the study. Background and rationale for the study.
Background and rationale for the study. Bacterial translocation is an important triggering factor of infection and mortality in cirrhosis. In a rat model using bile duct ligation (BDL), bacterial translocation appears within 24 h after ligation. The dynamic between TH1/TH2/TH17 cytokines and the integrity of the colonic mucosa in the context of cirrhosis is little known. This study aims to deter-mine the link between bacterial translocation and intestinal inflammation in a cholestasis model. Additionally, alterations of the colon-ic mucus layer and the bacterial load were also addressed. Results.Results.Results.Results. Bacterial translocation detected by microbiological cultures andResults. MALDI-TOF showed that Escherichia coli predominates in mesenteric lymph nodes of BDL rats. Intestinal bacterial load analyzed by qPCR indicates a dramatic Escherichia/Shigella overgrowth at 8 and 30 days post-BDL. IFN-γ, IL-4, and IL-17 evaluated by Western blotting were increased at 8 and 30 days in the small intestine. In the colon, in contrast, only IFN-γ was significantly in-creased. The colonic mucus layer and mucin-2 expression determined by Alcian blue staining and immunohistochemistry surprisingly showed an increase in the mucus layer thickness related to increased mucin-2 expression during the entire process of liver damage. Hepatic enzymes, as well as collagen I, collagen III, TNF-α, and IL-6 liver gene expression were increased. In conclusionIn conclusionIn conclusionIn conclusionIn conclusion, bacte-rial overgrowth associated with bactebacte-rial translocation is linked to the over-expression of IFN-γ, IL-4, IL-17 and mucin-2. These mole-cules might facilitate the intestinal permeability through exacerbating the inflammatory process and disturbing tight junctions, leading to the perpetuation of the liver damage.
Key words. Key words.Key words. Key words.
Key words. Inflammation. Mucus layer. Bile duct ligation.
The Official Journal of the Mexican Association of Hepatology, the Latin-American Association for Study of the Liver and
Cytokines characteristic of TH1, TH2, and TH17 im-mune responses are necessary to support the stability of gut epithelia; the aberrant production of these cytokines, how-ever, has been related to inflammatory bowel diseases.2,4
T-bet is the major transcription factor for the expres-sion of IFN-γ. IFN-γ is a strong activator of macrophages, with a principal function of protecting the host against in-tracellular infections. Likewise, in order to improve path-ogen recognition, this cytokine also induces expression of MHC molecules and IgG isotype switching.4
GATA-3 is a transcription factor that drives TH2 cell differentiation. IL-4 is necessary for the elimination of helminths, production of mucin-2 and intestinal motili-ty.5,6 On the other hand, under inflammatory conditions IL-4 strongly induces the expression of claudin-2, contrib-uting to intestinal permeability.7,8
ROR-γ is the master transcription factor in TH17 cells and is necessary for the production of IL-17. IL-17 induc-es the intinduc-estinal epithelial production of antimicrobial peptides, mucins, and the recruitment of neutrophils.9 Ad-ditionally, TH17 cells promote IgA isotype switching in B cells, for the neutralization of gut bacteria.10 Nonetheless, the participation of the above mentioned cytokines in the intestinal inflammatory process during hepatic fibrosis de-velopment in humans and rodents is as of yet unknown.
The intestinal mucus layer also can affect BT; this works as a physical barrier to protect the epithelium against noxious agents, viruses, and pathogenic bacteria. Mucin-2 is the predominant secreted mucin in the whole intestine.11
Therefore, the aim of this study was to determine the link between bacterial translocation, intestinal inflamma-tion and mucus layer in a cholestasis model.
MATERIAL AND METHODS
Cholestasis induced by bile duct ligation
Male Wistar rats weighing 200-250 g, were obtained from Charles River (Boston, MA, USA). Cholestasis was induced by bile duct ligation (BDL) according to the method of Lee, et al., 1988. Ligated animals (n = 17) were
divided into two groups, one corresponding to 8 days and the other one to 30 days of BDL evolution. At the conclu-sion of the experiment, 5 survivor animals remained in each BDL group; meanwhile, all sham animals (control) survived (n = 5). A control group of healthy rats (n = 5) without any manipulation was included. Animals were sacrificed and representative samples of liver, mesenteric lymph nodes (MLNs) and intestine were obtained.
This project was approved to Ethics Committee of the University of Guadalajara based on technical specifications for the production, care, and use of laboratory animals NOM-062-ZOO-1999 and the “Guide for the Care and Use of Laboratory Animals” prepared by the National Academy of Sciences and published by the National Insti-tutes of Health established in 1985.
Histological analysis
Samples of the middle region of the small intestine and colon were obtained. Fouts, et al., 2012 reported that these regions of the intestines are the most vulnerable to intesti-nal permeability in the model of BDL.12 Liver sections
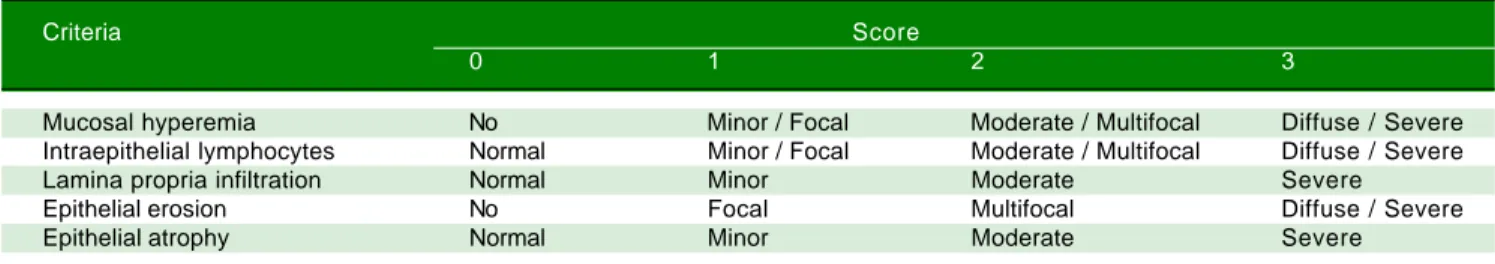
(5-μm thick) were stained with Masson's trichrome. The amount of fibrosis was assessed based on the Ishak score.13 Intestinal sections (5-μm thick) were stained with H&E. The severity of epithelial damage was determined follow-ing the criteria shown in table 1.14,15
Microbiological cultures and MALDI-TOF/MS
MLN and liver were removed under aseptic condi-tions. All the samples were immersed in sterile water and 70% ethanol. Subsequently, the tissues were ground in 15 mL of Trypticase Soy broth and pre-incubated for 12 h at 37°C. Ten μL were plated on Agar with 5% sheep blood. Plates were incubated under aerobic conditions at 37 °C for 24 h.
Single bacterial colonies were carefully spread onto the MALDI target plate, 1 μL of matrix (α -cyano-4-hydroxy-cinnamic acid in saturated solution with 50% acetonitrile and 2.5% trifluoroacetic acid) was added, and the mass spectra analysis was performed in a MALDI Biotyper
Mi-Table 1. Criteria of intestinal histological score.
Criteria Score
0 1 2 3
Mucosal hyperemia No Minor / Focal Moderate / Multifocal Diffuse / Severe
Intraepithelial lymphocytes Normal Minor / Focal Moderate / Multifocal Diffuse / Severe
Lamina propria infiltration Normal Minor Moderate Severe
Epithelial erosion No Focal Multifocal Diffuse / Severe
croflex LT (Bruker Daltonics, Bremen, Germany). Three different identification events were prepared using differ-ent colonies from the same isolate. Spectra data with Log score values lower than 1.9 was excluded. The spectra were analyzed using the MALDI BioTyper software (Bruker Daltonics, Germany).
qPCR
DNA was isolated from 100 mg of stool, following the manufacturer's instructions using the ZR Fecal DNA MiniPrep™ kit. Primers 5'-GTTAATACCTTTGCT-CATTGA-3' and 5'-ACCAGGGTATCTAATCCTGTT-3' were used to amplify the V3 to V4 regions of the 16S rDNA of both Escherichia and Shigella. Reactions were per-formed with the following conditions: hold 95°C (7 min) followed by 40 cycles of 95 °C (30 s), 60 °C (40 s). Bacteri-al concentration was cBacteri-alculated by comparing the CT vBacteri-al- val-ues obtained from the standard curve of Escherichia coli (1 x 10³ - 1 x 10⁹ CFU/mL). Bacterial quantity was expressed as log concentration.
Western blotting
50 μg of protein were separated in SDS-PAGE 12 % and transferred to PVDF membranes. A 5 % Blotting-Grade Blocker (BioRad Laboratories, Hercules, CA) was added for 45 min. Subsequently, primary antibodies anti-T-bet sc-21763; anti-IFN-γ sc-74106; anti-GATA-3 sc-137152; anti-IL-4 sc-80094; anti-ROR-γ sc-28559 and anti-IL-17 sc-374218 (Santa Cruz Biotechnology, Inc., CA, USA) were used at 1:3000 and incubated at 4 °C followed by 1 h with 1:8000 HRP-linked secondary antibodies at 37°C. Chemiluminescence reactions (Immobilion, Merck Mill-ipore®) were performed on Microchemi 4.2. Densitome-try was analyzed with the GelQuant 12.2 software.
Alcian blue staining
Staining was performed on 2-μm thick, Carnoy-fixed (for 2.5 hours without removal of fecal content), paraffin-embedded colon sections. Slides were immersed in acetic acid at 3% for 3 min, following by 30 min in alcian blue so-lution pH 2.5. Counterstaining was performed with nuclear fast red. Intestinal mucus thickness analysis was carried out with the Leica application suite 16.0 software (LASEZ).
Immunohistochemistry
Immunohistochemistry was performed on 1-μm-thick Carnoy-fixed, paraffin-embedded colon sections. Rabbit anti-mucin 2 sc-15334 (Santa Cruz Biotechnology, Inc., CA, USA) at 1:50 dilution was incubated for 2 h at 37 °C, followed
by 45 min with Dako EnVision Labelled Polymer. Diami-nobenzidine (Dako) was used as a chromogen. Immunostain-ing was considered positive when cytoplasmic or extra-nuclear mucin-2 staining were observed. The percentage of cells stained was scaled in accordance with their staining intensity: 1 (1-25 %), 2 (26-50 %), 3 (51-75 %) and 4 (76-100 %).
Biochemical analysis
Serum hepatic enzymes including total bilirubin, alanine aminotransferase (ALT) and alkaline phosphatase were determined by an automated method.
qRT-PCR
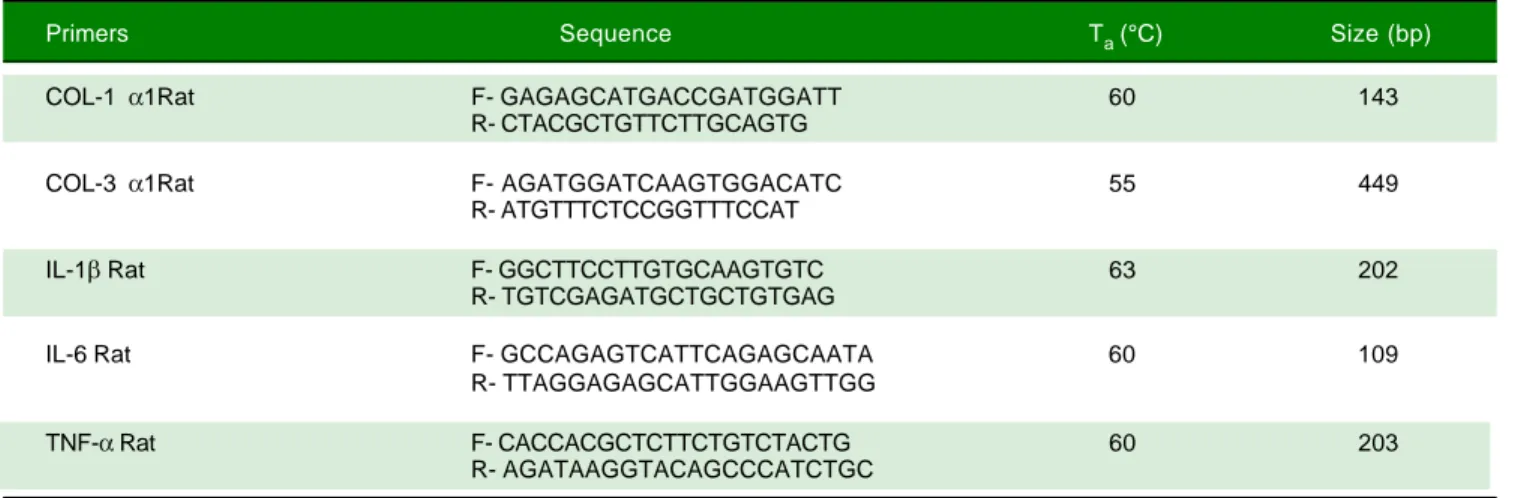
RNA was isolated from 100 mg of liver using TRIzol reagent (Invitrogen, Belgium) and reverse transcribed. PCR conditions were 95 °C (10 min) followed by 35 cy-cles of 95 °C (15 s). Alignment temperature and primer se-quences are shown in table 2. Gene expression analysis was performed by the 2- ΔΔCT method.
Statistical analysis
Data were analyzed using the SPSS 10.0 statistical pack-age (SPSS Inc.). Results were expressed as mean ± SD. Comparisons were performed using one-way ANOVA, followed by Bonferroni's post hoc test. P-values ≤ 0.05 were considered as statistically significant.
RESULTS
Histopathological alterations in the liver of BDL rats
To evaluate liver fibrosis, the tissues were stained with Masson's trichrome stain. In control animals, hepatic sec-tions exhibited a normal morphology of the portal triad and central vein. In experimental animals, ductal prolifera-tion and extracellular matrix deposits were evident at 8 days of BDL. At 30 days post-BDL, fibrosis is clearly ob-served throughout the entire parenchyma. The Ishak analy-sis showed that the liver damage was gradually increased from 8 days (p < 0.001) to 30 days (p < 0.001) post-BDL (Figure 1A).
Histopathological alterations in the intestinal epithelium are induced by BDL
Table 2. Primers sequences.
Primers Sequence Ta (°C) Size (bp)
COL-1 α1Rat F- GAGAGCATGACCGATGGATT 60 143
R- CTACGCTGTTCTTGCAGTG
COL-3 α1Rat F- AGATGGATCAAGTGGACATC 55 449
R- ATGTTTCTCCGGTTTCCAT
IL-1β Rat F- GGCTTCCTTGTGCAAGTGTC 63 202
R- TGTCGAGATGCTGCTGTGAG
IL-6 Rat F- GCCAGAGTCATTCAGAGCAATA 60 109
R- TTAGGAGAGCATTGGAAGTTGG
TNF-α Rat F- CACCACGCTCTTCTGTCTACTG 60 203
R- AGATAAGGTACAGCCCATCTGC
COL-1α1: collage 1 alpha 1. COL-3 α1: collage 3 alpha 1. IL-1: interleukin 1. IL-6: interleukin 6. TNF-α: tumor necrosis factor alpha. bp: bases pairs.
Figure 1. Figure 1.Figure 1.
Figure 1.Figure 1. Histological analysis of liver and bowel sections. A.A.A.A.A. Representative images of liver sections with Masson's trichrome staining of control, 8 and 30 days post-BDL and Ishak analysis. B.B.B.B.B. Representative images of small intestine sections with Hematoxylin-eosin staining of control, 8 and 30 days post-BDL and histological analysis. C.C.C.C.C. Representative images of colon sections with Hematoxylin-eosin staining of control, 8 and 30 days post-BDL and histological analysis. Inflammatory cellular infiltrated (red asterisk); dilation of the central lacteal cavity (black asterisk); epithelial atrophy (red arrow); epithelial erosion (black arrow). Bars represent 100 μm. Results were expressed as the mean ± SD. Five rats per group * p ≤ 0.05, ** p ≤ 0.01, *** p ≤ 0.001.
Liver
Colon Small intestine A A A A A
B B B B B
C C C C C
Ctl 8d 30d
Ishak score
6
4
2
0
***
***
Ctl 8d 30d
Histological score
15
10
5
0
***
***
Ctl 8d 30d
Histological score
15
10
5
0
* *
Ctl 8d 30d
*
*
*
*
*
* *
lymphocytes. The 8 and 30 days post-BDL groups showed an increase in the number of intraepithelial lymphocytes and lymphocyte infiltration into the lamina propria, as well as erosion and atrophy of the epithelium. In both small intestine and colon, these histological changes were statistically significant (p < 0.001 and p < 0.05, respective-ly) when compared with the control group. Additionally, in many microscopic fields of the small intestine from the BDL groups, a dilation of the central lacteal cavity was ob-served (Figures 1B, 1C).
Bacterial translocation to the liver is present at 8 days post-BDL
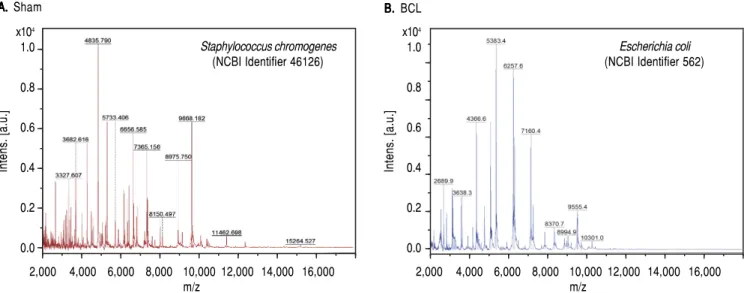
A recurrent and important complication of liver dis-ease is BT. To assess this variable, we performed bacterial cultures of the liver and MLN homogenates. Our results showed negative cultures in healthy rats. However, cul-tures from the MLNs of the sham control rats were posi-tive. In contrast, cirrhotic rats showed BT in both organs at eight days after BDL. Then, we analyzed single bacterial colonies from mesenteric lymph nodes by MALDI-TOF. Our results show that sham rats were positive for
Staphy-lococcus chromogenes (NCBI Identifier: 46126) (Figure 2A),
while cirrhotic rats were positive for Escherichia coli
(NCBI Identifier: 562) (Figure 2B).
Intestinal bacterial load is increased during liver damage by BDL
At eight days post liver damage by BDL, the intestinal bacterial load of the genera Escherichia/Shigella increased
dramatically, approximately four logarithms when com-pared with the control groups (p < 0.001). Bacterial over-growth was maintained at 30 days post-BDL with two logarithms of difference with respect to the control groups, p < 0.05 (Figure 3).
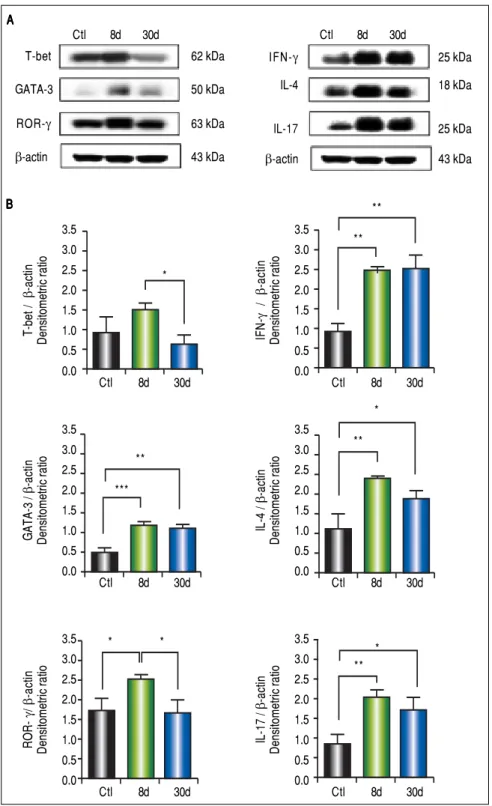
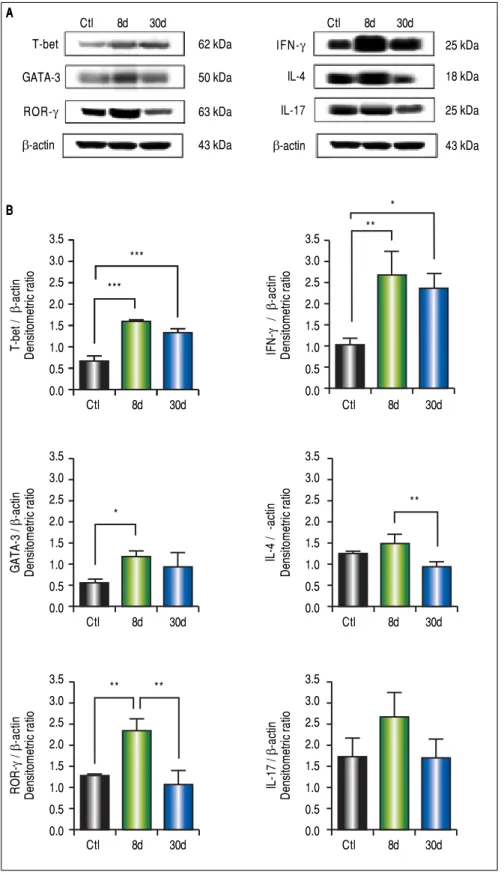
IFN-γγγγγ, IL-4, and IL-17 are increased in the small intestine during hepatic fibrosis
We observed significantly increased levels of IFN-γ
(p < 0.01), GATA-3 (p < 0.001), IL-4 (p < 0.01), ROR-γ
(p < 0.05) and IL-17 (p < 0.01) (Figure 4B) in the small
in-Figure 3. Figure 3.Figure 3.
Figure 3.Figure 3. Intestinal bacterial load of Escherichia/Shigella by qPCR.
Ampli-fication was carried out by detection of 16S rDNA of Escherichia/Shigella.
Bacterial concentration from each fecal sample was calculated by comparing
the CT values obtained from the standard curve of E. coli (1 x 10³ - 1 x 10⁹
CFU/mL). Results were expressed as the mean ± SD. Five rats per group.
* p ≤ 0.05, ** p ≤ 0.01, *** p ≤ 0.001.
log
concentratio
n
1010
108
106
104
102
100
Ctl 8d 30d
** *
AAAAA. . . Sham B. B. B. B. B. BCL
Figure 2. Figure 2. Figure 2. Figure 2.
Figure 2. MALDI-TOF/MS average spectra plots of isolates from mesenteric lymph nodes. A. A. A. A. A. Representative spectral plot of mesenteric lymph nodes from
sham rats shows specific peaks for Staphylococcus chromogenes (red) NCBI identifier 46126. B.B.B.B.B. Representative spectral plot of mesenteric lymph nodes from
BDL rats shows specific peaks for Escherichia coli (blue) NCBI identifier 562. The x-axis shows m/z values and the y-axis indicates the intensities of peaks
(ex-pressed in arbitrary intensity units). The analysis was performed in the Burker biotyper platform (n = 5 per group).
Intens.
[a.u.
]
Staphylococcus chromogenes
(NCBI Identifier 46126) x104
1.0
0.8
0.6
0.4
0.2
0.0
2,000 4,000 6,000 8,000 10,000 12,000 14,000 16,000 m/z
Intens.
[a.u.
]
Escherichia coli
(NCBI Identifier 562) x104
1.0
0.8
0.6
0.4
0.2
0.0
testine during early or chronic stages of liver damage by cholestasis, compared to control groups. Interestingly, the expression of T-bet at 30 days post-BDL was down-regulated.
IFN-γγγγγ is predominant in the
colon during the entire process of liver damage
In the western blot analysis of colon extracts, T-bet (p < 0.001) and IFN-γ (p < 0.01) levels predominated at 8 and 30 days after BDL, whereas IL-4 and IL-17 exhibited no significant differences when compared to the control groups. GATA-3 (p < 0.05) and ROR-γ (p < 0.01) levels were significantly increased at eight days post-BDL, but to a lesser extent than T-bet and IFN-γ (Figure 5B).
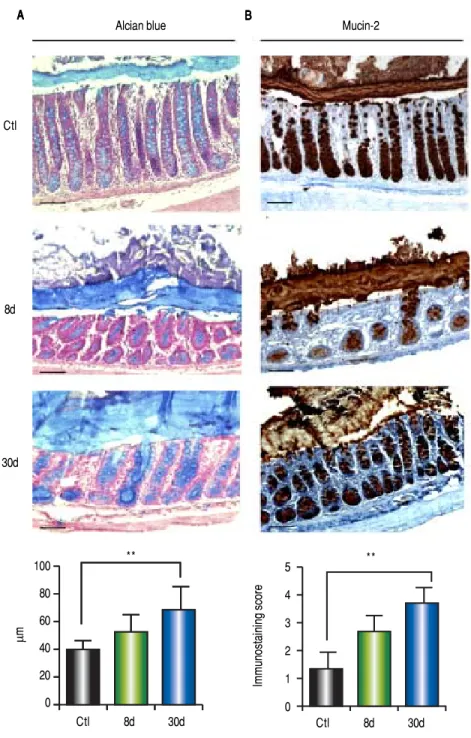
BDL increases mucus layer thickness and mucin-2 expression
Alcian blue analysis showed significantly increased co-lonic mucus layer thickness at 8 days (p < 0.001) and 30 days (p < 0.001) post-BDL with respect to the control groups (Figure 6A). Similarly, colonic mucin-2 expres-sion was notably increased during the entire process of liver damage by BDL. 100% of goblet cells were observed to be positive for mucin-2 immunostaining. However, the intensity of the staining was increased in parallel with the liver damage (Figure 6B). Significant differences were found only between the control and the 30 days post-BDL groups (p < 0.001).
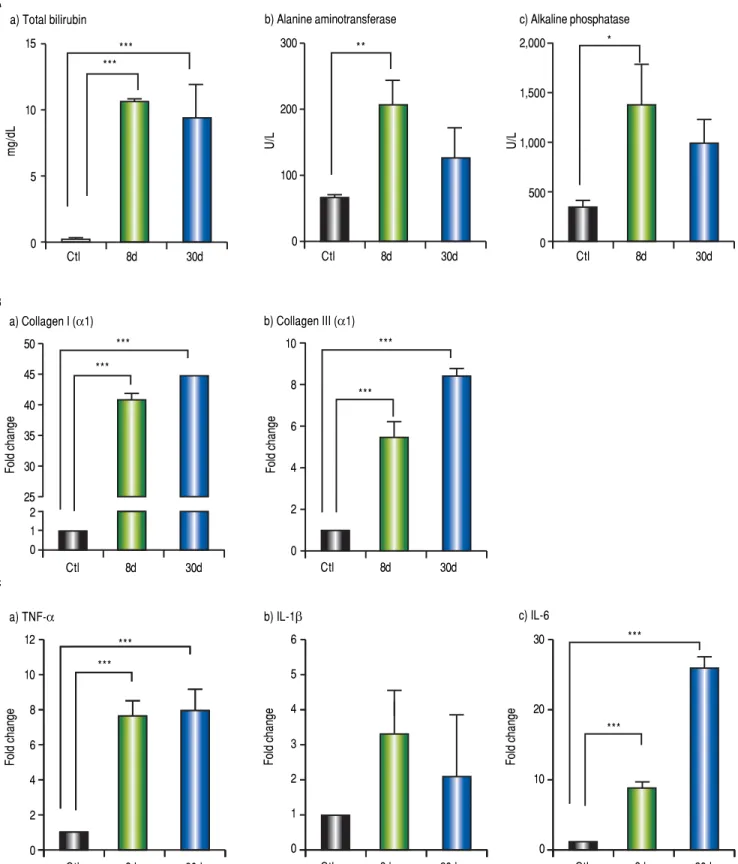
Fibrosis and inflammation in the liver of BDL rats
Markers of liver damage increase significantly: total bi-lirubin (p < 0.001), alanine aminotransferase (p < 0.01) and alkaline phosphatase (p < 0.05) from BDL groups (Figure 7A). Additionally, enhanced gene expression of the classical fibrogenic collagen I (α1) and collagen III ( α1) was observed during cholestasis (p < 0.001) (Figure 7B). On the other hand, TNF-α and IL-6 increased significantly at 8 and 30 days post-BDL (p < 0.001). IL-1β did not show any significant difference (Figure 7C).
DISCUSSION
BT has been postulated as the angular mechanism in the pathogenesis of spontaneous bacterial infections in liver cirrhosis. Our results show that BT to the MLNs and liv-er was evident at 8 days post-BDL. Intliv-erestingly, we note that in the group of sham rats, MLNs also had positive bacterial loads, while the liver remained bacteria free. This point is consistent with Yorihiko Ogata, et al., 2003 who also found positive bacterial cultures in the MLNs of
sham rats in the BDL model.16 A possible trigger for this BT could be surgical stress,17 which may have influenced our results. Regarding to MALDI-TOF analysis, it showed that Escherichia coli predominates in MLNs of BDL animals, whereas Staphylococcus chromogenes in sham rats. Indeed, both bacteria are pathogens, but they have a different virulence grade. Thus, a possible explanation for the substantial difference between both groups is that ap-parently sham animals might have the ability to contain and avoid bacterial migration to liver, in contrast to BDL group. It is possible that BT control is dictated by the im-munogenicity and immuno-evasion mechanisms of the different microorganisms, as well as alterations on system-ic and local immune response. Gram negative bacteria such as Escherichia coli, Klebsiella pneumonia and other entero-bacteria, have been postulated to be the most significant in the MLN translocation during alcoholic and viral liver damage.18 Nonetheless, in cholestatic processes it is poor-ly known.
In parallel, we observed a dramatic intestinal bacterial overgrowth associated with the genera Escherichia/Shigella during the entire period of liver damage (8 and 30 days). Interestingly, these species are the main cause of infec-tions in patients with liver cirrhosis.19
The etiology of bacterial overgrowth in liver cirrhosis is multifactorial.20 Our results suggest that the decrease in the bile acid flow promotes intestinal bacteria overgrowth of the genera Escherichia/Shigella, which are related to the BT and hepatic damage. An important additional finding of our histopathological analysis of the intestines from the BDL groups was the central lacteal cavity dilatation. This phenomenon has been linked to higher rates of BT in MLNs and endotoxemia.16,21
The local over-expression of IFN-γ may lead to inflam-matory chronic processes and damage of the intestinal epi-thelium.22 Our results show a significant increase of IFN-γ in the small intestine during the entire process of hepatic in-jury in our model. However, we observed that the expres-sion of T-bet decreased in the 30 day post-BDL group. These results suggest that perhaps the central cell source of IFN-γ
might be other cells of the immune system, such as NK cells,
γδ T cells or memory CD8+ T cells, which produce IFN-γ
in the presence of the transcription factor EOMES.23-25 IFN-γ increased was more evident in the colon. It is important to mention that this study is the first to evaluate the expression of intestinal IFN-γ in the experimental model of BDL. These results suggest that the over-expres-sion of IFN-γ might, at least initially, lead to the restora-tion of intestinal homeostasis. Addirestora-tionally, the presence of IFN-γ might lead to decreased stability of the intestinal epithelia.
alter-Figure 4. Figure 4.Figure 4. Figure 4.
Figure 4. Expression of T-bet, IFN-γ, GATA-3, IL-4, ROR-γ, and IL-17 in small intestine by Western blotting. A.A.A.A.A. Representative blot of con-trol (healthy and sham), 8 and 30 days post-BDL. Observed bands of T-bet (62 kDa), IFN-γ (25 kDa), GATA-3 (50 kDa), IL-4 (18 kDa), ROR-γ (63 kDa), IL-17 (25 kDa), and β-actin (43 kDa). B.
B.B. B.
B. Data are shown as densitometric ratios with respect to the β-actin value. Results were ex-pressed as the mean ± SD. Five rats per group. * p ≤ 0.05, ** p ≤ 0.01, *** p ≤ 0.001. A AA A A B B B B B
ations in the lipid composition of the tight junction mem-brane microdomains.26 Nonetheless, further studies evalu-ating tight junction proteins in our experimental model would assist in better understanding the mechanisms of intestinal barrier protection during liver damage.
Previous studies show that IL-4 has a potent STAT6-dependent effect on ion flux through the cells of the
intes-tinal epithelium, mucosal permeability and mucin pro-duction.6,8 Our results show that the liver damage, both in early and late phases, produced an increase in levels of GATA-3 and IL-4 in the small intestine. This increase could be attributed to an anti-inflammatory response, that is, the system's attempt to try to counter the high levels of IFN-γ in the local microenvironment.
Ctl 8d 30d
T-bet 62 kDa
GATA-3 50 kDa
ROR-γ 63 kDa
β-actin 43 kDa
Ctl 8d 30d
IFN-γ 25 kDa
IL-4 18 kDa
IL-17 25 kDa
β-actin 43 kDa
3.5 3.0 2.5 2.0 1.5 1.0 0.5 0.0
Ctl 8d 30d
T-bet / β -actin Densitometric ratio * 3.5 3.0 2.5 2.0 1.5 1.0 0.5 0.0
Ctl 8d 30d
IFN-γ / β -actin Densitometric ratio ** ** 3.5 3.0 2.5 2.0 1.5 1.0 0.5 0.0
Ctl 8d 30d
GATA-3 / β -actin Densitometric ratio 3.5 3.0 2.5 2.0 1.5 1.0 0.5 0.0
Ctl 8d 30d
IL-4 / β -actin Densitometric ratio ** * 3.5 3.0 2.5 2.0 1.5 1.0 0.5 0.0
Ctl 8d 30d
ROR- γ / β -actin Densitometric ratio 3.5 3.0 2.5 2.0 1.5 1.0 0.5 0.0
Ctl 8d 30d
On the other hand, our results show a significant in-crease in the levels of ROR-γ and IL-17 in the small in-testine. This may impact in the dysfunction of the
intestinal barrier. Jingjing Meng, et al., 2015, reported in a model of sepsis induced by of CLP (Cecum Ligation and Puncture) that over-expression of intestinal IL-17A
in-Figure 5. Figure 5.Figure 5.
Figure 5.Figure 5. Expression of T-bet, IFN-γ, GATA-3, IL-4, ROR-γ, and IL-17 in colon by Western blot-ting. A. A. A. A. A. Representative blot of control (healthy and sham), 8 and 30 days post-BDL. Observed bands of T-bet (62 kDa), IFN-γ (25 kDa), GATA-3 (50 kDa), 4 (18 kDa), ROR-γ (6GATA-3 kDa), IL-17 (25 kDa), and β-actin (43 kDa). B.B.B.B.B. Data are shown as densitometric ratios with respect to the β-actin value. Results were expressed as the mean ± SD. Five rats per group. * p ≤ 0.05, ** p ≤ 0.01, *** p ≤ 0.001.
A A A A A
B B B B B
Ctl 8d 30d
T-bet 62 kDa
GATA-3 50 kDa
ROR-γ 63 kDa
β-actin 43 kDa
Ctl 8d 30d
IFN-γ 25 kDa
IL-4 18 kDa
IL-17 25 kDa
β-actin 43 kDa
3.5 3.0
2.5
2.0
1.5 1.0
0.5
0.0
Ctl 8d 30d
T-bet /
β
-actin
Densitometric ratio
*** ***
3.5 3.0
2.5
2.0
1.5 1.0
0.5
0.0
Ctl 8d 30d
IFN-γ
/
β
-actin
Densitometric ratio
** *
3.5
3.0
2.5 2.0
1.5
1.0
0.5 0.0
Ctl 8d 30d
GATA-3 /
β
-actin
Densitometric ratio
*
3.5
3.0
2.5 2.0
1.5
1.0
0.5 0.0
Ctl 8d 30d
IL-4 / -actin
Densitometric ratio
**
3.5
3.0
2.5
2.0 1.5
1.0
0.5
0.0
Ctl 8d 30d
ROR-γ
/
β
-actin
Densitometric ratio
** ** 3.5
3.0
2.5
2.0 1.5
1.0
0.5
0.0
Ctl 8d 30d
IL-17 /
β
-actin
duces alterations in the organization of the tight junction proteins, and promoted the dissemination of bacteria.27 In our experimental model, IL-17 may have a dual effect: to induce the elimination of pathogens and, on the other hand, to drive alterations in the integrity of the intestinal epithelium. Without doubt, future studies will be re-quired in order to elucidate the role of IL-17 in the in-testinal homeostasis.
The mucins are proteins with a large number of O-gly-cosylations.28 Our results show a significant increase in the depth of the mucus layer related with an increase in
mu-cin-2, in parallel with liver damage. These data agree with those reported in mouse models and in patients with chronic alcohol-induced liver damage.29,30 However, in the BDL model, mucin-2 has not been previously evaluated.
In this context, considering the chronic inflammation in our experimental model, the resulting increased thick-ness of the intestinal mucus layer does not prevent BT. We must consider that it is probable that there are alterations in the glycosylation of mucin-2, thus potentiating the pen-etration of bacteria across the intestinal barrier and the perpetuation of liver damage.
Figure 6. Figure 6.Figure 6. Figure 6.
Figure 6. Colonic mucus layer thickness by al-cian blue and mucin-2 immunohistochemistry. A.A.A.A.A. Representative images of colon sections of con-trol (healthy and sham), 8 and 30 days post-BDL with alcian blue staining and mucus layer thick-ness analysis. B.B.B.B.B. Representative images of colon sections of control (healthy and sham), 8 and 30 days post-BDL with mucin-2 immunohistochemis-try and intensity analysis. Bars represent 100 μm. Results were expressed as the mean ± SD. Five rats per group. * p ≤ 0.05, ** p ≤ 0.01, *** p ≤ 0.001.
A A A A
A BBBBB
Ctl
8d
30d
Alcian blue Mucin-2
Ctl 8d 30d
100
80
60
40
20
0
μ
m
**
Ctl 8d 30d
5
4
3
2
1
0
Immunostaining score
Figure 7. Figure 7.Figure 7.
Figure 7.Figure 7. Hepatic biochemical tests, fibrosis and inflammation-associated gene expression. A.A.A.A. Biochemical tests: total bilirubin (mg/dL), alanine aminotrans-A. ferase (U/L) and alkaline phosphatase (IU/L) in control, 8 and 30 days post-BDL. B. B. B. B. B. Collagen I (α1) and collagen III (α1) relative expression in liver by 2-ΔΔCT
analysis. C.C.C.C.C. TNF-α, IL-1β and IL-6 relative expression in liver by 2-ΔΔCT analysis. β-2 microglobulin was used as reference gene. Results were expressed as
mean ± SD. Five rats per group * p ≤ 0.05, ** p ≤ 0.01, *** p ≤ 0.001. A
A A A A
B B B B B
C C C C C
a) Total bilirubin
15
10
5
0
mg/dL
Ctl 8d 30d
*** ***
b) Alanine aminotransferase
300
200
100
0
U/L
Ctl 8d 30d
**
c) Alkaline phosphatase
2,000
1,500
1,000
500
0
U/L
Ctl 8d 30d
*
a) Collagen I (α1)
50
45
40
35
30
25 2 1 0
Fold change
Ctl 8d 30d
*** ***
b) Collagen III (α1)
10
8
6
4
2
0
Fold change
Ctl 8d 30d
***
***
a) TNF-α
12
10
8
6
4
2
0
Fold change
Ctl 8d 30d
*** ***
b) IL-1β
6
5
4
3
2
1
0
Fold change
Ctl 8d 30d
c) IL-6
30
20
10
0
Fold change
Ctl 8d 30d
***
Interestingly, in the experimental models of CCl4 and NASH, the liver damage correlates with BT and pro-in-flammatory cytokine production.31,32 Here, in our BDL model, we have shown a hepatic overexpression of
TNF-α and IL-6. Given that these cytokines can be produced af-ter stimulation of the TLR4/LPS pathway, we consider that this pathway might be determinant during the hepatic damage process. Importantly, systemic LPS is remarkably high after 24 h of duct ligation in the BDL model.12
TNF-α has an important role in the perpetuation of HSC acti-vation and ECM synthesis.33 Despite the fact that IL-6 has a controversial role during the hepatic fibrogenesis, this cytokine is a pivotal mediator of ductular reactions in hu-mans with biliary fibrosis;34 moreover, IL-6 produced by Kupffer cells promotes survival and proliferation of HSC, contributing to the exacerbation of the liver fibrosis.35 Thus, in our model, we believe that the proinflammatory process might be tightly associated to the overexpression of collagen I and collagen III at 8 and 30 days after bile duct ligation, which in turn might exacerbate and/or sus-tain the hepatic damage.
Collectively, our data suggest that the intestinal inflam-mation and high thickness mucus layer can facilitate BT and perpetuate liver damage in the BDL model.
FINANCIAL SUPPORT
This work was supported by a grant from Universidad de Guadalajara (REC/747/2016). The authors declare that there is no conflict of interest.
ABBREVIATIONS
• BDL: bile duct ligation. • BT: bacterial translocation. • MLNs: mesenteric lymph nodes.
ACKNOWLEDGEMENTS
The authors are indebted to Dr. Annie Riera Leal for her technical assistance in immunohistochemistry assays.
REFERENCES
1. Taneja SK, Dhiman RK. Prevention and management of
bacte-rial infections in cirrhosis. Int J Hepatol 2011; 2011: 784540.
2. Elshaer D, Begun J. The role of barrier function, autophagy,
and cytokines in maintaining intestinal homeostasis. Semin
Cell Dev Biol 2016.
3. Soufli I, Toumi R, Rafa H, Touil-Boukoffa C. Overview of
cy-tokines and nitric oxide involvement in immuno-pathogenesis
of inflammatory bowel diseases. World J Gastrointest
Phar-macol Ther 2016; 7(3): 353-60.
4. Lazarevic V, Glimcher LH. T-bet in disease. Nat Immunol
2011; 12(7): 597-606.
5. Allen JE, Sutherland TE. Host protective roles of type 2
im-munity: parasite killing and tissue repair, flip sides of the
same coin. Semin Immunol 2014; 26(4): 329-40.
6. Iwashita J, Sato Y, Sugaya H, Takahashi N, Sasaki H, Abe
T. mRNA of MUC2 is stimulated by IL-4, IL-13 or TNF-alpha through a mitogen-activated protein kinase pathway in
hu-man colon cancer cells. Immunol Cell Biol 2003; 81(4):
275-82.
7. Oshima T, Miwa H, Joh T. Changes in the expression of
clau-dins in active ulcerative colitis. J Gastroenterol Hepatol
2008; 23(Suppl. 2): S146-S150.
8. Wisner DM, Harris LR, Green CL, Poritz LS. Opposing
regula-tion of the tight juncregula-tion protein claudin-2 by
interferon-gam-ma and interleukin-4. J Surg Res 2008; 144(1): 1-7.
9. Akdis M, Palomares O, van de Veen W, van Splunter M,
Ak-dis CA. TH17 and TH22 cells: a confusion of antimicrobial
re-sponse with tissue inflammation versus protection. J Allergy
Clin Immunol 2012; 129(6): 1438-49-51.
10. Hirota K, Turner J-E, Villa M, Duarte JH, Demengeot J, Stein-metz OM, Stockinger B. Plasticity of Th17 cells in Peyer's patches is responsible for the induction of T cell-dependent
IgA responses. Nat Immunol 2013; 14(4): 372-9.
11. Etzold S, Juge N. Structural insights into bacterial recognition of intestinal mucins. Curr Opin Struct Biol 2014; 28: 23-31. 12. Fouts DE, Torralba M, Nelson KE, Brenner DA, Schnabl B.
Bacterial translocation and changes in the intestinal
microbi-ome in mouse models of liver disease. J Hepatol 2012;
56(6): 1283-92.
13. Ishak K, Baptista A, Bianchi L, Callea F, De Groote J, Gudat F, Denk H, et al. Histological grading and staging of chronic
hepatitis. J Hepatol 1995; 22(6): 696-9.
14. Chinen T, Komai K, Muto G, Morita R, Inoue N, Yoshida H, Sekiya T, et al. Prostaglandin E2 and SOCS1 have a role in
intestinal immune tolerance. Nat Commun 2011; 2: 190.
15. Erben U, Loddenkemper C, Doerfel K, Spieckermann S, Haller D, Heimesaat MM, Zeitz M, et al. A guide to
histomorphologi-cal evaluation of intestinal inflammation in mouse models. Int
J Clin Exp Pathol 2014; 7(8): 4557.
16. Ogata Y, Nishi M, Nakayama H, Kuwahara T, Ohnishi Y, Ta-shiro S. Role of bile in intestinal barrier function and its inhib-itory effect on bacterial translocation in obstructive jaundice
in rats. J Surg Res 2003; 115(1): 18-23.
17. Eutamene H, Lamine F, Chabo C, Theodorou V, Rochat F, Bergonzelli GE, Corthésy-Theulaz I, et al. Synergy between Lactobacillus paracasei and its bacterial products to coun-teract stress-induced gut permeability and sensitivity
in-crease in rats. J Nutr 2007; 137(8): 1901-7.
18. Wiest R, Lawson M, Geuking M. Pathological bacterial
trans-location in liver cirrhosis. J Hepatol 2014; 60(1): 197-209.
19. Francés R, Zapater P, González-Navajas JM, Muñoz C, Caño R, Moreu R, Pascual S, et al. Bacterial DNA in patients with cirrhosis and noninfected ascites mimics the soluble immune response established in patients with spontaneous bacterial
peritonitis. Hepatology 2008; 47(3): 978-85.
20. Ridlon JM, Alves JM, Hylemon PB, Bajaj JS. Cirrhosis, bile ac-ids and gut microbiota: unraveling a complex relationship. Gut Microbes 2013; 4(5): 382-7.
21. Kordzaya DJ, Goderdzishvili VT. Bacterial translocation in
obstructive jaundice in rats: role of mucosal lacteals. Eur J
Surg 2000; 166(5): 367-74.
22. Cui X, Shan X, Qian J, Ji Q, Wang L, Wang X, Li M, et al. The suppressor of cytokine signaling SOCS1 promotes apopto-sis of intestinal epithelial cells via p53 signaling in Crohn's
disease. Exp Mol Pathol 2016; 101(1): 1-11.
23. Cortez VS, Colonna M. Diversity and function of group 1
24. Intlekofer AM, Takemoto N, Wherry EJ, Longworth SA, Northrup JT, Palanivel VR, Mullen A, et al. Effector and mem-ory CD8+ T cell fate coupled by T-bet and eomesodermin. Nat Immunol 2005; 6(12): 1236-44.
25. Harmon C, Robinson MW, Fahey R, Whelan S, Houlihan DD, Geoghegan J, O'Farrelly C, et al. Tissue-resident Eomes(hi) T-bet(lo) CD56(bright) NK cells with reduced
proinflammato-ry potential are enriched in the adult human liver. Eur J
Im-munol 2016; 46(9): 2111-20.
26. Li Q, Zhang Q, Wang M, Zhao S, Ma J, Luo N, Li N, et al. In-terferon-gamma and tumor necrosis factor-alpha disrupt epi-thelial barrier function by altering lipid composition in
membrane microdomains of tight junction. Clin Immunol
Or-lando Fla 2008; 126(1): 67-80.
27. Meng J, Banerjee S, Li D, Sindberg GM, Wang F, Ma J, Roy S. Opioid Exacerbation of Gram-positive sepsis, induced by Gut Microbial Modulation, is Rescued by IL-17A
Neutraliza-tion. Sci Rep 2015; 5: 10918.
28. Bergstrom KSB, Xia L. Mucin-type O-glycans and their roles
in intestinal homeostasis. Glycobiology 2013; 23(9): 1026-37.
29. Hartmann P, Chen P, Wang HJ, Wang L, McCole DF, Brandl K, Stärkel P, et al. Deficiency of intestinal mucin-2
amelio-rates experimental alcoholic liver disease in mice.
Hepatolo-gy 2013; 58(1): 108-19.
30. Grewal RK, Mahmood A. Ethanol induced changes in
glyco-sylation of mucins in rat intestine. Ann Gastroenterol 2009;
22(3): 178-83.
31. Gäbele E, Dostert K, Hofmann C, Wiest R, Schölmerich J, Hel-lerbrand C, et al. DSS induced colitis increases portal LPS
levels and enhances hepatic inflammation and fibrogenesis
in experimental NASH. J Hepatol 2011; 55(6): 1391-9.
32. Zapater P, Gómez-Hurtado I, Peiró G, González-Navajas JM, García I, Giménez P, et al. Beta-Adrenergic Receptor 1 Se-lective Antagonism Inhibits Norepinephrine-Mediated TNF-Al-pha Downregulation in Experimental Liver Cirrhosis. Jacobs
R (Ed.). PLoS ONE 2012; 7(8): e43371.
33. Knittel T, Müller L, Saile B, Ramadori G. Effect of tumour necrosis factor-alpha on proliferation, activation and protein
synthesis of rat hepatic stellate cells. J Hepatol 1997;
27(6): 1067-80.
34. Dranoff JA, Wells RG. Portal fibroblasts: Underappreciated
mediators of biliary fibrosis. Hepatol Baltim Md 2010; 51(4):
1438-44.
35. Nieto N. Oxidative-stress and IL-6 mediate the fibrogenic
ef-fects of [corrected] Kupffer cells on stellate cells. Hepatol
Baltim Md 2006; 44(6): 1487-501.
Correspondence and reprint request:
Miriam R. Bueno-Topete, M.D., Ph.D. Instituto de Investigación en Enfermedades Crónico Degenerativas, Departamento de Biología Molecular y Genómica, Centro Universitario de Ciencias de la Salud,
Universidad de Guadalajara,
Sierra Mojada, No. 950, Col. Independencia, Z.P. 44340. Guadalajara, Jalisco, Mexico.