HCBP6 Is Involved in the
Development of Hepatic Steatosis
Induced by High-Fat Diet and CCL4 in Rats
Yong-Ping Zheng,* Xian-Yang Zhong,* Yu-Shu Huang,* Can-Bin Zheng** * Department of Gastroenterology, Shantou Central Hospital, Affiliated Hospital of Sun Yat-Sen University, Shantou, Guangdong province, China. ** Department of Endocrine and Metabolic Diseases, 1st Affiliated Hospital of Shantou University Medical College, Shantou, Guangdong province, China.
May-June, Vol. 17 No. 3, 2018: 511-518
INTRODUCTION
Hepatic steatosis is characterized by lipid dysregulation and fat accumulation in the liver. It is a major complica-tion of obesity, hyperlipidemia, insulin resistance (IR), and non-alcoholic fatty liver disease (NAFLD).1 If un-treated, benign steatosis can gradually advance to steato-hepatitis, fibrosis, cirrhosis, and even liver cancer.2,3 Many risk factors can promote hepatic steatosis through differ-ent mechanisms, such as metabolic diseases, alcohol, virus, drugs, and nutritional disorders, with IR being the most common feature leading to hepatic lipid accumulation.4 Multiple lines of evidence have demonstrated that various genes, including sterol regulatory element binding protein 1c (SREBP-1c), FoxO1, AKT2, and PPARγ, are involved in IR-induced hepatic steatosis.5
Hepatitis C virus core-binding protein 6(HCBP6) was originally identified as a hepatitis C virus (HCV) core-binding protein.6 HCV core protein has been shown to play an important role in hepatic steatosis.7 Researches have proved that HCBP6 mRNA and protein levels exhib-ited time- and dose-dependent increases in a cellular model of lipid-overload hepatic steatosis in vitro and HCBP6 was found as a negative regulator and sensor of in-tracellular TG levels.8 Still, the biological function of HCBP6 in hepatic steatosis is not fully understood. Whether HCBP6 is involved in the development of he-patic steatosis in vivo is yet to be investigated.
SREBP-1c belongs to the basic helix-loop-helix-leu-cine zipper family of transcription factors and plays a key role in regulating fatty acid synthesis and TG accumula-tion in the liver.9 HCV core protein induces TG
accumu-The Official Journal of the Mexican Association of Hepatology, the Latin-American Association for Study of the Liver and
the Canadian Association for the Study of the Liver
Manuscript received: Manuscript received:Manuscript received:
Manuscript received:Manuscript received: July 16, 2017. Manuscript accepted:Manuscript accepted:Manuscript accepted:Manuscript accepted:Manuscript accepted: September 12, 2017.
DOI:10.5604/01.3001.0011.7396
A B S T R A C T A B S T R A C T A B S T R A C T A B S T R A C T A B S T R A C T
Introduction and aim. Introduction and aim.Introduction and aim. Introduction and aim.
Introduction and aim. Hepatitis C virus binding protein 6 (HCBP6) was previously found to be an hepatitis C virus core-binding protein, its biological function remains unclear. Our research aims to investigate the role of HCBP6 in the development of he-patic steatosis induced by high-fat diet and carbon tetrachloride (CCL4) in rats. Material and methods. Material and methods. Material and methods. Material and methods. Material and methods. Eighteen Wistar rats were randomly allocated into 3 groups: control group, model group 1, and model group 2. The control group was treated with a stand-ard diet for 5 weeks. Model groups were treated with high-fat diet and CCL4 injection twice a week for 3 weeks in Group 1 and 5 weeks in Group 2, respectively. After the intervention, hepatic steatosis was observed by histological staining with hematoxylin and eosin (H&E) and Oil Red O staining. Serum levels of alanine aminotransferase (ALT), aspartate aminotransferase (AST), total cho-lesterol (TC), and triglycerides (TGs) were measured. The TG content in liver homogenates was evaluated. Expressions of HCBP6 and SREBP-1c were determined by immunofluorescence, quantitative real-time PCR, and Western blot analysis. Results.Results.Results.Results.Results. Hepatic steatosis was successfully induced in model groups. ALT, AST, TC, and TGs elevated in model groups compared with those in con-trol group (P < 0.05). Hepatic steatosis induced by high-fat diet and CCL4 resulted in low expression of HCBP6 and high expression of SREBP-1c in the liver of rats (P < 0.05). Conclusion. Conclusion. Conclusion. Conclusion. Conclusion. HCBP6 is involved in the development of high-fat diet- and CCL4-in-duced hepatic steatosis and related negatively with SREBP-1c.
Key words. Key words.Key words. Key words.
lation by stimulating SREBP-1c gene expression and HCBP6 binds the HCV core protein.10 Whether HCBP6 is involved in SREBP1c-FASN-mediated TG accumula-tion has yet to be determined. Here, we demonstrate that HCBP6 is involved in the development of hepatic steato-sis induced by high-fat diet and carbon tetrachloride (CCL4) in rats and HCBP6 is negatively related to SREBP-1c. The results offer new insights into the patho-physiology of hepatic steatosis.
MATERIAL AND METHODS
Animals and treatment schedules
Wistar rats, weighing 190-210 g, were provided by labo-ratory center, Shantou University Medical College. A stand-ard laboratory diet and water were available ad libitum. The animal room was maintained humidity with a 12h (7:00 a.m. -7:00 p.m.) light/dark cycle. After 1 week on the basal diet, 18 animals were randomly allocated into 3 groups: Group 1, Group 2, and control group. Each group contained 6 rats. Rats in model groups received a high-fat diet and subcu-taneous injection of 30% CCL4 in liquid paraffin oil (0.2 mL/100 g body weight) twice a week for 3 weeks (Group 1) and 5 weeks (Group 2) respectively. Rats in the control group received subcutaneous injection of normal saline and normal food feed instead. After 3 weeks (Group 1) or 5 weeks (Group 2 and control group), rats were fasted overnight and sacrificed. The serum was separated for further investigation. Rat livers were weighed and frozen or fixed in 10% formalin. All experiment protocols were approved by ethics committee of Shantou Central Hospital. All animals received humane care according to the criteria outlined in the “Guide for the Care and Use of Laboratory Animals” prepared by the National Academy of Sciences and published by the National Institutes of Health (NIH publication 86-23 revised 1985).
Evaluation of liver pathology
A histological study was performed following a midline laparotomy to remove the left lateral lobe of rat liver. Livers were harvested at the end of the experiment. Weighed, im-mediately placed in 10% buffered formalin, and embedded in paraffin. Liver sections were stained with hematoxylin and eosin (H&E) using standard technique. To further con-firm lipid droplet accumulation, frozen liver sections were stained with Oil Red O. Investigators were blinded to the group identity of each section, and biopsies were classified into four categories depending on fat accumulation using a previously established method as follows: Grade 0, no fat observed in the liver; Grade 1, < 33% of hepatocytes tained fat vacuoles; Grade 2, 33-66% of hepatocytes
tained fat vacuoles; Grade 3, > 66% of hepatocytes con-tained fat vacuoles.11
Biochemical determinations
After being treated for 3 weeks (Group 1) or 5 weeks (Group 2 and control group), rats were fasted overnight and serum levels of alanine aminotransferase (ALT), aspar-tate aminotransferase (AST), total cholesterol (TC), and triglycerides (TGs) were measured with an automatic bio-chemical analyzer.
Evaluations of TC and TGs in liver tissues
Exactly 3 ml of ethanol - acetone (1:1) was added to the liver tissues (200 mg), which were then homogenized in an ice bath and mixed thoroughly at 4°C overnight. After 24 h, the liver tissues were centrifuged at 3000 rpm and 4 °C for 20 min. Subsequently, the supernatant was trans-ferred to a new tube, then TC and TGs were measured based on the instructions on TC and TG assay kit (Jiancheng Institute of Bio Engineering, Nanjing, China) using a colorimetric method.
Immunofluorescence and confocal imaging
RNA analysis
Total RNA was extracted using TRIzol® Reagent (Inv-itrogen, Carlsbad, CA, USA) according to the manufactur-er’s protocol. 1.0 μg of total RNA was used as a template for first strand cDNA synthesis using PrimerScript® RT Master Mix kit (TaKaRa, Tokyo, Japan). Real-time PCR was performed using SYBR® Premix Ex TaqTM kit (TaKaRa, Tokyo, Japan) on LightCycler 480 Realtime PCR System (Roche, USA). The sequences of primers used in this study were as follows (forward and reverse): HCBP6, 5'-CTT TTC GGG CAT GAG AGT CG-3' and 5'-GAA TCG TCA GCT GCT CCT TG -3'; SREBP1c, 5'-CAC TTC CAG CTA GAC CCC AA-3' and 5'-GGT GAG AGC CTT GAG ACA GT-3'; GAPDH, 5'-GTT ACC AGG GCT GCC TTC TC-3' and 5'- GAT GGT GAT GGG TTT CCC GT-3'.
Western blotting analysis
The samples for Western blots analysis were liver lysates, which were incubated in RIPA lysis buffer: 50 mM Tris, 150 mM NaCl, 1% Triton X-100, 1% sodium deoxycholate, 0.1% SDS, 2 mM EDTA, and protease in-hibitors (pH 7.4). Protein content of the samples was measured by BCA Protein Assay Kit (Thermo, Rockford, IL, USA). Proteins (40 μg per sample) were separated by SDS-PAGE with 12% polyacrylamide gels and trans-ferred onto PVDF membranes. The blots were blocked with a solution of 5% (wt / vol) skim milk in TBS con-taining 0.1% Tween-20 for 1 h at room temperature and
incubated overnight at 4°C with primary goat anti-rat HCBP6 antibody (1:800, Santa Cruz, Santa Cruz, CA, USA), rabbit anti-rat SREBP-1c antibody (1:1000, Santa cruz, Santa Cruz, CA, USA), and rabbit anti-rat β-actin antibody (1:2000, Cell Signaling Technology, Danvers, MA, USA). After rinsed in TBS (pH 7.8) containing 0.1% Tween-20, the blots were incubated with horseradish peroxidase-conjugated antibody (1:2000, Cell Signaling Technology, Danvers, MA, USA) for 1 h. HCBP6, SREBP-1c, and β-actin proteins were detected by en-hanced chemiluminescence system. The integrated in-tensity for the protein bands was determined by scanning densitometry and analyzed by Glyko BandScan 5.0. The data were analyzed using relative intensity to the consti-tutive marker, β-actin.
Statistical analysis
Differences among groups were examined by one-way ANOVA followed by Tukey-Kramer multiple comparison tests. Values are expressed as the mean ± standard devia-tion. A value of P < 0.05 was considered statistically sig-nificant.
RESULTS
Characteristics of animals
A total of 18 rats were investigated in the study. The ini-tial body weights of the male and female rats were similar (200 ± 10 g). At the end of the intervention, there was a
Figure 1. Figure 1.Figure 1. Figure 1.
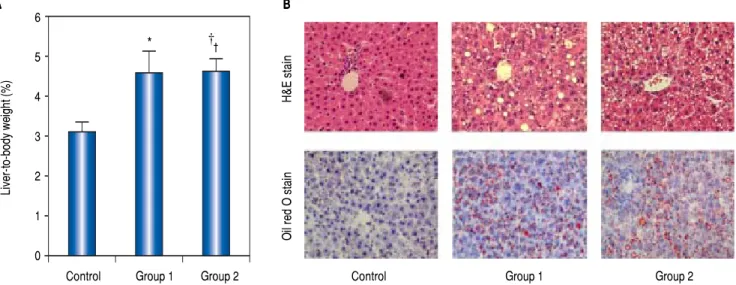
Figure 1. Weight and pathological change of livers from rats induced by high-fat diet and carbon tetrachloride (CCL4). A.A.A.A.A. Percentage of liver-to-body weight was shown in this panel. The percentage of liver-to-body weight from control group was significantly lower than that from Group 1 and Group 2 (*P < 0.05 compared with Group 1; † P < 0.05 compared with Group 2; n = 6). B.B.B.B. Pathological observation of hepatic steatosis induced by high-fat diet and CCL4. Liver sections fromB. control group, Group 1, and Group 2 were stained with H&E and Oil Red O. Original magnification: 200.
A A A A
A BBBBB
†
6
5
4
3
2
1
0
Liver-to-body weight (%)
Control Group 1 Group 2 Control Group 1 Group 2
Oil red O stain
H&E
stain
significant difference in the percentage of liver-to-body weight between control group and model groups, Group 1 (4.56% ± 0.56%), Group 2 (4.63% ± 0.30%) vs. control group (3.12% ± 0.23%), P < 0.05 (Figure 1A).
Hepatic architecture
As H&E staining showed, histological analysis of the hepatic fragments in the control group exhibited well-pre-served architecture with characteristic hepatocytes dis-tributed homogenously throughout the hepatic parenchyma. Group 1 and Group 2 exhibited significant al-terations, including tissue disorganization with macro-and micro-vesicular steatosis in the cytoplasm of the hepa-tocytes, as well as the presence of multiple foci of inflam-mable infiltrates, being prominent in rats of Group 2 (Figure 1B). Quantifying the fatty infiltration by a previ-ously published scoring system, the mean fatty infiltration in the treated Group 1 and Group 2 were both Grade 2 while the control group was quantified as Grade 0. Oil-Red-O stain displayed abundant accumulation of fat drop-lets in hepatocytes from rats of Group 1 and Group 2 (Figure 1B). These liver histology results suggested that hepatic steatosis was successfully induced in model groups.
Biochemical determinations and liver TG content
The serum levels of ALT, AST, TC, and TGs in the control group were 53.00 ± 15.06 U/L, 90.75 ± 24.00 U/L, 1.42 ± 0.36 mmol/L, and 0.82 ± 0.94 mmol/L. While the serum levels of ALT, AST, TC, and TGs were 101.25 ± 19.00 U/L, 137.00 ± 35.79 U/L, 2.45 ± 0.35 mmol/L, and 1.09 ± 0.12 mmol/L in Group 1 and 127.00 ± 20.45 U/L, 147.25 ± 27.40 U/L, 2.03 ± 0.20 mmol/L, and 1.03 ± 0.12 mmol/L in Group 2. The Group 1 and Group 2 rats showed significant serum elevations of ALT, AST, TC, and TGs compared to the control group. In liver tissues, the levels of TC and TGs were 1.06 ± 0.18 mg/g and 1.75 ± 0.31 mg/g in the control group, 2.58 ± 0.21 mg/g and 4.35 ± 0.39 in Group 1, and 2.93 ± 0.32 mg/g and 4.41 ± 0.62 mg/g in Group 2 respectively. Similarly, liver TC and
TGs elevated remarkably in model groups compared with the control group (n = 6, P < 0.05); (Table 1).
Immunofluorescence evaluation of HCBP6 and SREBP-1c
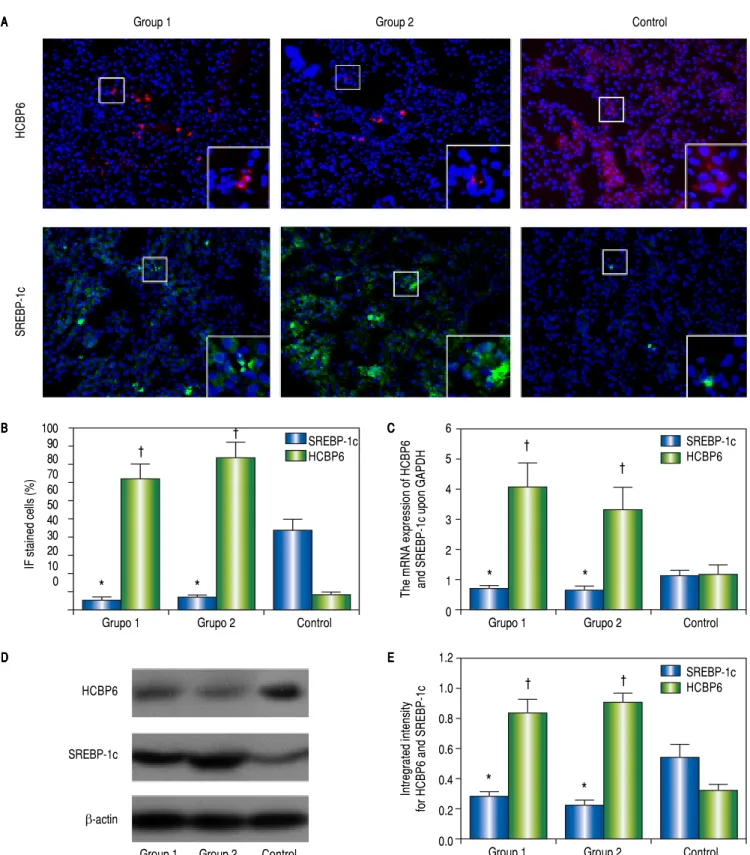
Immunofluorescence staining was performed to detect the HCBP6 and SREBP-1c expression in the liver tissues of rats separated from Group 1, Group 2, and control group (Figure 2A). The percentages of HCBP6 positive cells for Group 1, Group 2, and control group were 5.22% ± 1.74%, 6.93% ± 1.04%, and 43.85% ± 5.89%, respective-ly. While the percentages of SREBP-1c positive cells for Group 1, Group 2, and control group were 72.15% ± 8.24%, 83.61% ± 8.52%, and 8.84% ± 0.91%, respectively. It was significantly lower for HCBP6 expression and higher for SREBP-1c expression in hepatocytes of Group 1 and Group 2 rats, compared with control rats (n = 6, P < 0.05) (Figure 2B). But there was no significant difference be-tween Group 1 and Group 2 rats.
mRNA expressions of HCBP6 and SREBP-1c
The mRNA expressions of HCBP6 and SREBP-1c in hepatocytes of Group 1, Group 2, and control rats were shown in table 2 and figure 2C. Compared with control rats, the mRNA expression of HCBP6 was significantly lower in hepatocytes of Group 1 and Group 2 rats (n = 6, P < 0.05). Conversely, a significantly higher expression of SREBP-1c was detected in hepatocytes of Group 1 and Group 2 rats than that in hepatocytes of control rats (n = 6, P < 0.05).
Protein expressions of HCBP6 and SREBP-1c
Protein expressions of the HCBP6 and SREBP-1c were analyzed through western blotting on the liver sam-ples. Compared with control rats, the protein expression of HCBP6 was decreased in hepatocytes of Group 1 and Group 2 rats. While SREBP-1c protein expression of hepatocytes in both Group 1 and Group 2 rats was signifi-cantly higher than that in control rats (n = 6, P < 0.05) (Figures 2D and 2E, and Table 2).
Table 1. ALT, AST, TC, and TG levels in serum and TC and TG levels in liver tissues.
ALT (U/L) AST (U/L) TC (mmol/L) TG (mmol/L) TC (mg/g) TG (mg/g)
(serum) (serum) (serum) (serum) (liver tissue) (liver tissue)
Control 53.00 ± 15.06 90.75 ± 24.00 1.42± 0.36 0.82 ± 0.94 1.06±0.18 1.75 ± 0.31
Group 1 101.25 ± 19.00a 137.00 ± 35.79a 2.45± 0.35a 1.09 ± 0.12a 2.58± 0.21a 4.35 ± 0.39a
Group 2 127.00 ± 20.45a 147.25 ± 27.40a 2.03± 0.20a 1.03 ± 0.12a 2.93± 0.32a 4.41 ± 0.62a
Figure 2. Figure 2.Figure 2.
Figure 2.Figure 2. Expressions of HCBP6 and SREBP-1c in hepatocytes of Group 1, Group 2, and control rats. A. A. A. A. A. Immunofluorescence staining of HCBP6 and SREBP-1c in hepatocytes (Original magnification: 100). Magnified images are shown in the bottom right of each section. B. B. B. B. B. Comparisons of percentages of HCBP6 + and SREBP-1c + hepatocytes (*P < 0.05 compared for HCBP6 with control; † P < 0.05 compared for SREBP-1c with control; n = 6). C.C.C.C.C. Compari-sons of HCBP6 and SREBP-1c mRNA expressions in hepatocytes (*P < 0.05 compared for HCBP6 with control; † P < 0.05 compared for SREBP-1c with con-trol; n = 6). D.D.D.D.D. Protein expressions of HCBP6 and SRBP-1c in hepatocytes detected by Western blot analysis. E.E.E.E.E. Comparisons of integrated intensity for HCBP6 and SREBP-1c (*P < 0.05 compared for HCBP6 with control; † P < 0.05 compared for SREBP-1c with control; n = 6).
100 90 80 70 60 50 40 30 20 10 0
IF stained cells (%)
Grupo 1 Grupo 2 Control
6
5
4
3
2
1
0 The mRNA expression of HCBP6 and SREBP-1c upon GAPDH
HCBP6
SREBP-1c
β-actin
Grupo 1 Grupo 2 Control
1.2
1.0
0.8
0.6
0.4
0.2
0.0
Intregrated intensity
for HCBP6 and SREBP-1c
Group 1 Group 2 Control
SREBP-1c HCBP6
SREBP-1c
HCBP6
Group 1 Group 2 Control
*
*
†
† A
AA AA
B BB
BB CCCCC
D DD
DD EEEEE
*
*
†
†
*
*
† †
SREBP-1c HCBP6
SREBP-1c HCBP6
DISCUSSION
NAFLD is an increasing prevalent health problem that ranges from simple fatty infiltration of the liver parenchy-ma (non-alcoholic simple fatty liver, NAFL) to steatosis with inflammation and hepatocellular ballooning (non-al-coholic steatohepatitis, NASH) and ultimately cirrhosi.12 It is estimated that 1 billion people currently suffer from some form of NAFLD.13 Liver steatosis, marked as the first stage of NAFLD, is closely associated with obesity, type 2 diabetes mellitus, IR, and drug-induced liver inju-ry.14 Steatosis is considered as a benign reversible event, while NASH has a potential to lead to cirrhosis and hepa-tocellular carcinoma. As much as 10-25% of liver steatosis patients progress to NASH and 2-3% of NASH patients develop into liver cancer.15,16 Hence, liver steatosis is of major concern for worldwide health.
Pathologically, hepatic steatosis is featured by the accu-mulation of fat in at least 5% of hepatocytes. Hepatic stea-tosis occurs when the production and removal of intrahepatic TGs become unbalanced due to reduced fatty acid oxidation as well as increased de novo lipogenesis. Maintaining TG homeostasis is essential for normal liver function.17,18 Many risk factors can promote hepatic stea-tosis through different mechanisms, such as metabolic dis-eases, alcohol, virus, drugs, and nutritional disorders, with IR being the most common feature leading to hepatic lipid accumulation.4 Various genes, including SREBP-1c, LXR, AKT2, and FASN, have been demonstrated to be involved in IR-induced hepatic steatosis.19-22
It has classically been found that HCV, especially geno-type 3, exerts direct metabolic effects which leads to liver steatosis.23 HCV core protein plays an important role in the development of hepatic steatosis in HCV infection.10 Researches have demonstrated that HCV core is localized on the endoplasmic reticulum and on lipid droplets which suggests a relationship between the expression of the HCV core protein and cellular lipid metabolism.7 HCBP6 has been identified as a HCV core-binding protein and shown to inhibit HCV core protein transactivation
ef-fects.6,24 It has also been found to regulate the transcrip-tional activity of the alpha chain of nascent polypeptide-as-sociated complex promoter and the expression of genes involved in cell proliferation, signal transduction, growth, and differentiation.25,26 Studies have revealed that HCBP6 is a negative regulator and sensor of intracellular TG levels in vitro and HCPB6 expression is induced by TGs in a time- and dose-dependent manner.8
SREBP-1c belongs to the basic helix-loop-helix-leu-cine zipper family of transcription factors and plays a key role in regulating fatty acid synthesis and TG accumula-tion in the liver.9 Three mammalian SREBP isoforms (SREBP-1a, SREBP-1c, and SREBP-2) are encoded by two genes, SREBF1 and SREBF2, and have distinct but overlapping functions in lipogenic gene regulation. Previ-ous studies have reported that SREBP-1a activates fatty acid and cholesterol synthesis. SREBP-1c activates fatty acid and TG synthesis, and SREBP-2 activates cholesterol synthesis and uptake.27 SREBP-1c increases the transcrip-tional activity of genes involved in hepatic fatty acid syn-thesis (including FASN, ACC, and SCD), enhances transcription of genes required for fatty acid synthesis, and predominates in the liver.28,29 Alterations to the SREBP-1c-FASN pathway can result in liver steatosis and type 2 diabetes.30
Various animal models of NAFLD have been devel-oped involving genetic and diet manipulation, treatment with toxins as well as combination models.31 In our study, we established the model of liver steatosis by a high-fat diet and CCL4 subcutaneous injection. This method ac-cords with the pattern of NAFLD development in some degree and has been extensively studied.32-35 The patholo-gy and liver function study revealed that hepatic steatosis was successfully induced in model groups. To further ex-plore whether HCBP6 was involved with a time-depend-ent manner, we designed model groups treated for 3 weeks and 5 weeks. Two groups both exhibited fatty infiltration of quantifying Grade 2 while Group 2 represented more serious steatohepatitis.11 However, we did not include the investigation on the change of HCBP6 within clear stages
´
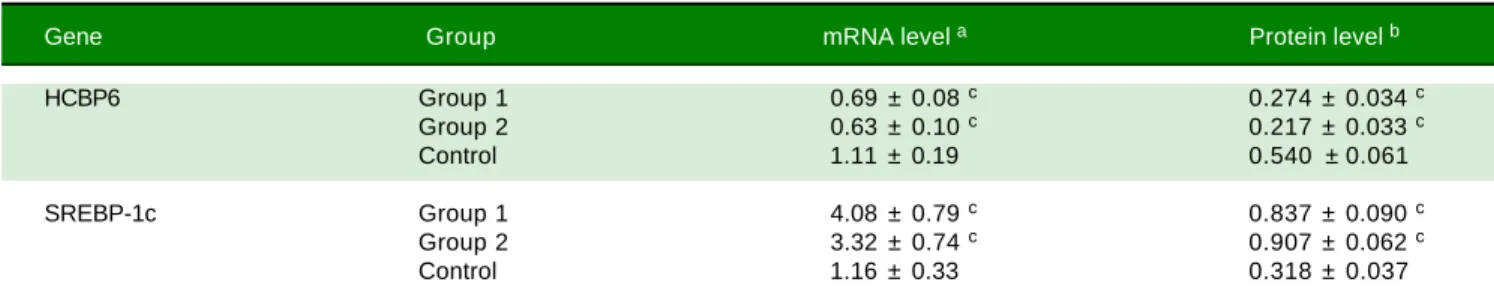
Table 2. HCBP6 and SREBP-1c expressions in hepatocytes of Group 1, Group 2, and control rats.
Gene Group mRNA level a Protein level b
HCBP6 Group 1 0.69 ± 0.08 c 0.274 ± 0.034 c
Group 2 0.63 ± 0.10 c 0.217 ± 0.033 c
Control 1.11 ± 0.19 0.540 ± 0.061
SREBP-1c Group 1 4.08 ± 0.79 c 0.837 ± 0.090 c
Group 2 3.32 ± 0.74 c 0.907 ± 0.062 c
Control 1.16 ± 0.33 0.318 ± 0.037
a mRNA abundance was analyzed using the 2-ΔΔCt Ct method with GAPDH as the constitutive marker. b The protein expression was analyzed using
of NAFLD to NASH, even to fibrosis, which was worth our further investigation.
Previous studies have demonstrated that HCV core pro-tein induced TG accumulation by stimulating SREBP-1c gene expression and HCBP6 negatively regulated intracel-lular TG levels in hepatoma cell lines via the SREBP-1c/ FASN Pathway in vitro.8,10 The results implied that HCBP6 may impact TG metabolism through the regulation of SREBP-1c in vivo. In the current study, we investigated the in vivo change and revealed HCBP6 expression was down-regulated in hepatic steatosis in rats, consistent with in vitro observations by Gao, et al.8 Our experimental results showed the expression of HCBP6 was significantly decreased in liv-ers of rats induced by high-fat diet and CCL4. It continued to maintain at a lower level as treating time prolonged. All above showed HCBP6 was associated with the develop-ment of hepatic steatosis in rats. Besides, as a crucial tran-scription factor in hepatic fatty acid synthesis, SREBP-1c expression was up-regulated in the model groups, negative-ly correlated with HCBP6. So we speculated that the lower expression of HCBP6 may cause the higher expression of SREBP-1c and activate the SREBP-1c signal pathway, re-sulting in the increase of fatty acid and TG synthesis and the dysfunction of lipid metabolism in the development of he-patic steatosis. This study offered new insights into the pathophysiology of hepatic steatosis. On the other hand, it also suggested that HCBP6 may be used as a sensitive indi-cator for NAFLD occurrence and development. It may be an efficient way to prevent and treat NAFLD by promoting the expression of HCBP6.
In conclusion, we demonstrate that HCBP6 is involved in the development of hepatic steatosis induced by high-fat diet and CCL4 in rats and HCBP6 is negatively related to SREBP-1c. The results offer new insights into the pathophysiology of hepatic steatosis. Thus, our results suggest that HCBP6 may represent a new potential thera-peutic target in lipid metabolism and fatty liver manage-ment.
ABBREVIATIONS
• ALT: alanine aminotransferase. • AST: aspartate aminotransferase. • CCL4: carbon tetrachloride. • H&E: hematoxylin and eosin.
• HCBP6: hepatitis C virus core-binding protein 6. • HCV: hepatitis C virus.
• IR: insulin resistance.
• NAFL: non-alcoholic simple fatty liver. • NAFLD: non-alcoholic fatty liver disease. • NASH: non-alcoholic steatohepatitis.
• SREBP-1c: sterol regulatory element binding protein 1c. • TBS: tris-buffered saline.
• TC: total cholesterol. • TG: triglyceride.
ACKNOWLEDGEMENTS
There is no conflict of interest to be declared. This study was supported by Science Foundation of Guang-dong province for traditional Chinese medicine research (No. 20131053).
REFERENCES
1. Bradbury MW. Lipid metabolism and liver inflammation. I. He-patic fatty acid uptake: possible role in steatosis. Am J Physiol Gastrointest Liver Physiol 2006; 290: 194-8. 2. Hashimoto E, Yatsuji S, Tobari M, Taniai M, Torii N,
Tokushige K, Shiratori K. Hepatocellular carcinoma in pa-tients with nonalcoholic steatohepatitis. J Gastroenterol 2009; 44: 589-95.
3. Ascha MS, Hanouneh IA, Lopez R, Tamimi TA, Feldstein AF, Zein NN. The incidence and risk factors of hepatocellular carcinoma in patients with nonalcoholic steatohepatitis. Hepatology 2010; 51: 1972-8.
4. Choi SH, Ginsberg HN. Increased very low density lipopro-tein (VLDL) secretion, hepatic steatosis, and insulin resist-ance. Trends Endocrinol Metab 2011; 22: 353-63.
5. Siri P, Candela N, Zhang YL, Ko C, Eusufzai S, Ginsberg HN, Huang LS. Post-transcriptional stimulation of the assembly and secretion of triglyceride-rich apolipoprotein B lipopro-teins in a mouse with selective deficiency of brown adipose tissue, obesity, and insulin resistance. J Biol Chem 2001; 276: 46064-72.
6. Li K, Wang L, Cheng J, Zhang L, Duan H, LuY, Yang J, et al. Screening and cloning gene of hepatocyte protein interact-ing with hepatitis C virus core protein. Zhonghua Shi Yan He Lin Chuang Bing Du Xue Za Zhi 2002; 16: 351-3. 7. Barba G, Harper F, Harada T, Kohara M, Goulinet S,
Mat-suura Y, Eder G, et al. Hepatitis C virus core protein shows a cytoplasmic localization and associates to cel-lular lipid storage droplets. Proc Natl Acad Sci USA 1997; 94: 1200-5.
8. Gao LL, Li M, Wang Q, Liu SA, Zhang JQ, Cheng J. HCBP6 Modulates Triglyceride Homeostasis in Hepatocytes Via the SREBP1c/FASN Pathway. J Cellular Biochem 2015; 116: 2375-84.
9. Brown MS, Goldstein JL. The SREBP pathway: Regulation of cholesterol metabolism by proteolysis of a membrane-bound transcription factor. Cell 1997; 89: 331-40.
10. Kim KH, Hong SP, Kim K, Park MJ, Kim KJ, Cheong J. HCV core protein induces hepatic lipid accumulation by activating SREBP1 and PPAR gamma. Biochem Biophys Res Commun 2007; 355: 883-8.
11. Brunt EM, Janney CG, Di Bisceglie AM, Neuschwander-Tetri BA, Bacon BR. Nonalcoholic steatohepatitis: a proposal for grading and staging the histological lesions. Am J Gastroen-terol 1999; 94: 2467-74.
12. Ratziu V, Bellentani S, Cortez-Pinto H, Day C, Marchesini G. A position statement on NAFLD/NASH based on the EASL 2009 special conference. J Hepatol 2010; 53: 372-84. 13. Loomba R, Sanyal AJ. The global NAFLD epidemic. Nat Rev
Gastroenterol Hepatol 2013; 10: 686-90.
14. Vernon G, Baranova A, Younossi ZM. Systematic review: the epidemiology and natural history of non-alcoholic fatty
liver disease and non-alcoholic steatohepatitis in adults. Ali-ment Pharmacol Ther 2011; 34: 274-85.
15. Milic S, Stimac D. Nonalcoholic fatty liver disease/steatohep-atitis: epidemiology, pathogenesis, clinical presentation and treatment. Dig Dis 2012; 30: 158-62.
16. Schuppan D, Schattenberg JM. Non-alcoholic steatohepati-tis: pathogenesis and novel therapeutic approaches. J Gas-troenterol Hepatol 2013; 28: 68-76.
17. Fabbrini E, Sullivan S, Klein S. Obesity and nonalcoholic fatty liver disease: Biochemical, metabolic, and clinical implica-tions. Hepatology 2010; 51: 679-89.
18. Koo SH. Nonalcoholic fatty liver disease: Molecular mecha-nisms for the hepatic steatosis. Clin Mol Hepatol 2013; 19: 210-5.
19. Horton JD, Goldstein JL, Brown MS. SREBPs: Activators of the complete program of cholesterol and fatty acid synthesis in the liver. J Clin Invest 2002; 109: 1125-31.
20. Cha JY, Repa JJ. The liver X receptor (LXR) and hepatic lipogenesis. The carbohydrate-response element-binding protein is a target gene of LXR. J Biol Chem 2007; 282: 743-51.
21. Ono H, Shimano H, Katagiri H, Yahagi N, Sakoda H, Onishi Y, Anai M, et al. Hepatic Akt activation induces marked hypogly-cemia, hepatomegaly, and hypertriglyceridemia with sterol regulatory element binding protein involvement. Diabetes 2003; 52: 2905-13.
22. Postic C, Girard J. Contribution of de novo fatty acid synthe-sis to hepatic steatosynthe-sis and insulin resynthe-sistance: Lessons from genetically engineered mice. J Clin Invest 2008; 118: 829-38.
23. Woreta TA, Sutcliffe CG, Mehta SH, Brown TT, Higgins Y, Thomas DL, Torbenson MS, et al. Incidence and risk factors for steatosis progression in adults coinfected with HIV and hepatitis C virus. Gastroenterology 2011; 140: 809-17. 24. Liu M, Liu Y, Cheng J, Zhang SL, Wang L, Shao Q, Zhang J,
et al. Transactivating effect of hepatitis C virus core protein: a suppression subtractive hybridization study. World J Gastroenterol 2004; 10: 1746-9.
25. Yang Z, Liu Z, Cheng J, Wang JJ, Hong Y, Zhang S. Up-reg-ulating effect of human hepatitis C virus core protein-binding protein 6 on NACA promoter. World Chin J Digestol 2003; 11: 959-62.
26. Wang L, Cheng J, Li K, Hong Y. Identification and evaluation promoter sequence and the transcription activation of Hcbp6
interaction with core protein of hepatitis C virus. Zhonghua Gan Zang Bing Za Zhi 2006; 14: 81-5.
27. Goldstein JL, DeBose-Boyd RA, Brown MS. Protein sensors for membrane sterols. Cell 2006; 124: 35-46.
28. Shimano H. Sterol regulatory element-binding proteins (SREBPs): Transcriptional regulators of lipid synthetic genes. Prog Lipid Res 2001; 40: 439-52.
29. Shimomura I, Shimano H, Horton JD, Goldstein JL, Brown MS. Differential expression of exons 1a and 1c in mRNAs for sterol regulatory element binding protein-1 in human and mouse organs and cultured cells. J Clin Invest 1997; 99: 838-45.
30. Horton JD, Goldstein JL, Brown MS. SREBPs: Activators of the complete program of cholesterol and fatty acid synthesis in the liver. J Clin Invest 2002; 109: 1125-31.
31. Chheda TK, Shivakumar P, Sadasivan SK, Chanderasekha-ran H, Moolemath Y, Oommen AM, Madanahalli JR, et al. Fast food diet with CCl4 micro-dose induced hepatic-fibrosis--a novel animal model. BMC Gastroenterol 2014; 14: 89. 32. Ohta Y, Kongo-Nishimura M, Matsura T, Yamada K,
Kita-gawa A, Kishikawa T. Melatonin prevents disruption of he-patic reactive oxygen species metabolism in rats treated with carbon tetrachloride. J Pineal Res 2004; 36: 10-7. 33. Wang CY, Ma FL, Liu JT, Tian JW, Fu FH. Protective effect of
salvianic acid A on acute liver injury induced by carbon tet-rachloride in rats. Biol Pharm Bull 2007; 30: 44-7.
34. Breikaa RM, Algandaby MM, El-Demerdash E, Abdel-Naim AB. Biochanin A protects against acute carbon tetrachlo-ride-induced hepatotoxicity in rats. Biosci Biotechnol Bio-chem 2013; 77: 909-16.
35. Wahid A, Hamed AN, Eltahir HM, Abouzied MM. Hepatopro-tective activity of ethanolic extract of Salix subserrata against CCl4-induced chronic hepatotoxicity in rats. BMC Complement Altern Med 2016; 16: 263.
Correspondence and reprint request:
Can-bin Zheng, M.S.
Department of Endocrine and Metabolic Diseases. 1st Affiliated Hospital of Shantou University Medical College.
57 Chang Ping Road, Shantou, Guangdong. People's Republic of China, 515031.