Most overweight and obese
Indian children have nonalcoholic fatty liver disease
Sunil V. Pawar,* Vinay G. Zanwar,* Ajay S. Choksey,* Ashok R. Mohite,* Samit S. Jain,* Ravindra G. Surude,* Qais Q. Contractor,* Pravin M. Rathi,**Ravi U. Verma,*** Premlata K. Varthakavi**** * Department of Gastroenterology & Hepatology, Topiwala National Medical College & B Y L Nair Hospital, Mumbai, Maharashtra, India. ** Department of Gastroenterology & Hepatology, Bombay Hospital Institute of Medical Science (BHIMS) and Topiwala National Medical College & B Y L Nair Hospital, Mumbai, Maharashtra, India. *** Department of Radio diagnosis, Topiwala National Medical College & B Y L Nair Hospital, Mumbai, Maharashtra, India. **** Department of Endocrinology, Topiwala National Medical College & B Y L Nair Hospital, Mumbai, Maharashtra, India.
A B S T R A C T A B S T R A C T A B S T R A C T A B S T R A C T A B S T R A C T
Background and rationale.
Background and rationale.Background and rationale.
Background and rationale.
Background and rationale. Nonalcoholic fatty liver disease (NAFLD) is the most common cause of pediatric liver disease in
western countries. Its prevalence in Indian subcontinent is not well studied. Material and methods.Material and methods.Material and methods.Material and methods.Material and methods. In a school based cross
sec-tional study we have screened overweight and obese children in the age group of 11 to 15 years for NAFLD. Ultrasonography, elevat-ed serum transaminases, fibroscan were uselevat-ed for defining NAFLD. Dietary habits, blood pressure, serum lipid profile, blood counts and insulin resistance were recorded. The relation of fibrosis 4 score, pediatric NAFLD fibrosis index, aspartate transaminases to
platelet ratio index (APRI) with fibroscan was evaluated. Results.Results.Results.Results.Results. Out of 616 students screened 198 were overweight and obese.
Hundred students and their parents gave informed consent for the further evaluation. The prevalence of NAFLD was 62% in
over-weight and obese children. Fatty liver was found in 50 % students on ultrasonography, liver stiffness (≥ 6.1 Kilopascals) in 23% and
raised alanine transaminase in 30%. Hypertension, dyslipidemia, diabetes mellitus and insulin resistance were seen in 6%, 18%, 2% and 66% students respectively. Systolic hypertension, serum triglyceride, aspartate transaminase, APRI was significantly higher in
the NAFLD group. On binary logistic regression only systolic hypertension was an independent risk factor for NAFLD. Conclu-Conclu-Conclu-Conclu-
Conclu-sion.
sion.sion.
sion.
sion. In conclusion NAFLD is common in asymptomatic overweight and obese Indian children. Systolic hypertension is the only in-dependent factor associated with NAFLD. Fibroscan has limited role for screening. We recommend screening for NAFLD in this high risk group with alanine transaminases and ultrasonography.
Key words.
Key words.Key words.
Key words.
Key words. Body Mass Index. Fibroscan. Homeostasis model assessment estimated insulin resistance. Ultrasonography. Serum glutamic pyruvate transaminase.
November-December, Vol. 15 No. 6, 2016: 853-861
INTRODUCTION
The term nonalcoholic fatty liver disease (NAFLD) encompasses a progressive disorder from fatty liver to nonalcoholic steatohepatitis to cirrhosis. The worldwide increase in obesity, insulin resistance, dyslipidemia, sec-ondary to changes in dietary habits and increased sedentary lifestyle, has been accompanied by a worldwide spread of NAFLD. It is considered as a hepatic manifestation of metabolic syndrome. The disease is increasingly affecting lower prevalence areas such as developing countries. This is particularly worrying in young adults and children.1
Over the past 3 decades the prevalence of NAFLD has
in-creased to epidemic proportion. It is the most common cause of chronic liver disease in western countries in the pediatric population.2 Overweight and obesity are risk
fac-tors for NAFLD.3 Serum transaminases, ultrasonography
and liver biopsy were used for assessing prevalence in pre-vious studies.2 The sensitivity of each of the tests varies.
The role of transient elastography and controlled attenua-tion parameter in diagnosis of NAFLD is not clear at present.4 Due to paucity of studies from India the exact
prevalence of NAFLD in children is not known. We have done a school based cross sectional study with screening for NAFLD in overweight and obese children using ultra-sonography, transaminases and fibroscan.
The Official Journal of the Mexican Association of Hepatology, the Latin-American Association for Study of the Liver and
the Canadian Association for the Study of the Liver
Manuscript received: Manuscript received:Manuscript received:
MATERIAL AND METHODS
This was a school based cross sectional study, conduct-ed in a convent high school in south Mumbai. The study was approved by institutional ethics committee of our hospital. Informed consent from parents and assent con-sent from children were obtained. Height and weight of school children in the age group 11 to 15 years (between sixth to ninth classes) were measured. The body mass in-dex (BMI) was calculated. The BMI cutoffs for over-weight and obese Indian subjects (Khadilkar, et al.) differ from international (Cole, et al.) standards.5,6 Categorization
in overweight and obese was done using both Khadilkar, et al. criteria as well as Cole, et al. criteria. A detailed profor-ma of demographic profile, dietary habits over a preceding week, history of diabetes mellitus and hypertension was completed. Dietary habits questionnaire included vegetar-ian and non-vegetarvegetar-ian meals per week, fish/egg/other non-vegetarian meal per week, type and quantity of fast foods, soft drinks and chocolates consumed per week. An-thropometric measurements of height, weight, waist cir-cumference, hip circumference were taken. Complete blood count, serum alanine and aspartate transaminases, total cholesterol, triglyceride, insulin level and fasting blood sugar were done. Homeostasis model assessment estimated insulin resistance (HOMA IR) was calculated from fasting insulin and blood sugar values. The fibrosis 4 score (FIB 4),7 pediatric NAFLD fibrosis index8 (PNFI),
aspartate transaminase to platelet ratio index (APRI)9 were
calculated. Abdominal ultrasonography and transient elas-tography were done. For those students who had fatty liver on ultrasonography, abnormal liver enzymes or fibroscan, HBsAg, Anti-HCV, ceruloplasmin and nuclear anti-body were also tested.
The current gold standard for diagnosis of NAFLD is liver biopsy. However, it is invasive, costly and has com-plications. It is limited by operator experience.10 Hence
liver biopsy was not used in the present study.
The diagnosis of NAFLD was made by investigations used in daily clinical practice. Elevated serum glutamic pyruvate transaminase (SGPT) levels (> 40 IU/l) is used in our clinical practice to diagnose steatohepatitis. The proposed low threshold by Prati, et al.11 and Schwimmer, et
al.12 are still not used routinely. On ultrasonography
(USG) NAFLD is diagnosed by the presence of at least two of three abnormal findings: diffusely increased liver echogenicity (greater than kidney or spleen), vascular blurring and deep attenuation of the ultrasound signal.13
Fibroscan is used to measure stiffness in right lobe of the liver in supine position with abduction of the right arm. Speed of propagation of the wave in liver depends on its stiffness. The velocity of shear wave increases in propor-tion to the stiffness of the liver. The stiffness derived is in
kilopascal (KPa) unit. Probe of the fibroscan is equipped with a 3.5 MHz central frequency and a 9 mm external di-ameter ultrasonic transducer mounted on the axis of a vi-brator. The probe was placed between the ribs on the right lobe of the liver. The liver parenchyma free of large vascu-lar structures is noted. When the probe is pressed the vi-brator gives a painless push to the liver tissue which creates shear wave. As the shear wave propagates in the liv-er tissue the readings wliv-ere taken. On each subject 10 read-ings were taken. The fibroscan reading is valid only if the interquartile range (IQR) for all successful measurements of less than 30% of the median value with at least 60% suc-ces rate. Fibroscan measures stiffness in 1 cm diameter core of liver tissue in depth between 2.5 and 6.5 cm. Fi-broscan has been reported as a good predictor for signifi-cant fibrosis in NAFLD children at stiffness ≥ 6.1 KPa.14
The diagnosis of NAFLD includes the whole spectrum of steatosis, steatohepatitis and significant fibrosis.
Blood pressure (BP) was measured by the auscultatory method in sitting position with back supported and after sit-ting quietly for 5 min. Feet were on the floor, right arm sup-ported and cubital fossa was at the heart level. Cuffs of appropriate size as per the size of the arm were used. In chil-dren with elevated readings, BP was again measured after 10 min.15 Hypertension is defined as BP ≥ 135/85 mmHg.16
The waist circumference was calculated using tape ap-plied horizontally just above the upper lateral border of the right ileum. Waist circumference > 90 cm for males and > 80 cm for females was considered abnormal.16
Standing height was measured using a portable stadiome-ter. Weight was measured using portable electronic weigh-ing scale accurate to 100 g.
The sample size was calculated using α error of 0.05, β error of 0.20 with prevalence of NAFLD in obese children being 59%17 and in normal pediatric population it is 3%.18
Using below mentioned formula and website (http:// www2.ccrb.cuhk.edu.hk/stat/proportion/OSp_equality.htm) sample size calculated was 7.
In view of sufficient resources and availability of tools we decided to enroll minimum of 90 subjects.
Statistics
Qualitative data was represented in form of frequency and percentage. Qualitative data included gender, investi-gations like USG, BMI categories, etc. Association be-tween gender of subject and prevalence of NAFLD by USG, SGPT and Fibroscan abnormality was assessed by χ2
test. In view of small counts, adjacent row data was pooled n = (za/2 + zp)
2θ (1-θ)
& χ2 test reapplied. Quantitative data was represented
us-ing mean ± standard deviation (SD) and median & IQR. Quantitative data included age, systolic & diastolic BP, waist circumference (cm) and other anthropometric measurements, and level of various biochemical variables like Aspartate Transaminase, SGPT and HOMA IR, etc. Analysis of quantitative data between the subjects with & without NAFLD was done using unpaired t-test if the data passed ‘Normality test’ or by Mann-Whitney test as data failed ‘Normality test’. Correlation between Fibros-can-Stiffness (KPa), APRI, FIB 4 score & PNFI was done by using Pearson’s correlation. To assess the statistically significant predictors of NAFLD, binary logistic regres-sion was applied between NAFLD as dependent variable and a set of Independent (Predictor) variables. Results were graphically represented where deemed necessary. Microsoft Excel 2010 was used for data entry and PSPP (0.8.5) was used for statistical analysis. Graphical repre-sentation was done using Excel 2010.
RESULTS
Six hundred and sixteen students between age group 11 to 15 years were screened for overweight and obesity
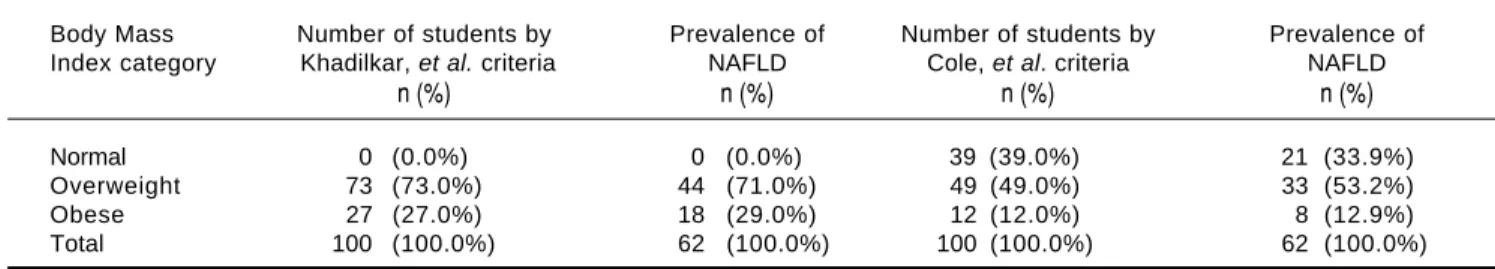
us-ing Khadilkar, et al. criteria; 198 (32.14 %) were overweight and obese. These were also classified as overweight/obese (114 students, 18.5%) by Cole, et al. criteria. The consent for the further evaluation was given by hundred students and their parents. The prevalence of NAFLD was 62 (62%) (Table 1). Out of 39 students whose BMI was nor-mal by Cole, et al. criteria 21 students had NAFLD.
Abdominal obesity was present in 16 (16%) students with males having significantly higher prevalence than fe-males (P value 0.03). Ten out of 16 students with abdomi-nal obesity had NAFLD. On ultrasound fatty liver was found in 50 (50%) students out of which 48 students (96%) were having grade 1 and 4% (2 students) were having grade 2 fatty liver. Fibrosis value ≥ 6.1 KPa was found in 23 (23%) students. Fibroscan stiffness was invalid in 21% stu-dents due to low success rate or high IQR/Median ratio and in 1 student fibroscan could not be done due to obesi-ty. Raised SGPT was seen in 30% students when cut off used was 40 IU/L but when cut off used was 30 IU/l in males and 19 IU/l in females then the raised SGPT was seen in 90 % students. The prevalence of raised SGPT in-creases further to 98 % if cut off of 25.8 for boys and 22.1 IU/l for girls was used. The male to female ratio in NAFLD group is 1.4 (36:26). The prevalence of NAFLD
Figure 1. Figure 1. Figure 1. Figure 1.
Figure 1. Prevalence of NAFLD by different modalities and gender. Gender wise prevalence of NAFLD by USG, SGPT and Fibroscan. NAFLD: nonalcoholic fatty liver di-sease. SGPT: serum glutamic pyruvate transaminase. USG: ultrasonography.
Table 1. Prevalence of normal BMI, overweight, obesity and NAFLD according to Khadilkar, et al. and Cole, et al. criteria.
Body Mass Number of students by Prevalence of Number of students by Prevalence of Index category Khadilkar, et al. criteria NAFLD Cole, et al. criteria NAFLD
n (%) n (%) n (%) n (%)
Normal 0 (0.0%) 0 (0.0%) 39 (39.0%) 21 (33.9%) Overweight 73 (73.0%) 44 (71.0%) 49 (49.0%) 33 (53.2%) Obese 27 (27.0%) 18 (29.0%) 12 (12.0%) 8 (12.9%) Total 100 (100.0%) 62 (100.0%) 100 (100.0%) 62 (100.0%) NAFLD: nonalcoholic fatty liver disease.
Percentage
50
40
30
20
10
0
Male Female
Gender
USG (only) SGPT (only) Fibroscan (only) USG + SGPT (both) Fibroscan + SGPT (both) USG + Fibroscan (both) USG + SGPT + Fibroscan (all 3)
13.9%
16.7%
5.6%
22.2%
2.8%
27.8%
11.1%
42.3%
7.7%
3.8%
26.9%
0%
11.5%
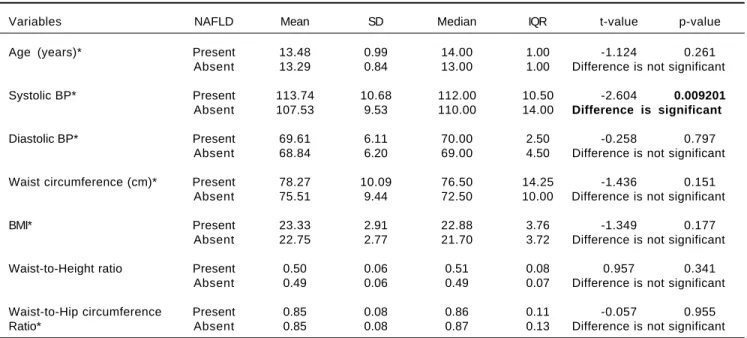
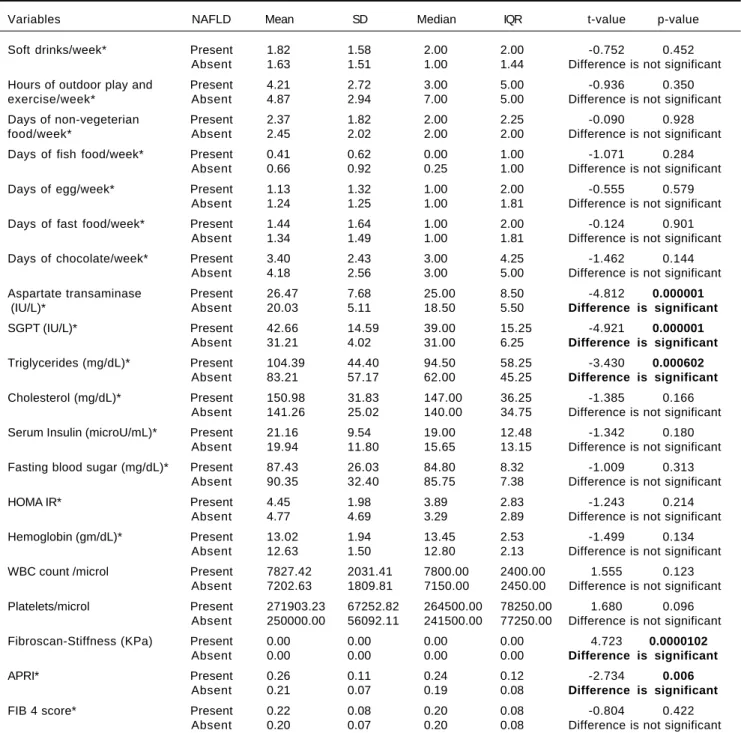
by different modalities and gender is shown in figure 1. Hypertension was detected in 6% students. Systolic BP was elevated in 4% students and all of them were diag-nosed as NAFLD. Isolated diastolic hypertension was seen in 2% students. Combined hypertension was seen in 2% students. Hypertriglyceridemia was noted in 14% stu-dents, hypercholesterolemia in 4%, diabetes mellitus in 2%, impaired fasting glucose levels in 1% and hyperin-sulinemia in 38%. The insulin resistance with HOMA IR (cut off > 3) was present in 66% students. On applying in-dependent t test for continuous variables between the NAFLD and non-NAFLD group (Tables 2 and 3) serum triglyceride, systolic hypertension, aspartate transaminase and APRI value were significantly different. Waist circum-ference, WBC count, Waist to height, waist to hip ratio, BMI, HOMA IR, serum cholesterol, days of nonvegeteri-an diet, days of fast food/chocolate eating per week, days of outdoor play (at least 1 h per day) per week were not significant. Fifty-two percent of the students never did ex-ercise or played outdoors for one hour per day. Out of these 65 % (34 students) were having NAFLD. Of the 48 (48%) who did exercise and played outdoors 28 students (58%) had NAFLD. This difference was not statistically significant. Diabetes mellitus was found in 2 students out of which 1 student had NAFLD. Acanthosis nigricans was de-tected in 2 students. Binary Logistic regression analysis was applied in the NAFLD group. Only systolic hyper-tension was found to be independently related to NAFLD. No dietary pattern was significant (Table 4). The
correla-tion between fibroscan stiffness, APRI, FIB 4, PNFI scores of fibrosis are shown in table 5. Fibroscan stiffness correlates significantly with PNFI and APRI correlates significantly with FIB 4 score.
DISCUSSION
The prevalence of overweight and obesity in our study was 32.14 % by Khadilkar, et al. criteria and 18.5% with Cole, et al. criteria. The Khadilkar criteria are specially de-vised for Indian children and if we used only Cole, et al. criteria we will miss out a major portion of obese children who should be screened for NAFLD. This is reiterated by the fact that 21 out of 39 with normal BMI according to Cole, et al. criteria had NAFLD. The mean BMI in this study is 23.1 kg/m2 with maximum of 34.51 kg/m2. The
prevalence of NAFLD in this study is 62% as suggested by fatty liver detected on ultrasonography, raised SGPT indi-cating NASH and liver stiffness pointing towards fibrosis. The highest prevalence of NAFLD in obese children was reported by Chan, et al.19 (77%), Fu, et al.20 (68.18%) and
Huang, et al.21 (76%) by using ultrasonography. There is
one research letter from India regarding prevalence of pediatric NAFLD.18 This study was hospital based in
gen-eral pediatric population and used ultrasonography as a screening modality. They have not mentioned prevalence of obesity. The prevalence of NAFLD was 3%. The NAFLD was seen in 2 males with normal BMI and in 1 fe-male with obesity. The comparison of prevalence of
Table 2. Comparison of age, BP & various anthropometric variables between students with & without NAFLD.
Variables NAFLD Mean SD Median IQR t-value p-value Age (years)* Present 13.48 0.99 14.00 1.00 -1.124 0.261
Absent 13.29 0.84 13.00 1.00 Difference is not significant Systolic BP* Present 113.74 10.68 112.00 10.50 -2.604 0.009201
Absent 107.53 9.53 110.00 14.00 Difference is significant
Diastolic BP* Present 69.61 6.11 70.00 2.50 -0.258 0.797 Absent 68.84 6.20 69.00 4.50 Difference is not significant Waist circumference (cm)* Present 78.27 10.09 76.50 14.25 -1.436 0.151
Absent 75.51 9.44 72.50 10.00 Difference is not significant BMI* Present 23.33 2.91 22.88 3.76 -1.349 0.177
Absent 22.75 2.77 21.70 3.72 Difference is not significant Waist-to-Height ratio Present 0.50 0.06 0.51 0.08 0.957 0.341
NAFLD in overweight and obese pediatric population in different studies is shown in table 6. Amongst all the stud-ies in overweight and obesity with available mean BMI our study has the lowest BMI. This is due to the lower BMI used for defining overweight and obesity in Indian children as per Khadilkar, et al. criteria. Despite this low
BMI the prevalence of NAFLD is amongst the highest. This indicates a predisposition of our population for NAFLD. Fibroscan could not be done in just 1 (1%) stu-dent. This means fibroscan can be done in this population with the adult probe. The fibrosis value ≥ 6.1 KPa was found in 23% students. The use of fibroscan is limited in
Table 3. Comparison of frequency per week of various food items & biochemical investigations between students with & without
NAFLD.
Variables NAFLD Mean SD Median IQR t-value p-value Soft drinks/week* Present 1.82 1.58 2.00 2.00 -0.752 0.452 Absent 1.63 1.51 1.00 1.44 Difference is not significant
Hours of outdoor play and Present 4.21 2.72 3.00 5.00 -0.936 0.350 exercise/week* Absent 4.87 2.94 7.00 5.00 Difference is not significant
Days of non-vegeterian Present 2.37 1.82 2.00 2.25 -0.090 0.928 food/week* Absent 2.45 2.02 2.00 2.00 Difference is not significant
Days of fish food/week* Present 0.41 0.62 0.00 1.00 -1.071 0.284 Absent 0.66 0.92 0.25 1.00 Difference is not significant
Days of egg/week* Present 1.13 1.32 1.00 2.00 -0.555 0.579 Absent 1.24 1.25 1.00 1.81 Difference is not significant
Days of fast food/week* Present 1.44 1.64 1.00 2.00 -0.124 0.901 Absent 1.34 1.49 1.00 1.81 Difference is not significant
Days of chocolate/week* Present 3.40 2.43 3.00 4.25 -1.462 0.144 Absent 4.18 2.56 3.00 5.00 Difference is not significant
Aspartate transaminase Present 26.47 7.68 25.00 8.50 -4.812 0.000001
(IU/L)* Absent 20.03 5.11 18.50 5.50 Difference is significant
SGPT (IU/L)* Present 42.66 14.59 39.00 15.25 -4.921 0.000001
Absent 31.21 4.02 31.00 6.25 Difference is significant
Triglycerides (mg/dL)* Present 104.39 44.40 94.50 58.25 -3.430 0.000602
Absent 83.21 57.17 62.00 45.25 Difference is significant
Cholesterol (mg/dL)* Present 150.98 31.83 147.00 36.25 -1.385 0.166 Absent 141.26 25.02 140.00 34.75 Difference is not significant
Serum Insulin (microU/mL)* Present 21.16 9.54 19.00 12.48 -1.342 0.180 Absent 19.94 11.80 15.65 13.15 Difference is not significant
Fasting blood sugar (mg/dL)* Present 87.43 26.03 84.80 8.32 -1.009 0.313 Absent 90.35 32.40 85.75 7.38 Difference is not significant
HOMA IR* Present 4.45 1.98 3.89 2.83 -1.243 0.214 Absent 4.77 4.69 3.29 2.89 Difference is not significant
Hemoglobin (gm/dL)* Present 13.02 1.94 13.45 2.53 -1.499 0.134 Absent 12.63 1.50 12.80 2.13 Difference is not significant
WBC count /microl Present 7827.42 2031.41 7800.00 2400.00 1.555 0.123 Absent 7202.63 1809.81 7150.00 2450.00 Difference is not significant
Platelets/microl Present 271903.23 67252.82 264500.00 78250.00 1.680 0.096 Absent 250000.00 56092.11 241500.00 77250.00 Difference is not significant
Fibroscan-Stiffness (KPa) Present 0.00 0.00 0.00 0.00 4.723 0.0000102
Absent 0.00 0.00 0.00 0.00 Difference is significant
APRI* Present 0.26 0.11 0.24 0.12 -2.734 0.006
Absent 0.21 0.07 0.19 0.08 Difference is significant
FIB 4 score* Present 0.22 0.08 0.20 0.08 -0.804 0.422 Absent 0.20 0.07 0.20 0.08 Difference is not significant
screening as just 3 extra cases out of 62 were added by it when seen in respect of all cases detected and investiga-tions used . However an importance of fibroscan lies in stratification of NAFLD. It is helpful for deciding on the need for frequent follow ups and liver biopsy. The cut off value for advanced fibrosis was adopted from another study in a different population.14 Still, the importance and
its significance cannot be undermined. The prevalence of advanced fibrosis was 0.7% in a previous study using his-tology as the gold standard.17 In our study advanced
fibro-sis (≥ 6.9 KPa) was seen by fibroscan in 6 (9.6%) of NAFLD students. The prevalence of isolated fatty liver without abnormal SGPT and liver stiffness was 16% but hyperechoic liver was seen in 50%. This emphasizes the fact that hyperechoic liver on ultrasonography not only means fatty liver but it can be seen in steatohepatitis and even in significant fibrosis.
Raised SGPT was seen in 30 (30%) students when cut off used was 40 IU/L but prevalence of the raised SGPT was seen in 90% and 98 % students if different cut off used
as proposed in previous studies.11,12 The accurate cut off
value for liver enzymes is not studied in the Indian chil-dren. The serum glutamic oxaloacetic transaminase was significantly higher in NAFLD group. Similar findings have been reported in other study.22 Positive correlation
was seen between SGPT and triglyceride values (Pearson coefficient 0.336, P value 0.001) in study population. Simi-lar finding was also shown in the one previous study in pediatric patients.31 The Pearson correlation between
SGPT and liver stiffness was negative but was not signifi-cant. The waist circumference was not higher in NAFLD group. Previous studies have found it significantly higher in them.20,29 Dietary & lifestyle habits were not found to
be significantly different between two groups. These were based on weekly recall of activities and lapses in history may be possible. Gender was not a predisposing factor in NAFLD in the present study. However, many studies have showed NAFLD prevalence to be more in males than females.32,33 NAFLD students do not have higher BMI
than non-NAFLD overweight and obese students in our
Table 5. Correlation between fibroscan liver stiffness, APRI, FIB 4, PNFI scores of fibrosis.
Variables Fibroscan-Liver APRI FIB 4 score PNFI
Stiffness (KPa)
Fibroscan Liver Pearson correlation 1 -0.062 -0.067 0.300(**) Stiffness (KPa) p-value 0.5851 0.5581 0.0072
APRI Pearson correlation -0.062 1 0.899(**) 0.036
p-value 0.5851 5.56E-37 0.7186
FIB 4 score Pearson correlation -0.067 0.899(**) 1 -0.032
p-value 0.5581 5.56E-37 0.7505
PNFI Pearson correlation 0.300(**) 0.036 -0.032 1
p-value 0.0072 0.7186 0.7505
**Correlation is significant at the 0.01 level (2-tailed). APRI: aspartate transaminase to Platelet Ratio Index. FIB 4: fibrosis 4 score. KPa: Kilopascals. PNFI: pediatric NAFLD fibrosis index, 5.56E-37: 5.56 x 10-37.
Table 4. Binary logistic regression between ‘NAFLD present as 1, absent as 0’ as dependent variable & and a set of independent
(predictor) variables.
Variable B S.E. Wald d f p-value Exp(B) 95.0% C.I.for EXP (B) Lower Upper Soft drinks/week 0.275 0.174 2.518 1 0.113 1.317 0.937 1.851 Days of fish food/week -0.422 0.316 1.783 1 0.182 0.656 0.353 1.218 Days of chocolate/week -0.175 0.098 3.212 1 0.073 0.840 0.693 1.017 Systolic BP 0.052 0.025 4.455 1 0.035 1.054 1.004 1.106 BMI 0.073 0.084 0.752 1 0.386 1.076 0.912 1.268 Triglycerides (mg/dl) 0.010 0.006 2.954 1 0.086 1.010 0.999 1.021 HOMA IR -0.060 0.071 0.708 1 0.400 0.942 0.820 1.083 WBC count /microl 0.000 0.000 0.601 1 0.438 1.000 1.000 1.000 Constant -7.930 3.245 5.971 1 0.015 0.000
B: estimated multinomial logistic regression coefficients for the model. BMI: body mass index. BP: blood pressure. CI: confidence interval. Constant: constant of regression model. df: degree of freedom. Exp (B): exponentiation of the B coefficient which is an odds Ratio. HOMA IR: homeostasis model assessment estimated insulin resistance. SE: standard errors of the individual regression coefficients. Wald: Wald χ2 test that tests the null hypothesis that the estimate
subjects. Few studies have showed similar findings.17
Higher BMI in NAFLD group have been reported fre-quently.29,33,34 This means some unknown factor which
differs between these overweight/obese children exists which predispose them to NAFLD. Serum triglyceride levels were higher in NAFLD group than non-NAFLD. Similar findings have been reported in the past.27,34 We did
not find serum cholesterol to be significant in the NAFLD group unlike in other study.20 Diabetes mellitus
was found in 2 students out of which 1 student had NAFLD. The HOMA IR, fasting insulin and fasting blood sugar levels were not significantly different between the NAFLD and non NAFLD group. This finding is in con-tradiction with many of the studies published.20,27,29 These
findings indicate that hyperinsulinemia and increased in-sulin resistance alone are not enough to explain NAFLD in our patients. HOMA IR was having positive correlation with BMI (Pearson coefficient 0.214, P value 0.032) but not with waist circumference. Dyslipidemia was seen in 18% in overall students. It is lower than other studies where dyslipidemia was found in higher number of pa-tients.17,26 The age wise prevalence in the NAFLD was not
statistically different and probably age is not an important factor in this group with NAFLD. Other studies have showed age to be significantly different in patients with NAFLD.27,33,34,35 The socioeconomic status was not
availa-ble for comparison as this was a cross section study in school and students were not aware of the details of the family income but depending upon school records and lo-cality they belonged to lower middle socioeconomic class. When binary logistic regression was applied in the NAFLD group only systolic hypertension was found to be independently related. This is probably an effect and not the cause. Similar finding has been reported in the past.17,34
Waist circumference and cholesterol have also been found to be independent predictors of NAFLD in other study.36
The APRI values were significantly different between the NAFLD and non NAFLD groups. The components of this score are Serum glutamic oxaloacetic transaminase and platelet count.9 In FIB 4 score, age and SGPT were
additional factors.7 Probably age has taken away
signifi-cance as age was not significant in the present study. Our study does show positive correlation between PNFI and fibroscan and also between APRI and FIB 4.
The longitudinal follow up of NAFLD children has showed progression of the disease.37 The present study
shows high prevalence of NAFLD in overweight and obese students. If not tackled in time there will be an epi-demic of not only symptomatic liver disease but also of cardiovascular diseases, diabetes mellitus and cancers. The screening can be done at present by easily available serum SGPT and ultrasonography of liver. Fibroscan adds on only a small percentage and has limited role in screening.
Table 6.
The prevalence of NAFLD in different studies world wide.
Study A g e Study Mean BMI Prevalence Country In v e stigation Year R e ference (years) population
(Total No. of Subjects)
Chan, et al. 9 t o 1 4 Obese 30.3 77% steatosis China SGPT, USG 2004 19
24% NASH (84)
Arslan, et al. 4 t o 1 8 Obese -11.8% (322) Turkey U S G 2005 22 Louthan, et al. 4 t o 1 7 Obese -8.3% (181) U S A SGPT 2005 23 Schwimmer, et al. 2 t o 1 9 Overall
-38 % Obese (742)
U S A Liver biopsy 2006 24 Nobili, et al. 2 t o 1 7 Overall -5 0% Obese (3280) Italy SGPT 2009 25 Reinehr, et al. 9 t o 1 4 Obese 28.2 29.3% (287) Germany U S G 2009 26 Gupta, et al. 5 t o 2 0 Obese -15.4% (700) U S A SGPT 2011 27 Fu, et al. 6 t o 1 6 Obese Approx. 27 68.18% (861) China USG, SGPT 2011 20 El-Koofy, et al. 2 t o 1 3 Overweight
-24.2% fatty liver 21.2%
NASH (33) Egypt Histology 2012 28 & Obese Papandreou, et al. 8 t o 1 5 Obese -42.6% (82) Greek U S G 2012 29 Huang, et al. 6 t o 1 2 General
-25% overweight 76% obese (219)
Taiwan U S G 2013 21 Zhang, et al. 7 t o 1 8 General Approx. 19
49.8% obese (7229 overall)
China U S G 2015 3 0 Xanthakos, et al. 1 5 t o 1 9 Obese 51.6 5 9 % ( 1 4 8 ) U S A Liver biopsy 2015 17 Present study 1 1 t o 1 5 Overweight 23.1 6 2 % (100) India
USG, SGPT, Fibroscan
2015
& Obese
We strongly recommend screening of NAFLD in the overweight and obese children.
This is first study to our knowledge from India which evaluated prevalence of whole spectrum of NAFLD in asymptomatic overweight/obese students. The effective-ness of fibroscan for use in screening for NAFLD was as-sessed. Many of the factors statistically derived were different suggesting that NAFLD in our population be-haves differently. The limitation of our study was the non-availability of liver biopsy for comparison with other investigations and scores.
CONCLUSION
NAFLD is very common in our population of asymp-tomatic overweight and obese children. Systolic hyper-tension is the only independent factor responsible for NAFLD in students. The serum triglycerides, systolic hy-pertension, Serum glutamic oxaloacetic transaminase, APRI were significantly higher in NAFLD group. The pediatric NAFLD may behave differently in Indian chil-dren. Fibroscan has limited role in screening. We strongly recommend screening for NAFLD in this high risk group with SGPT and ultrasonography.
ABBREVIATIONS
• Anti-HCV: anti Hepatitis C.
• APRI: aspartate transaminase to Platelet Ratio Index.
• BMI: body Mass Index. • BP: blood pressure.
• FIB 4 Score: fibrosis 4 score.
• HBsAg: hepatitis B surface antigen.
• HOMA IR: homeostasis model assessment estimated
insulin resistance. • IQR: inter quartile range. • KPa: kilopascal.
• NAFLD: nonalcoholic fatty liver disease.
• PNFI: pediatric NAFLD fibrosis index.
• SD: standard deviation.
• SGPT: serum glutamic pyruvate transaminase.
• USG: ultrasonography. • WBC: white blood cell.
FINANCIAL GRANT
Rameshwardasji Birla Smarak Kosh, Bombay Hospital Institute of Medical Science (BHIMS).
ACKNOWLEDGMENT
We thank Dr. Pravir Gambhire, Dr. Ravindra Surude, Dr. Abhiram Kasbe, Mrs. Marita, Mrs. Sujata for their help in the conducting and facilitating the study.
REFERENCES
1. Masarone M, Federico A, Abenavoli L, Loguercio C, Persico M. Non-alcoholic fatty liver: epidemiology and natural history.
Rev Recent Clin Trials 2014; 9: 126-33.
2. Shneider BL, Gonzalez-Peralta R, Roberts EA. Controver-sies in the management of pediatric liver disease: Hepatitis B, C and NAFLD: Summary of a single topic conference.
Hepatology 2006; 44: 1344-54.
3. Pacifico L, Poggiogalle E, Cantisani V, Menichini G, Ricci P, Ferraro F, Chiesa C. Pediatric nonalcoholic fatty liver dis-ease: A clinical and laboratory challenge. World J Hepatol
2010; 2: 275-88.
4. Abenavoli L, Beaugrand M. Transient elastography in non-al-coholic fatty liver disease. Ann Hepatol 2012; 11: 172-8. 5. Khadilkar VV, Khadilkar AV, Borade AB, Chiplonkar SA.
Body mass index cut-offs for screening for childhood over-weight and obesity in Indian children. Indian Pediatr 2012; 49: 29-34.
6. Cole TJ, Bellizzi MC, Flegal KM, Dietz WH. Establishing a standard definition for child overweight and obesity world-wide: international survey. BMJ 2000; 320: 1240-3.
7. Yang HR, Kim HR, Kim MJ, Ko JS, Seo JK. Noninvasive pa-rameters and hepatic fibrosis scores in children with nonal-coholic fatty liver disease. World J Gastroenterol 2012; 18: 1525-30.
8. Nobili V, Alisi A, Vania A, Tiribelli C, Pietrobattista A, Bedogni G. The pediatric NAFLD fibrosis index: a predictor of liver fi-brosis in children with non-alcoholic fatty liver disease. BMC Med 2009; 7: 21.
9. de Lédinghen V, Le Bail B, Rebouissoux L, Fournier C, Foucher J, Miette V, Castéra L, et al. Liver stiffness meas-urement in children using FibroScan: feasibility study and comparison with Fibrotest, aspartate transaminase to plate-lets ratio index, and liver biopsy. J Pediatr Gastroenterol Nutr 2007; 45: 443-50.
10. Marzuillo P, Grandone A, Perrone L, Miraglia Del Giudice E. Controversy in the diagnosis of pediatric non-alcoholic fatty liver disease. World J Gastroenterol 2015; 21: 6444-50. 11. Prati D, Taioli E, Zanella A, Della Torre E, Butelli S, Del
Vec-chio E, Vianello L, et al. Updated definitions of healthy rang-es for serum alanine aminotransferase levels. Ann Intern Med 2002; 137: 1-10.
12. Schwimmer JB, Dunn W, Norman GJ, Pardee PE, Middleton MS, Kerkar N, Sirlin CB. SAFETY study: alanine aminotrans-ferase cutoff values are set too high for reliable detection of pediatric chronic liver disease. Gastroenterology 2010; 138: 1357-64.
13. Yajima Y, Ohta K, Narui T, Abe R, Suzuki H, Ohtsuki M. Ultra-sonographic diagnosis of fatty liver: significance of the liv-er–kidney contrast. Tohoku J Exp Med 1983; 139: 43-50. 14. Fitzpatrick E, Quaglia A, Vimalesvaran S, Basso MS,
Dha-wan A. Transient elastography is a useful noninvasive tool for the evaluation of fibrosis in paediatric chronic liver dis-ease. J Pediatr GastroenterolNutr 2013; 56: 72-6.
15. National High Blood Pressure Education Program Working Group on High Blood Pressure in Children and Adolescents. The fourth report on the diagnosis, evaluation, and treatment of high blood pressure in children and adolescents. Pediat-rics 2004; 114: 555-76.
16. Zimmet P, Alberti KG, Kaufman F, Tajima N, Silink M, Arslani-an S, Wong G, et al; IDF Consensus Group. The metabolic syndrome in children and adolescents - an IDF consensus report. Pediatr Diabetes 2007; 8: 299-306.
Nonalcohol-ic Fatty Liver Disease in Adolescents Undergoing BariatrNonalcohol-ic Surgery. Gastroenterology 2015; 149: 623-34.
18. Chaturvedi K, Vohra P. Non-alcoholic fatty liver disease in children. Indian Pediatr 2012; 49: 757-8.
19. Chan DF, Li AM, Chu WC, Chan MH, Wong EM, Liu EK, Chan IH, et al. Hepatic steatosis in obese Chinese children. Int J
Obes Relat Metab Disord 2004; 28: 1257-63.
20. Fu JF, Shi HB, Liu LR, Jiang P, Liang L, Wang CL, Liu XY. Non-alcoholic fatty liver disease: An early mediator predict-ing metabolic syndrome in obese children? World J
Gastro-enterol 2011; 17: 735-42.
21. Huang SC, Yang YJ. Serum retinol-binding protein 4 is inde-pendently associated with pediatric NAFLD and fasting trig-lyceride level. J Pediatr Gastroenterol Nutr 2013; 56: 145-50.
22. Arslan N, Büyükgebiz B, Oztürk Y, Cakmakçi H. Fatty liver in obese children:prevalence and correlation with anthropo-metric measurements and hyperlipidemia. Turk J Pediatr
2005; 47: 23-7.
23. Louthan MV, Theriot JA, Zimmerman E, Stutts JT, McClain CJ. Decreased prevalence of nonalcoholic fatty liver disease in black obese children. J Pediatr Gastroenterol Nutr 2005; 41: 426-9.
24. Schwimmer JB, Deutsch R, Kahen T, Lavine JE, Stanley C, Behling C. Prevalence of fatty liver in children and adoles-cents. Pediatrics 2006; 118: 1388-93.
25. Nobili V, Reale A, Alisi A, Morino G, Trenta I, Pisani M, Mar-cellini M, et al. Elevated serum ALT in children presenting to the emergency unit: Relationship with NAFLD. Dig Liver Dis
2009; 41: 749-52.
26. Reinehr T, Toschke AM. Onset of puberty and cardiovascu-lar risk factors in untreated obese children and adolescents: a 1-year follow-up study. Arch Pediatr Adolesc Med 2009; 163: 709-15.
27. Gupta R, Bhangoo A, Matthews NA, Anhalt H, Matta Y, Lam-ichhane B, Malik S, et al. The prevalence of non-alcoholic fatty liver disease and metabolic syndrome in obese chil-dren. J Pediatr Endocrinol Metab 2011; 24: 907-11. 28. Nehal M. El-Koofy, Ghada M. Anwar, Mona S. El-Raziky,
Ah-mad M. El-Hennawy, Fatma M. El-Mougy, Hanaa M. El-Karak-sy, Fetouh M. Hassanin, et al. The Association of Metabolic Syndrome, Insulin Resistance and Non-alcoholic Fatty Liver Disease in Overweight/Obese Children. Saudi J
Gastroen-terol 2012; 18: 44-9.
29. Papandreou D, Karabouta Z, Pantoleon A, Rousso I. Investi-gation of anthropometric, biochemical and dietary parame-ters of obese children with and without non-alcoholic fatty liver disease. Appetite 2012; 59: 939-44.
30. Zhang X, Wan Y, Zhang S, Lu L, Chen Z, Liu H, Jiang X, et al. Nonalcoholic fatty liver disease prevalence in urban school-aged children and adolescents from the Yangtze Riv-er delta region: a cross-sectional study. Asia Pac J Clin Nutr 2015; 24: 281-8.
31. Oliveira AM, Oliveira N, Reis JC, Santos MV, Silva AM, Adan L. Triglycerides and alanine aminotransferase as screening markers for suspected fatty liver disease in obese children and adolescents. Horm Res 2009; 71: 83-8.
32. Schwimmer JB, McGreal N, Deutsch R, Finegold MJ, Lavine JE. Influence of gender, race, and ethnicity on suspected fatty liver in obese adolescents. Pediatrics 2005; 115: e561-e565.
33. Wiegand S, Keller KM, Röbl M, L’Allemand D, Reinehr T, Wid-halm K, Holl RW;APV-Study Group and the German Compe-tence Network Adipositas. Obese boys at increased risk for nonalcoholic liver disease: evaluation of 16,390 overweight or obese children and adolescents. Int J Obes (Lond) 2010; 34: 1468-74.
34. Park HS, Han JH, Choi KM, Kim SM. Relation between ele-vated serum alanine aminotransferase and metabolic syn-drome in Korean adolescents. Am J Clin Nutr 2005; 82: 1046-51.
35. Strauss RS, Barlow SE, Dietz WH. Prevalence of abnormal serum aminotransferase values in overweight and obese adolescents. J Pediatr 2000; 136: 727-33.
36. Alavian SM, Mohammad-Alizadeh AH, Esna-Ashari F, Arda-lan G, Hajarizadeh B. Non-alcoholic fatty liver disease prev-alence among school-aged children and adolescents in Iran and its association with biochemical and anthropometric measures. Liver Int 2009; 29: 159-63.
37. Feldstein AE, Charatcharoenwitthaya P, Treeprasertsuk S, Benson JT, Enders FB, Angulo P. The natural history of non-alcoholic fatty liver disease in children: a follow-up study for up to 20 years. Gut 2009; 58: 1538-44.
Correspondence and reprint request:
Sunil Vyankatrao Pawar, DM, Senior Resident Department of Gastroenterology & Hepatology,
7th floor, OPD building,
Topiwala National Medical College and Bai Yamunabai Laxman Nair Hospital, Dr. Anandrao Nair Road, Mumbai Central,
Mumbai. Maharashtra, India Pin Code:400008. Tel.: +91-9403929078. Fax: +91-22-23021168