Differences In Hepatic Expression of Iron,
Inflammation and Stress-Related Genes in
Patients with Nonalcoholic Steatohepatitis
Priya Handa,* Bryan D. Maliken,** James E. Nelson,** Kelly A. Hennessey,* L. Akhila Vemulakonda,* Vicki Morgan-Stevenson,* Barjinder K. Dhillon,** Rohit Gupta,** Matthew M. Yeh,*** Kris V. Kowdley* * Organ Care Research and Liver Care Network, Swedish Medical Center, ** Benaroya Research Institute, *** University of Washington Medical Center, Seattle WA.
A B S T R A C T A B S T R A C T A B S T R A C T A B S T R A C T A B S T R A C T
Nonalcoholic fatty liver disease (NAFLD) is the most common cause of chronic liver disease worldwide. We have previously shown that hepatic reticuloendothelial system (RES) iron deposition is associated with an advanced degree of nonalcoholic steatohepatitis (NASH) in humans. In this study, we aimed to determine differentially expressed genes related to iron overload, inflammation and oxidative stress pathways, with the goal of identifying factors associated with NASH progression. Seventy five patients with NAFLD were evaluated for their biochemical parameters and their liver tissue analyzed for NASH histological characteristics. Gene expres-sion analysis of pathways related to iron homeostasis, inflammation and oxidative stress was performed using real-time PCR. Gene expression was compared between subjects based on disease status and presence of hepatic iron staining. We observed increased gene expression of hepcidin (HAMP) (2.3 fold, p = 0.027), transmembrane serine proteinase 6 (TMPRSS6) (8.4 fold, p = 0.003), signal transducer and activator of transcription 3 (STAT3) (5.5 fold, p = 0.004), proinflammatory cytokines; IL-1β (2.7 fold, p = 0.046) and TNF-α (3.8 fold, p = 0.001) in patients with NASH. TMPRSS6, a negative regulator of HAMP, is overexpressed in patients with NASH and HIF1α (hypoxia inducible factor-1) is downregulated. NAFLD patients with hepatic iron deposition exhibited higher hepci-din expression (3.1 fold, p = 0.04) but lower expression of cytokines. In conclusion, we observed elevated hepatic HAMP expression in patients with NASH and in NAFLD patients who had hepatic iron deposition, while proinflammatory cytokines displayed elevated expression only in patients with NASH, suggesting a regulatory role for hepcidin in NAFL to NASH transition and in mitigating inflammatory responses.
Key words. Key words.Key words. Key words.
Key words. Nonalcoholic fatty liver disease. Nonalcoholic steatohepatitis. Hepcidin. Iron. Inflammation. TMPRSS6.
January-February, Vol. 16 No. 1, 2017: 77-85
INTRODUCTION
Nonalcoholic fatty liver disease (NAFLD) is the most prevalent chronic liver disease and is strongly associated
with obesity and the attendant metabolic syndrome.1
NAFLD encompasses a broad spectrum of liver disorders, ranging from simple steatosis to its more severe form, nonalcoholic steatohepatitis (NASH), which progresses to cirrhosis or hepatocellular carcinoma in 20-25% of
pa-tients.1 Oxidative stress is believed to be an important
contributor to the pathogenesis of NASH.2 Excess hepatic
iron can promote oxidative stress via Fenton’s reaction and is proposed to be a cofactor in the development
of NASH.2 We have previously shown that the presence of
hepatic iron and the occurrence of HFE mutations such as C282Y, is associated with more advanced NASH
suggest-ing a role for iron in exacerbatsuggest-ing NAFL to NASH.3-5
Further, we have also shown a strong relationship be-tween hepatic iron deposition pattern and histologic se-verity of NAFLD wherein iron deposition in hepatic reticuloendothelial system (RES) cells is associated with higher NAFLD activity score (NAS) and advanced
fibro-sis.5 Thus, the involvement of iron in the pathogenesis of
NASH underscores the need to better understand the iron homeostasis pathway, with emphasis on the regulatory
role of hepcidin, a key iron homeostasis protein.6
Hepcidin, produced primarily by hepatocytes, regulates intestinal iron absorption, macrophage iron recycling and
The Official Journal of the Mexican Association of Hepatology, the Latin-American Association for Study of the Liver and
the Canadian Association for the Study of the Liver
Manuscript received: Manuscript received:Manuscript received:
mobilization of iron from hepatic stores by binding and internalizing the iron transporter, ferroportin.6
Hepci-din expression is enhanced by increased iron stores via hemojuvelin (HJV), bone morphogenetic protein (BMP6) and Sma and Mad related proteins (SMAD) via HJV/
BMP/SMAD pathway7 and during inflammation via
induc-tion of Janus kinase/Signal transducer and activator of
tran-scription (JAK2/STAT3) pathway,8,9 conditions commonly
seen in NAFLD.10 Hepcidin is inhibited by anemia,
hy-poxia and augmented erythropoiesis via the transcription factor C/EBPa and transmembrane serine protease 6
(TMPRSS6).9,11,12-14 Hepcidin regulatory mechanisms have
been investigated in animal models and only a few studies have investigated the role of hepcidin in human NAFLD pa-tients,10,15-18 and none have examined the regulatory
mecha-nisms of hepcidin expression in patients with NAFLD. The aim of this study was to examine the expression profiles of iron regulatory genes, and inflammatory and oxi-dative and other stress-response pathways in patients with NAFLD, with a goal to identify differentially expressed genes in patients who have NASH, and in NAFLD patients with and without hepatic iron overload. Total RNA from liver tissues of patients with NAFLD were analyzed to evalu-ate expression profiles of candidevalu-ate genes in the disease
states; NAFL vs. NASH, and based on presence or absence
of observable iron deposition in liver tissue of NAFLD patients.
MATERIAL AND METHODS
Subjects
Patients were enrolled from University of Washington Medical Center and Virginia Mason Medical center clin-ics in Seattle, WA in the study. The study was approved by the human subjects institutional review board and written informed consents were obtained from all subjects. Inclusion criteria were: minimal alcohol use (< 20 g/day) reported by the patients and appropriate exclusion of other liver diseases including viral hepatitis, autoimmune hepa-titis, drug-induced liver disease, primary biliary cirrhosis, Wilson’s disease, and α1-antitrypsin deficiency. Hematoxylin and eosin staining along with Prussian Blue stain specific for iron were used in the grading of the NAS score. All patients met the criteria for NAFLD as defined by Brunt, et al.19
Baseline laboratory studies
Clinical data included body mass index (BMI), pres-ence of diabetes mellitus, serum aminotransferase levels Aspartate transaminase (AST) and Alanine transaminase (ALT), triglycerides, cholesterol, glucose, iron, ferritin and transferrin iron saturation. Liver tissue was obtained
by percutaneous needle biopsy and samples were snap fro-zen in liquid nitrogen, stored at -70 ºC for subsequent RNA extraction and gene expression analysis.
RNA preparation and cDNA synthesis
Total RNA was isolated from liver tissue using RNeasy Mini kit (QIAGEN GmbH, Germany). RNA quality was determined using RNA 6000 Nano Chip Kit and Bioanalyzer 2100 (Agilent Technologies). Samples with a RNA Integrity Number (RIN) value of 4.0 or greater were included for gene expression stud-ies. The cDNA first-strand synthesis was performed using Superscript First-Strand Synthesis System (Invitrogen)
and oligo (dT) primers with 1 μg RNA in 20 μL
reaction volume.
Quantitative real time PCR: Quantitative real time-PCR using SYBR GreenER qPCR super mix (Invitrogen) was performed on the ABI 7900 HT real time PCR machine. Primers were designed to span intronic sequences to avoid amplification of any contaminant genomic DNA. Specific primers were used for RT PCR amplification of HAMP (hepcidin antimicrobial peptide), FPN1 (ferroportin), CREBH (cAMP responsive element-binding protein,
hepatocyte specific), IL-6, IL-6R, IL-1β, TNFα, NFκB,
BMP6 (bone morphogenetic protein), TMPRSS6, SOCS3 (suppressor of cytokine signaling 3), HO-1 (hemeoxygense 1),
HIF1α (hypoxia inducible factor-1α) and STAT3 genes and
are tabulated (Table 1) and HJV primers obtained from
Applied Biosystems were used. 10 μL of SYBR GreenER
qPCR super mix (Invitrogen), 1 μM of (forward and
reverse) primers and 25 ng of the cDNA template were
mixed in a 20 μL reaction volume. Fold change in gene
expression was determined by normalization to glyceralde-hyde phosphate dehydrogenase (GAPDH).
Serum cytokine analysis
Blood samples from patients were analyzed in dupli-cates for quantitative measurement of serum cytokines us-ing enzyme-linked immunosorbent assay (ELISA) kit: Bio-Plex Pro Human Cytokine 17-plex Assay (Biorad).
Statistical analysis
Descriptive statistics of continuous variables were ex-pressed as medians with the interquartile range in paren-theses. Continuous variables were compared between
groups using the Mann-Whitney U test for nonparametric
RESULTS
Clinical & laboratory characteristics
Patients were divided into groups based on diagnosis of NAFL or NASH by histological variables, or NAFLD pa-tients with or without hepatic iron deposition (presence of stainable iron on liver biopsy samples). Across all patients, the mean patient age was 47 (± 9yrs) years, 49% were male,
and 67% had a BMI greater than 30 kg/m2. There were more
females (26/45) (p = 0.053) in the NASH group and NASH patients had higher AST (p = 0.01) and more severe histo-logical scoring (steatosis, ballooning, inflammation and fi-brosis, p < 0.0001) (Table 2). Elevated serum ferritin was present in 34% of the patients, 31% had diabetes, 52% had hypertension and 51% had hyperlipidemia.
Analysis revealed that more individuals were males (19/26) (p = 0.008) in the cohort defined as NAFLD with hepatic iron. This group also had a significantly lower BMI (p = 0.03), CRP (p = 0.0093), total iron binding capacity (TIBC) (p = 0.0498), Alkaline phosphatase (p = 0.0128) and HDL (p = 0.0287), and displayed a higher HDL (p = 0.028), serum ferritin (p = 0.0009), se-rum iron (p = 0.0079), transferrin-iron saturation (p = 0.0005), serum albumin (p = 0.0052), AST (p = 0.001), ALT (p = 0.0045), total cholesterol (p = 0.039), triglycer-ides (p = 0.029), and LDL (p = 0.05) (Table 3).
Increased hepatic gene expression of proinflammatory cytokines in
patients with NASH relative to patients with NAFL
Levels of IL-1β (2.7 fold, p = 0.046), STAT3 (5.5 fold,
p = 0.004) and TNFα (3.8 fold, p = 0.01) were upregulated
in patients with NASH. While hepatic expression of IL-6,
IL-6R and NFκB genes were also higher in NASH
sub-jects, statistical significance was not achieved. SOCS3 expression was significantly reduced in patients with NASH (Figure 1A).
Hepcidin and TMPRSS6 expression is increased in patients with NASH
Hepatic gene expression levels of hepcidin (HAMP) were higher (2.3 fold, p = 0.02) in patients with NASH compared to NAFL subjects. Analysis of additional iron homeostasis genes within the BMP/SMAD pathway (HJV, FPN and BMP6) did not show significantly ele-vated expression profile in our patient population, even though HJV expression showed a trend towards increase (p = 0.06) (Figure 1B). Interestingly, we observed that the expression of TMPRSS6, a negative regulator of hep-cidin expression, was higher in patients with NASH (8.4 fold, p = 0.003). We also observed a significantly
de-creased expression of HIF1α (p = 0.004), a redox
sensi-tive gene, in patients with NASH. Expression of HO-1 and CREBH did not show any statistically significant al-terations between the two groups (Figure 1C).
Excess hepatic iron is associated with increased hepcidin and
reduced inflammatory cytokine expression in NAFLD patients with stainable iron deposition
A significant increase in hepcidin expression (3.1 fold, p = 0.04) was observed in NAFLD patients with histological evidence of stainable hepatic iron compared to NAFLD
patients without iron. Expression of IL-1β (4 fold,
p = 0.06), TNFα (3 fold, p = 0.13), IL-6 (8 fold, p = 0.008), NFkB (5 fold, p = 0.02) and SOCS3 (2 fold, p = 0.07) Table 1. List of primers sequence used for the target genes.
Gene Sense Primer Antisense Primer
1 GAPDH 5’CCACATCGCTCAGACACCAT3’ 5’GGCAACAATATCCACTTTACCAGAGT3’
2 HAMP 5’CATCTGCATTTTCTGCTGCG3’ 5’GTCTTGCAGCACATCCCAC3’
3 FPN1 5’CTTCAGCCTGGCAAGTTACATG3’ 5’CTTCTCAAAGGCATTTGAAAGGG3’
4 IL-6 5’GGTACATCCTCGACGGCATCT3’ 5’GTGCCTCTTTGCTGCTTTCAC3’
5 IL-6R 5’ATCGGGCTGAACGGTCAAAG3’ 5’GGCGTCGTGGATGACACAG3’
6 TNFα 5’GACAAGCCTGTAGCCCATGT3’ 5’TTATCTCTCAGCTCCACGCC3’
7 IL-1β 5’CCTGTCCTGCGTGTTGAAAGA3’ 5’GGGAACTGGGCAGACTCAAA3’
8 NFκB 5’CCCCACGAGCTTGTAGGAAAG3’ 5’CCAGGTTCTGGAAACTGTGGAT3’
9 CREBH 5’CTGGTCCTGAGGAATGCAACAG3’ 5’CTGGGAGCATAGTCCTGGCG3’
10 BMP6 5’TGTTGGACACCCGTGTAGTAT3’ 5’AACCCACAGATTGCTAGTGGC3’
11 TMPRSS6 5’CCTACAGGGCCGAGTACGAA3’ 5’TCAATGCAGCTATGTCTTTCACA3’
12 SOCS3 5’CCTGCGCCTCAAGACCTTC3’ 5’GTCACTGCGCTCCAGTAGAA3’
13 STAT3 5’CAGCAGCTTGACACACGGTA3’ 5’AAACACCAAAGTGGCATGTGA3’
14 HO-1 AAGACTGCGTTCCTGCTCAAC AAAGCCCTACAGCAACTGTCG
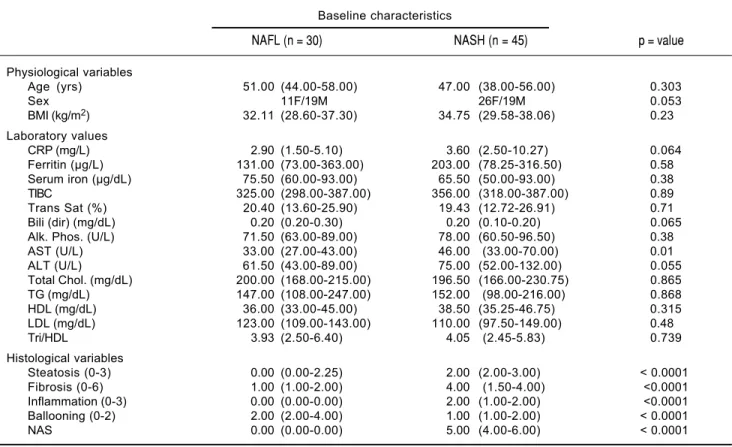
Table 2. Baseline characteristic, values are presented as the median (25th to 75th percentile) for physiologic variable, laboratory
values and histological scores.
Baseline characteristics
NAFL (n = 30) NASH (n = 45) p = value
Physiological variables
Age (yrs) 51.00 (44.00-58.00) 47.00 (38.00-56.00) 0.303
Sex 11F/19M 26F/19M 0.053
BMI (kg/m2) 32.11 (28.60-37.30) 34.75 (29.58-38.06) 0.23
Laboratory values
CRP (mg/L) 2.90 (1.50-5.10) 3.60 (2.50-10.27) 0.064
Ferritin (μg/L) 131.00 (73.00-363.00) 203.00 (78.25-316.50) 0.58
Serum iron (μg/dL) 75.50 (60.00-93.00) 65.50 (50.00-93.00) 0.38
TIBC 325.00 (298.00-387.00) 356.00 (318.00-387.00) 0.89
Trans Sat (%) 20.40 (13.60-25.90) 19.43 (12.72-26.91) 0.71
Bili (dir) (mg/dL) 0.20 (0.20-0.30) 0.20 (0.10-0.20) 0.065
Alk. Phos. (U/L) 71.50 (63.00-89.00) 78.00 (60.50-96.50) 0.38
AST (U/L) 33.00 (27.00-43.00) 46.00 (33.00-70.00) 0.01
ALT (U/L) 61.50 (43.00-89.00) 75.00 (52.00-132.00) 0.055
Total Chol. (mg/dL) 200.00 (168.00-215.00) 196.50 (166.00-230.75) 0.865
TG (mg/dL) 147.00 (108.00-247.00) 152.00 (98.00-216.00) 0.868
HDL (mg/dL) 36.00 (33.00-45.00) 38.50 (35.25-46.75) 0.315
LDL (mg/dL) 123.00 (109.00-143.00) 110.00 (97.50-149.00) 0.48
Tri/HDL 3.93 (2.50-6.40) 4.05 (2.45-5.83) 0.739
Histological variables
Steatosis (0-3) 0.00 (0.00-2.25) 2.00 (2.00-3.00) < 0.0001
Fibrosis (0-6) 1.00 (1.00-2.00) 4.00 (1.50-4.00) <0.0001
Inflammation (0-3) 0.00 (0.00-0.00) 2.00 (1.00-2.00) <0.0001
Ballooning (0-2) 2.00 (2.00-4.00) 1.00 (1.00-2.00) < 0.0001
NAS 0.00 (0.00-0.00) 5.00 (4.00-6.00) < 0.0001
Statistical significance (p < 0.05) was determined by Mann-Whitney U test.
Table 3. Baseline characteristic values of NAFLD patients with or without hepatic iron deposition are presented as medians (25th to 75th percentile) for physiologic variables and laboratory values.
Baseline characteristics
NAFLD - Iron (n = 49) NAFLD + Iron (n = 26) p-value
Physiologic variables
Age(yrs) 48.00 (38.00-56.00) 51.50 (43.75-61.00) 0.13
Sex 29F/19M 7F/19M 0.008
BMI(kg/m2) 34.70 (30.40-40.40) 30.3 (28.10-35.20) 0.03
Laboratory values
CRP (mg/L) 3.70 (2.60-3.60) 2.30 (1.40-3.50) 0.0093
Ferritin (μg/L) 98.90 (60.30-241.50) 312.00 (204.00-472.00) 0.0009
Serum Iron (μg/dL) 62.00 (45.30-86.80) 83.50 (70.00-108.80) 0.0079
TIBC 371.00 (324.00-395.00) 320.00 (299.00-363.00) 0.0498
Trans Sat (%) 17.20 (12.10-24.60) 23.30 (21.30-37.30) 0.0005
Alb. (mg/dL) 4.10 (3.90-4.30) 4.30 (4.10-4.50) 0.0052
Bili (dir) (mg/dL) 0.20 (0.10-0.20) 0.20 (0.20-0.40) 0.0385
Alk. Phos. (U/L) 74.50 (63.80-94.30) 70.50 (59.30-86.30) 0.0128
AST (U/L) 38.00 (27.00-52.30) 51.00 (33.50-72.30) 0.0012
ALT (U/L) 62.50 (44.8-104.00) 78.00 (57.50-127.30) 0.0045
Total Chol. (mg/dL) 194.50 (163.00-222.30) 203.50 (185.30-232.30) 0.0399
TG (mg/dL) 149.00 (99.50-220.50) 150.50 (123.80-216.00) 0.0292
HDL (mg/dL) 38.50 (35.00-47.00) 37.00 (34.00-41.00) 0.0287
LDL (mg/dL) 111.00 (97.00-133.50) 127.00 (109.50-152.50) 0.0503
Tri/HDL 4.10 (2.30-6.00) 4.10 (3.10-6.30) 0.0250
were downregulated in NAFLD patients having hepatic iron overload relative to NAFLD patients lacking hepatic iron overload. Of these, hepatic gene expression of IL-6 and
NF-κB were significantly reduced. Further, CREBH, a
liver- specific transcription factor which is linked with ER (endoplasmic reticulum) stress, had lower expression (2.5-fold, p = 0.007) in NAFLD patients with iron over-load. Expression of TMPRSS6 (p = 0.19) and STAT3 (p = 0.97) were higher in patients who had excess hepatic iron, but not statistically significantly so (Figure 2).
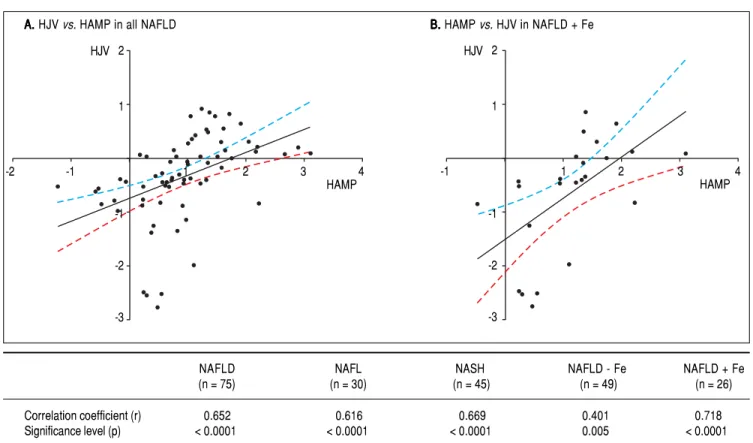
HAMP expression strongly correlates with HJV expression
Linear regression analyses were performed between the various genes that were tested, and among them, the log mRNA expression of HAMP with HJV gene were ob-served to show a positive association in a statistically sig-nificant manner. As expected, the most sigsig-nificant correlation was found in NAFLD subjects with iron over-load (r value = 0.718, p value < 0.0001) although a signifi-cant relationship was also found in all NAFLD subjects (r value = 0.652, p value < 0.0001) and all NASH subjects (r value = 0.669, p value < 0.0001) for HAMP with HJV (Figure 3).
Serum cytokine analysis in patients with NASH relative to NAFL
Of all the cytokines and chemokines measured, IL-6
(0.7 vs. 3.5 ng/mL, p = 0.0001) and IL-8 (2.6 vs. 5.6 ng/
mL, p = 0.003) were significantly elevated in NASH pa-tients relative to NAFL papa-tients. Notably, there was a significant positive correlation between serum IL-6 cy-tokine and hepatic IL-6 gene expression (r = 0.572, p < 0.0067), and between serum IL-6 levels and hepatic he-mojuvelin gene expression (r = 0.756, p < 0.0001) in NAFL patients, but not in NASH patients or NAFLD patients with or without iron overload. In addition, we
observed a positive correlation between serum TNF-α
levels and hepatic IL-6 gene expression levels (r =
0.602, p < 0.0038), and between serum TNF-α levels
and hepatic HJV gene expression (r = 771, p < 0.0001) in NAFL patients, but not in NASH patients, or NALFD patients with iron or without overload. Final-ly, we observed a positive correlation between serum IL-8 levels and hepatic IL-6 gene expression levels (r = 0.051, p = 0.018), between serum IL-8 levels and hepat-ic HJV gene expression (r = 0.804, p < 0.0001) and in between serum IL-8 levels and hepatic CREBH gene expression (r = 0.497, p = 0.021) in NAFL patients, but not in NASH patients, or NAFLD patients with or without iron overload.
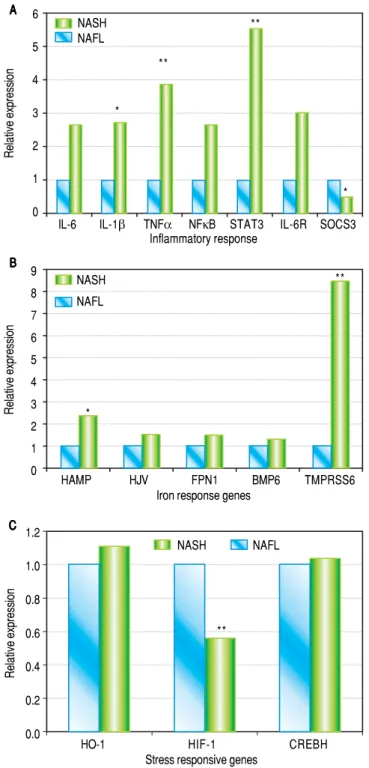
Figure 1. A. Figure 1. A.Figure 1. A. Figure 1. A.
Figure 1. A. Hepatic mRNA expression of IL-6, IL-1β, TNF, NFκB, STAT3, IL-6R and SOCS3 in patients with NASH compared to patients with NAFL. p values: IL-6: 0.15, IL-1β: 0.046, TNFα: 0.001, NFκB: 0.203, STAT3: 0.004, IL-6R: 0.12, SOCS3: 0.012. B.B.B.B.B. Hepatic mRNA expression of HAMP, HJV, FPN1, BMP6 and TMPRSS6in patients with NASH compa-red to patients with NAFLD. p values: HAMP: 0.02, HJV: 0.06, FPN: 0.22, BMP6: 0.28. TMPRSS6: 0.004. C.C.C.C.C. Hepatic mRNA expression of HO-1, HIF-1 and CREBH in patients with NASH compared to patients with NAFL. p values: HO-1: 0.89, HIF-1: 0.004 and CREBH: 0.85. All values are shown as medians and statistical significance (p < 0.05) is marked* and p < 0.01 is marked.**
Relative expression
1.2
1.0
0.8
0.6
0.4
0.2
0.0
HO-1 HIF-1 CREBH
Stress responsive genes C
C C C C B BB BB
Relative expression
9 8 7 6 5 4 3 2 1 0
HAMP HJV FPN1 BMP6 TMPRSS6
Iron response genes A
AA AA
Relative expression
6
5
4
3
2
1
0
IL-6 IL-1β TNFα NFκB STAT3 IL-6R SOCS3 Inflammatory response
NASH NAFL
* **
**
*
*
**
**
NASH NAFL
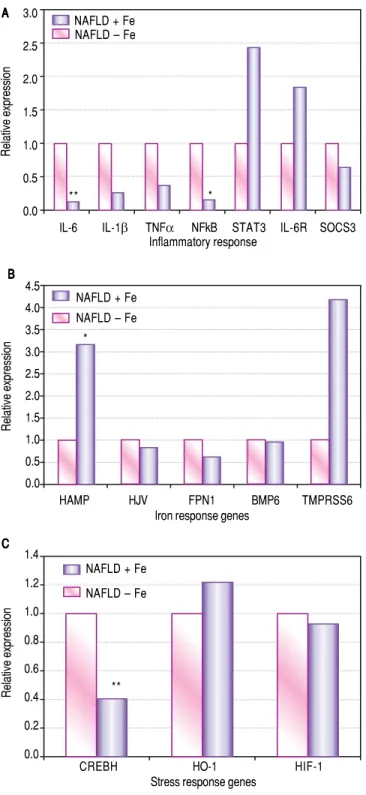
Figure 2. Figure 2. Figure 2. Figure 2.
Figure 2. Effects of excess iron in patients with NAFLD. Hepatic mRNA expression of: A. A. A. A. A. Inflammatory markers IL-6, IL-1 β, TNFα, NFκB, STAT3, IL-6R and SOCS3 (p values; IL-6: 0.008, IL-1β: 0.06, TNFα: 0.13, NFκB: 0.02, STAT3: 0.97 IL-6R: 0.29, SOCS3: 0.07). B.B.B.B.B. Iron regu-latory genes HAMP, HJV, FPN1 BMP6 and TMPRSS6 (p values; HAMP: 0.04, HJV: 0.16, FPN1: 0.51, BMP6: 0.47 and TMPRSS6: 0.19), and C.C.C.C.C. Stress-responsive genes CREBH, HO-1 and HIF-1α (p values; CREBH: 0.007, HO-1: 0.66 and HIF-1α: 0.35) in NAFLD + iron patients compared to NAFLD-iron patients. All values are shown as medians and statistical sig-nificance (p < 0.05) marked* and p < 0.01 is marked.**
Relative expression
3.0
2.5
2.0
1.5
1.0
0.5
0.0
NAFLD + Fe NAFLD – Fe
IL-6 IL-1β TNFα NFkB STAT3 IL-6R SOCS3 Inflammatory response
A A A A A
B B B B B
Relative expression
4.5 4.0 3.5 3.0 2.5 2.0 1.5 1.0 0.5 0.0
HAMP HJV FPN1 BMP6 TMPRSS6
Iron response genes NAFLD + Fe
NAFLD – Fe
C C C C C
Relative expression
1.4 1.2 1.0 0.8 0.6 0.4 0.2 0.0
CREBH HO-1 HIF-1
Stress response genes NAFLD + Fe
NAFLD – Fe
DISCUSSION
The goal of this study was to identify differential ex-pression of genes involved in iron regulation, inflamma-tion and stress response in patients with NASH compared to NAFL. This information is crucial towards identifying factors that contribute to progression of fatty liver disease. Evidence continues to accumulate strengthening the clin-icopathologic correlation between hepatic iron deposition and more specifically, its deposition pattern and progres-sion of NAFL to NASH. Iron deposition within hepatic RES cells was found to be an independent predictor of worsening fibrosis and advanced liver disease (higher
NAS score) in patients with NAFLD.5 Hepcidin is an
im-portant regulator of inflammation in the liver9,16 and along
with its key role in iron homeostasis,6 it could be playing a
vital part in NASH pathogenesis. We hypothesized that hepcidin and/or its upstream regulatory factors play a key role in progression of NAFL to NASH. Conflicting data exists regarding hepatic hepcidin expression in NAFLD
where both a decreased20 and increased expression pattern
has been reported10,21 compared to controls. In our patient
population, hepatic hepcidin expression was significantly elevated in patients with NASH compared to NAFL. Tak-en together with the increased hepatic gTak-ene expression of
inflammatory cytokines IL-6, IL-1 β and TNFα, it is
plau-sible that there is increased hepcidin expression that is attributable to its stimulation by IL-6 through the JAK2/
STAT3 pathway.9,22-25 Furthermore, the reduced gene
expression of HIF1α, a hypoxia-inducible negative
regu-lator of hepcidin,9 could have also contributed to the
upregulation of hepcidin expression in the NASH patient population.
Hepcidin expression was also found to be higher in pa-tients with hepatic iron deposition which constitutes a physiological response of the liver to decreased circulat-ing iron levels.15,16 High ferritin and low expression of
he-patic inflammatory cytokines (IL-6; 8 fold, IL-1β; 4 fold,
and NFκB; 5 fold) in patients with NAFLD containing
hepatic iron deposition could possibly be suggestive of the notion that in this cohort the increased hepcidin expression is more likely attributable to hepatic iron dep-osition rather than inflammation. In our patient popula-tion, we did not observe upregulation of SOCS3, a known
negative regulator of the JAK2/STAT3 signaling pathway26
and thereby of hepcidin, raising the possibility of other mechanisms distinct from SOCS3 being involved in sup-pression of inflammatory response. CREBH, a negative regulator of hepatic lipogenesis and a marker of ER stress, was reduced in NAFLD patients with hepatic iron deposition. This finding is consistent with previous reports that hepatic iron directly results in excess hepatic lipid load.
*
* **
Similar to hepcidin, HJV is detected predominantly in
hepatocytes.28,29 We found a strong association between
hepcidin and hemojuvelin mRNA levels in NAFLD pa-tients with hepatic iron deposition, reinforcing its role in hepcidin regulation. HJV plays a central role by interact-ing with BMP6, TMPRSS6 (also known as matriptase-2), and neogenin, in the regulation of hepatic hepcidin
ex-pression.30 Expression of TMPRSS6, a negative feedback
inhibitor of hepcidin expression,11 was significantly higher
in patients with NASH compared to NAFL. TMPRSS6 functions to suppress BMP-mediated stimulation of hep-cidin transcription through cell surface proteolytic processing of the BMP co-receptor, HJV. Increased ex-pression of TMPRSS6 in our NAFLD patient population likely represents a potential mechanism involved in the regulation of hepcidin.
Hepatic HAMP gene expression is induced in patients with NASH compared to NAFL, and presumably in re-sponse to hepatic iron excess in NAFLD patients with iron overload. Two possible mechanisms for hepcidin ex-pression in patients with NASH are likely IL-6-mediated stimulation of JAK2/STAT3 pathway, which results in up-regulation of hepcidin and reduced gene expression of
HIF1α. Furthermore, increased hepatic STAT3 gene
ex-pression in NASH patients relative to NAFL patients lends support to this putative hypothesis.
Iron deposition in livers of patients with NAFLD can be hepatocellular, reticuloendothelial, or both. A study of 849 adult biopsy specimens, performed in the United States by us, observed that reticuloendothelial patterns of iron deposition was associated with advanced fibrosis compared with hepatocellular iron. Biopsy specimens with reticuloendothelial iron were also more likely to have definite steatohepatitis.5 However, an Italian study of
587 patients with NAFLD found that hepatocellular rather than reticuloendothelial iron was associated with an
in-creased likelihood of fibrosis.31 The discordant results
may be explained by differences in the patient popula-tions; the subjects in the US study were more ethnically diverse and had higher body mass indices and more ad-vanced fibrosis than those in the Italian study. Interactions between iron metabolism and NAFLD are complex and under active investigation by others and us.
In this study, we found increased expression levels of in hepcidin in both NAFLD patients with iron and NASH patients. In our studies, the increased hepcidin levels
mit-Figure 3. Figure 3.Figure 3.
Figure 3.Figure 3. Linear regression in all NAFLD subjects (n = 75) are shown in (AAAAA) and in NAFLD patients with hepatic iron overload (NAFLD + Fe) (n = 26) (BBBBB). The regression line obtained with best fitted values and 95% confidence interval is shown. The table shows correlation coefficients between the log hepcidin mRNA and HJV mRNA in the various study groups. The r and p values are shown for each correlation and linear regression analysis. Since multiple analyses were performed, the cutoff was adjusted based on the Bon Ferroni equation to p < 0.01.
NAFLD NAFL NASH NAFLD - Fe NAFLD + Fe
(n = 75) (n = 30) (n = 45) (n = 49) (n = 26)
Correlation coefficient (r) 0.652 0.616 0.669 0.401 0.718
Significance level (p) < 0.0001 < 0.0001 < 0.0001 0.005 < 0.0001
A. A. A. A.
A. HJV vs. HAMP in all NAFLD B. B. B. B. B. HAMP vs. HJV in NAFLD + Fe 2
1
-1
-2
-3
-2 -1 1 2 3 4
HAMP
HJV 2
1
-1
-2
-3
-1 1 2 3 4
igate inflammatory responses through a different pathway other than the well-studied SOSC3 mechanism. Though there is an increase in hepcidin levels in NASH patients, which could be in response to hepatic iron or increase in IL-6/STAT3 or decrease in HIFa, or a combination of these influences, we believe that increase in TMPRSS6, a negative regulator of hepcidin, could have hindered the anti-inflammatory properties of hepcidin and contributed to the transition of NAFL to NASH. However, further studies are required to confirm the anti-inflammatory role of hepcidin, to identify the pathway by which it mitigates the inflammatory response and to identify the mechanism by which TMPRSS6 influences hepcidin expression and interferes with its anti-inflammatory effect in NASH pa-tients. We propose that further studies in a larger inde-pendent cohort would increase our understanding of the pathogenesis of NASH and possible pharmacological so-lutions. Further, undertaking an unbiased approach and performing RNA-seq on NAFL/NASH/ NAFLD with iron overload populations will allow us to uncover novel regulatory proteins associated with this complex disease.
While this study has provided us with a number of im-portant insights regarding the regulatory pathways such as iron homeostatic pathways, inflammation and stress re-sponses that could be influencing NAFL to NASH patho-genesis and provided us with information about pathways that could be targeted, there are several limitations of the
study, in that, we did not perform an a priori power
calcu-lation, since we had sufficient numbers of patients to per-form a powered study. In addition, we did not record the intake of iron from both dietary sources and supplements. No information was collected on other medication and diseases that may affect iron metabolism. Our study is also limited by the lack of serum hepcidin measurements and HFE genotyping, which may have provided additional val-uable insights into hepatic iron regulation in our patient population.
In conclusion, we observed that HAMP expression is elevated in NASH patients and in NAFLD patients with hepatic iron deposits. Our data allowed us to study the interdependence of various regulatory signals such as he-patic iron stores, inflammation and hypoxia or oxidative/ ER stress on the expression of hepcidin and inflammato-ry cytokines. It is likely that the increased hepcidin ex-pression is a protective response, which attempts to sequester excess iron thereby reducing oxidative stress. This effect might also play a role in mitigating the in-flammatory response as seen in our NAFLD patients with hepatic iron overload. Examination of hepcidin reg-ulatory mechanisms in a larger patient population will help us to understand the pathogenesis of NASH and in turn help identify potential ‘druggable’ targets to halt its progression.
ABBREVIATIONS
• ALT: alanine transaminase.
• AST: aspartate transaminase.
• BMI: body mass index.
• BMP: bone morphogenetic protein.
• CREBH: cAMP responsive element-binding protein, hepatocyte specific.
• ER: endoplasmic reticulum.
• FPN: ferroportin.
• GAPDH: glyceraldehyde phosphate dehydrogenase. • HAMP: hepatic antimicrobial peptide.
• HIF1ααααα: hypoxia inducible factor 1α.
• HJV: hemojuvelin.
• HNE: 4-hydroxy-2-nonenal.
• HO-1: hemeoxygenase 1.
• JAK: Janus kinase.
• MDA: malondialdehyde.
• NAFL: nonalcoholic fatty liver.
• NAFLD: nonalcoholic fatty liver disease.
• NAS: NAFLD activity score.
• NASH: nonalcoholic steatohepatitis. • PUFAs: polyunsaturated fatty acids. • RES: Reticuloendothelial system. • SMAD: Sma and Mad related proteins. • SOCS3: suppressor of cytokine signaling 3.
• STAT3: signal transducer and activator of transcrip-tion 3.
• TIBC: total iron binding capacity.
• TMPRSS6: transmembrane serine protease 6.
REFERENCES
1. Rinella ME. Nonalcoholic fatty liver disease: a systematic re-view. JAMA 2015; 313: 2263-73.
2. Nelson JE, Klintworth H, Kowdley KV. Iron metabolism in Nonalcoholic Fatty Liver Disease. Curr Gastroenterol Rep 2012; 14: 8-16.
3. Nelson JE, Brunt EM, Kowdley KV. Nonalcoholic Steatohepa-titis Clinical Research Network. Lower serum hepcidin and greater parenchymal iron in nonalcoholic fatty liver disease patients with C282Y HFE mutations. Hepatology 2012; 56: 1730-40.
4. Nelson JE, Bhattacharya R, Lindor KD, Chalasani N, Raaka S, Heathcote EJ, Miskovsky E, et al. HFE C282Y mutations are associated with advanced hepatic fibrosis in Cauca-sians with nonalcoholic steatohepatitis. Hepatology 2007; 46: 723-9.
5. Nelson JE, Wilson L, Brunt EM, Yeh MM, Kleiner DE, Unalp-Arida A, Kowdley KV. Relationship between the pattern of hepatic iron deposition and histological severity in nonalco-holic fatty liver disease. Hepatology 2011; 53: 448-57. 6. Nemeth E, Tuttle MS, Powelson J, Vaughn MB, Donovan A,
Ward DM, Ganz T, et al. Hepcidin regulates cellular iron ef-flux by binding to ferroportin and inducing its internalization. Science 2004; 306: 2090-3.
signal-ing by hemojuvelin regulates hepcidin expression. Nat Genet 2006; 38: 531-9.
8. Verga Falzacappa MV, Vujic SM, Kessler R, Stolte J, Hentze MW, Muckenthaler MU. STAT3 mediates hepatic hepcidin ex-pression and its inflammatory stimulation. Blood 2007; 109: 353-8.
9. Nicolas G, Chauvet C, Viatte L, Danan JL, Bigard X, Devaux I, Beaumont C, et al. The gene encoding the iron regulatory peptide hepcidin is regulated by anemia, hypoxia, and in-flammation. J Clin Invest 2002; 110: 1037-44.
10. Zimmermann A, Zimmermann T, Schattenberg J, Pottgen S, Lotz J, Rossmann H, Roeddiger R, et al. Alterations in lipid, carbohydrate and iron metabolism in patients with non-alco-holic steatohepatitis (NASH) and metabolic syndrome. Eur J Intern Med 2011; 22: 305-10.
11. Nai A, Pagani A, Silvestri L, Campostrini N, Corbella M, Girelli D, Traglia M. TMPRSS6 rs855791 modulates hepcidin tran-scription in vitro and serum hepcidin levels in normal individ-uals. Blood 2011; 118: 4459-62.
12. Choi SO, Cho YS, Kim HL, Park JW. ROS mediate the hypoxic repression of the hepcidin gene by inhibiting C/EBPalpha and STAT-3. Biochem Biophys Res Commun 2007; 356: 312-7. 13. Pinto JP, Ribeiro S, Pontes H, Thowfeequ S, Tosh D,
Carval-ho F, Porto G. Erythropoietin mediates hepcidin expression in hepatocytes through EPOR signaling and regulation of C/EB-Palpha. Blood 2008; 111: 5727-33.
14. Harrison-Findik DD, Schafer D, Klein E, Timchenko NA, Ku-laksiz H, Clemens D, Fein E, et al. Alcohol metabolism-mediat-ed oxidative stress down-regulates hepcidin transcription and leads to increased duodenal iron transporter expres-sion. J Biol Chem 2006; 281: 22974-82.
15. Aigner E, Theurl I, Theurl M, Lederer D, Haufe H, Dietze O, Strass-er M, et al. Pathways undStrass-erlying iron accumulation in human nonal-coholic fatty liver disease. Am J Clin Nutr 2008; 87: 1374-83. 16. Barisani D, Pelucchi S, Mariani R, Galimberti S, Trombini P,
Fumagalli D, Meneveri R, et al. Hepcidin and iron-related gene expression in subjects with Dysmetabolic Hepatic Iron Overload. J Hepatol 2008; 49: 123-33.
17. Bekri S, Gual P, Anty R, Luciani N, Dahman M, Ramesh B, Iannelli A, et al. Increased adipose tissue expression of hep-cidin in severe obesity is independent from diabetes and NASH. Gastroenterology 2006; 131: 788-96.
18. Demircioglu F, Gorunmez G, Dagistan E, Goksugur SB, Bek-das M, Tosun M, Kizildag B, et al. Serum hepcidin levels and iron metabolism in obese children with and without fatty liv-er: case-control study. Eur J Pediatr 2014; 173: 947-51. 19. Brunt EM, Kleiner DE, Wilson LA, Belt P, Neuschwander-Tetri
BA; NASH Clinical Research Network (CRN). Nonalcoholic fatty liver disease (NAFLD) activity score and the his-topathologic diagnosis in NAFLD: distinct clinicopathologic meanings. Hepatology 2011; 53: 810-20.
20. Mitsuyoshi H, Yasui K, Harano Y, Endo M, Tsuji K, Minami M, Itoh Y, et al. Analysis of hepatic genes involved in the
me-tabolism of fatty acids and iron in nonalcoholic fatty liver dis-ease. Hepatol Res 2009; 39: 366-73.
21. Senates E, Yilmaz Y, Colak Y, Ozturk O, Altunoz ME, Kurt R, Ozkara S, et al. Serum levels of hepcidin in patients with bi-opsy-proven nonalcoholic fatty liver disease. Metab Syndr Relat Disord 2011; 9: 287-90.
22. Wrighting DM, Andrews NC. Interleukin-6 induces hepcidin expression through STAT3. Blood 2006; 108: 3204-9. 23. Pietrangelo A, Dierssen U, Valli L, Garuti C, Rump A,
Corradi-ni E, Ernst M, et al. STAT3 is required for IL-6-gp130-de-pendent activation of hepcidin in vivo. Gastroenterology 2007; 132: 294-300.
24. Blanchette NL, Manz DH, Torti FM, Tort SV. Modulation of hepcidin to treat iron deregulation: potential clinical applica-tions. Expert Rev Hematol 2016; 9: 169-86.
25. Zhao N, Zhang AS, Enns CA. Iron regulation by hepcidin. J Clin Invest 2013; 123: 2337-43.
26. De DI, Zhang TY, Koening CL, Branch RW, London N, Lo E, Daynes RA, et al. Hepcidin mediates transcriptional changes that modulate acute cytokine-induced inflammatory respons-es in mice. J Clin Invrespons-est 2010; 120: 2395-405.
27. Cabrita M, Pereira CF, Rodrigues P, Cardoso EM, Arosa FA. Altered expression of CD1d molecules and lipid accumula-tion in the human hepatoma cell line HepG2 after iron loading. FEBS J 2005; 272: 152-65.
28. Niederkofler V, Salie R, Arber S. Hemojuvelin is essential for dietary iron sensing, and its mutation leads to severe iron overload. J Clin Invest 2005; 115: 2180-6.
29. Zhang AS, Yang F, Wang J, Tsukamoto H, Enns CA. Hemoju-velin-neogenin interaction is required for bone morphogenic protein-4-induced hepcidin expression. J Biol Chem 2009; 284: 22580-9.
30. Zhang AS, Gao J, Koeberl DD, Enns CA. The role of hepato-cyte hemojuvelin in the regulation of bone morphogenic pro-tein-6 and hepcidin expression in vivo J Biol Chem 2010; 285: 16416-23.
31. Valenti L, Fracanzani AL, Bugianesi E, Dongiovanni P, Gal-mozzi E, Vanni E, Canavesi E, et al. HFE genotype, parenchy-mal iron accumulation, and liver fibrosis in patients with nonalcoholic fatty liver disease. Gastroenterology 2010; 138: 905-12.
Correspondence and reprint request:
Kris V. Kowdley, M.D.
Swedish Liver Care Network and Organ Care Research. Swedish Medical Center.
1124 Columbia St., Suite 600. Seattle, WA 98104. Tel.: 206-386-3606. Fax: 206-215-2126