Dynamic Tuning of Parallel Programs
A. Morajko, A. Espinosa, T. Margalef, E. Luque
Dept. Informática, Unidad de Arquitectura y Sistemas Operativos Universitat Autonoma de Barcelona
08193 Bellaterra, Barcelona SPAIN
{tomas.margalef, antonio.espinosa, emilio.luque}@uab.es
Abstract— Performance of parallel programs is one of the reasons of their development. The process of designing and programming a parallel application is a very hard task that requires the necessary knowledge for the detection of performance bottlenecks, and the corresponding changes in the source code of the application to eliminate those bottlenecks. Current approaches to this analysis require a certain level of expertise from the developers part in locating and understanding the performance details of the application execution. For these reasons, we present an automatic performance analysis tool with the objective of alleviating the developers of this hard task: Kappa Pi. The most important limitation of KappaPi approach is the important amount of gathered information needed for the analysis. For this reason, we present a dynamic tuning system that takes measures of the execution on-line. This new design is focused to improve the performance of parallel programs during runtime.
Keywords—Performance. Dynamic Instrumentation. Trace File. Performance Analysis. Performan-ce Tuning.
1. Introduction.
Developers of parallel programs face up to many problems that must be solved if such systems are to fulfill their promises. A key feature of parallel programs is good performance. System will be useless and inappropriate when its performance is under acceptable limits. However, there is a significant gap between peak and realized performance of parallel applications. This situation indicates the need for the optimization of the behavior of parallel programs. In this context the essential task is a performance analysis. This analysis is not a trivial task, especially as parallel computing evolves from homogeneous parallel systems to distributed heterogeneous systems. Therefore, a good, reliable and simply performance analysis tool is necessary to provide developer with appropriate and sufficient information about the behavior of a parallel system.
Although visualization tools based on the traditional approach are often very helpful, developer must have a great knowledge of parallel systems and experience in performance analysis in order to improve the application behavior.
Therefore, with the aim of reducing developer efforts, especially to relieve him of some duties such as analysis of graphical information and determination of performance problems, an automatic parallel program analysis has been proposed, named KappaPi [5]. Tools using this type of post-mortem analysis are based on the knowledge of well-known performance problems. Such tools are able to identify critical bottlenecks and help in optimizing applications by giving suggestions to developers. These hints or recommendations expose the performance problems and offer developers possible program performance improvements.
Other similar tools have been developed with a very similar objective, like Paradise [6], AIMS[7] and Paradyn [8].
Paradise [6] (PARallel programming ADvISEr) represents a similar approach to KappaPi one. This tool analyzes trace files building event graph and finds program characteristics and problems. Then it uses heuristics to find possible solutions to optimize a program performance. Finally, Paradise generates hints saving them to a file. This tool is not able to combine problems with a source code.
AIMS [7] (an Automated Instrumentation and Monitoring System) also applies similar methods as tools mentioned above. AIMS consists of three main components: a source code instrumentor, a run-time performance monitoring library and a set of tools that process the performance data.
Paradyn [8] provides automatic, dynamic analysis “on the fly”. This tool does not require any trace file of execution of a program. It takes advantages of a special monitoring technique called dynamic instrumentation. Paradyn automatically inserts and modifies instrumentation during program execution. It also provides automatic searching for the performance problems using the W3 search model (when, where and why a performance problem has occurred). Moreover, Paradyn contains a tool to visualize the results in real-time.
KappaPi [5] (Knowledge-based Automatic Parallel Program Analyzer for Performance Improvement) is a new step in the automatic performance analysis, KappaPi tool focuses in detecting and analysing some typical performance problems of the parallel applications. KappaPi detects problems studying trace files generated by the Tape/PVM [1] tool. Then it classifies found problems using a “knowledge base” of performance problems. The knowledge base is represented as a problem tree. KappaPi can combine a found problem with the portion of source code that generated this problem. It also provides explanation of problems and recommended code changes. This tool is the starting point for the dynamic analysis work presented in this paper.
present the particular implementation of the monitoring module. In section 5, we are describing our future work and, finally, in section 6 we are presenting the conclusions of this work.
2. Automatic analysis of parallel programs
KappaPi analysis tool uses some steps, shown in figure 1, to analyse the performance of a parallel application. Kappa Pi initial source of information is the trace file obtained from an execution of the application. First of all, the trace events are collected and analysed in order to build a summary of the efficiency along the execution interval in study. This summary is based on the simple accumulation of processor utilization versus idle and overhead time. The tool keeps a table with those execution intervals with the lowest efficiency values (higher number of idle processors). These intervals are saved according to the processes involved, so that any new inefficiency found for the same processes is accumulated.
TRACE
Knowledge Base
Application Code
Suggestions
KappaPi Tool
Problem Detection
Problem Classification
[image:3.595.140.451.289.456.2]Source Code Analysis
Fig 1: KappaPi automatic analysis steps.
At the end of this initial analysis we have an efficiency index for the application that gives an idea of the quality of the execution. On the other hand, we also have a final table of low efficiency intervals that allows us to start analyzing why the application does not reach better performance values.
The next stage in the Kpi analysis is the classification of the most important inefficiencies selected from the previous stage. The trace file intervals selected contain the location of the execution inefficiencies, so their further analysis will provide more insight of the behavior of the application. In order to know which kind of behavior must be analysed, Kpi tool classifies the selected intervals with the use of a rule-based knowledge system. The table of inefficiency intervals is sorted by accumulated wasted time and the longest accumulated intervals will be analysed in detail. Kpi takes the trace events as input and applies the set of behavior rules deducing a new list of deduced facts. These rules will be applied to the just deduced facts until the rules do not deduce any new fact. The higher order facts (deduced at the end of the process) allow the creation of an explanation of the behavior found to the user.
"quick parsers" that look for very specific source information to complete the performance analysis description.
This first analysis of the application execution data derives an identification of the most general behavior characteristic of the program. The second step of this analysis is to use this information about the behavior of the program to analyse the performance of this particular application. The program, as being identified of a previously known type, can be analysed in detail to find how can it be optimized for the current machine in use.
Taking both kinds of analysis (classical and automatic) into consideration, we see the superiority and advantages of automatic analysis. However, none of these approaches exempts developer from intervention to a source code. Each tool that has been mentioned above requires developer to change a source code, re-compile, re-link and restart the program. Moreover, except Paradyn, each of them needs a trace file either to visualize a program execution or to make an automatic analysis.
For all these reason, a new idea has arisen. The best possible solution for developers would be to replace post-mortem analysis with automatic real-time optimization of a program. Instead of manual changes of a source code, it could be very profitable and beneficial to provide an automatic tuning of a parallel program during run-time. Such approach would require neither a developer intervention nor even access to the source code of the application. The running parallel application would be automatically traced, analyzed and tuned without need to re-compile, re-link and restart.
When a post-mortem tuning is used it must be considered that the tuning for a particular run can be useless for another execution of the application. It implies that it is necessary to select some representative runs for tuning the application. Using the automatic tuning, it would be possible to tune the application in all the executions.
3. Dynamic Monitoring System Architecture
The next goal of the system is automatically improve the performance of parallel programs during run-time. Conceptually, the system must be able to support the following services:
• dynamic tracing of the execution of a parallel program including ability to change the set of traced events during run-time.
• automatic performance analysis “on the fly” including provision of solutions and suggestions for a user. This service will replace the classical analysis post-mortem.
• automatic program tuning during run-time. This service will relieve the developer of the source code modification duties.
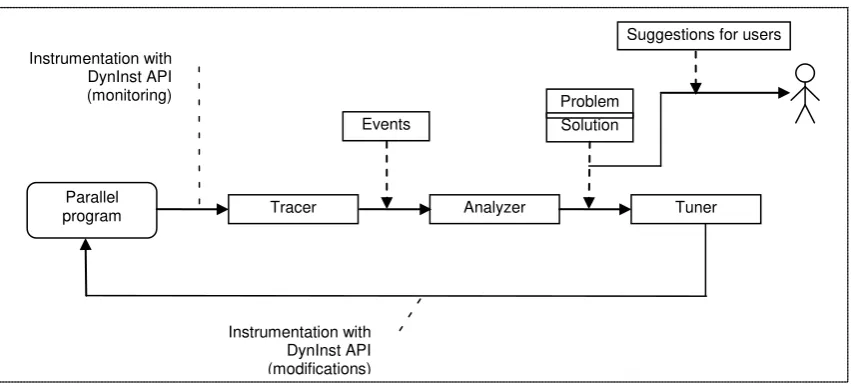
Fig.2. Conceptual dynamic tuning system architecture.
Moreover, the program can be modified during its execution and does not need to be re-compiled, re-linked and restarted. Taking advantage of these capabilities we provide dynamic tracing and tuning of parallel program “on the fly”. The conceptual architecture of our system is shown in the figure 2. In relation to the analysis steps required for the off-line analysis (figure 1) the main steps of the analysis are basically the same. In this case, there is a tracer module that provides some details of the execution to the analyzer. This tracer is not generating a full trace, but a subset of relevant program actions that affect performance. The analyzer module is in charge of detecting inefficiencies and to analyze the possible causes, presenting a suggestion to the user. Additionally, a new tuner module is in charge of introducing the automatic changes to the application source code depending on the problem found.
Basically, our dynamic tuning system is formed of three main modules, namely: 1. Tracer
This module monitors the execution of a parallel program during its runtime. It generates events that happened in the program. This module uses dynamic instrumentation approach. It supports automatic and interactive specifying the instrumentation before the parallel application start, as well as during its execution. Dynamic tracer is described with more details in the section III. 2. Analyzer
This module is responsible for automatic performance analysis of a parallel program “on the fly”. Among events generated by the tracer, analyzer finds performance bottlenecks and then it determines possible solutions. Detected problems and recommended solutions are reported to the user.
3. Tuner
This module automatically tunes a parallel program. It utilizes solutions given by the analyzer and improves the program performance manipulating in the executable. It does need neither access a source code nor program restart.
Current system implementation is dedicated to PVM-based applications [9]. However, the system architecture is open and may be applied for applications that use other message passing communication libraries. In general, the parallel application environment usually collects several computers of different architectures. A parallel application consists of several intercommunicating tasks that solve the common problem. Tasks are mapped on a set of computers and hence each task may be physically executed on a different machine.
Parallel
program Tracer
Suggestions for users
Problem Solution
Tuner Events
Instrumentation with DynInst API (modifications)
Analyzer Instrumentation with
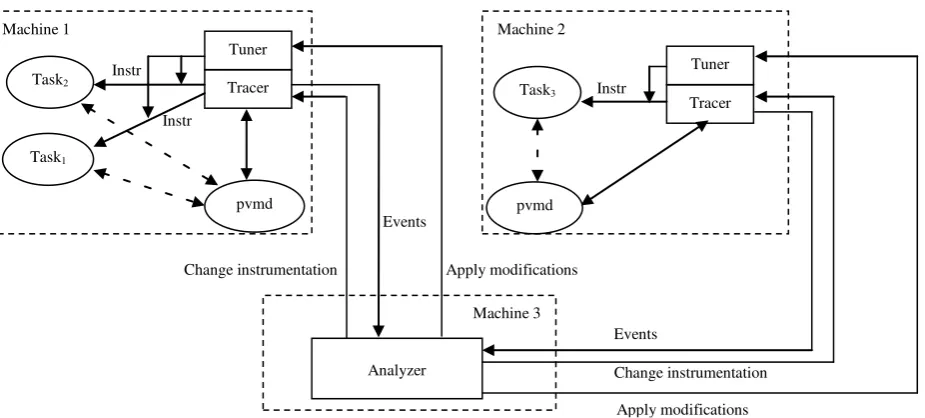
This situation means that it is not enough to improve tasks separately without considering global application view. To improve the performance of entire application, we need to access global information about all tasks on all machines. The parallel application tasks are executed physically on distinct machines and our performance analysis system must be able to control all of them. To achieve this goal, we need to distribute the modules of our dynamic tuning tool to machines where application tasks are running. Consequently, to monitor all the tasks inserting instrumentation, our system runs a separate tracer module for each considered machine. A scheme of the dynamic tuning tool design is shown in figure 3.
The tracer distribution indicates that events of different tasks are collected on different machines. However, our approach to dynamic analysis requires the global and ordered trace events and thus we have to send all events to a central location. Analyzer module can reside on a dedicated machine collecting events from all distributed tracers. The analysis is supposed to be time-consuming, what can significantly increase the application time execution if both – analysis and application - are running on the same machine. In order to reduce intrusion, the analysis should be executed on the dedicated and distinct machine.
[image:6.595.64.527.418.627.2]Analysis must be done globally with taking into consideration behavior of entire application. Therefore, analyzer collects all events and orders them globally. Then it processes collected events finding potential problems and solutions. Obviously, during the analyzer computation, tracer modules can still monitor the application. Analyzer may need more information about program execution to detect a problem. Thus, it can request tracer to change the instrumentation dynamically.
Fig. 3. Dynamic tuning system design.
Consequently, tracer must be able to modify program instrumentation – add more or remove redundant – depending on needs to detect performance problems The last module – tuner – automatically modifies the application during run-time. It is based on knowledge of mapping problem solutions to code changes. Therefore, when a problem has been detected and the solution has been given, tuner must find appropriate modifications and apply them dynamically into the executable. Applying of modifications needs access to the appropriate task, hence tuner must be distributed on different machines.
In the next section, the design of the dynamic tracer is described in more detail.
Apply modifications Apply modifications
Change instrumentation Events
Change instrumentation Machine 1
Task1
Machine 2
Task3
pvmd pvmd
Machine 3
Analyzer Instr
Instr
Tuner
Tracer Instr
Tuner
Tracer
4. Dynamic Tracer
Tracer is implemented in C++ language and, as we have mentioned in the previous section, it is responsible for tracing the execution of any parallel program dynamically – during runtime. The monitoring of the parallel program is performed with dynamic instrumentation technique. Therefore, our tool is capable of tracing programs on the fly, does not require the program to be instrumented before execution, and moreover does not even require the access to the source code.
To collect events that happen during execution of the program, tracer makes special changes – so called instrumentation – in the original program execution. The instrumentation can be specified interactively by a user before program execution, or can be changed dynamically during run-time. In the following subsections we describe details concerning tracer design and implementation.
A. Tasker/Hoster
The duty of our tracer module is to collect all necessary events that happen during execution of the PVM parallel application. We have already discussed the need for monitoring all tasks of the instrumented parallel program, as well as the control of all these workstations where the tasks are running. To provide these capabilities we take control over creation of a new PVM-task and start of a slave PVM-daemon. Our tracer utilizes two specific PVM services.
First service, called tasker, is responsible for spawning other tasks on the same workstation. A process that wants to be a tasker must register itself to its local PVM daemon. After that it can receive messages from a daemon with the request to create a new task on the local machine. This service allows us to control all tasks on a single machine.
[image:7.595.173.405.565.746.2]Second service is called hoster and performs startup of a slave PVM daemon on a remote workstation. A process that wants to be a hoster must also register itself to its local PVM daemon. Then it is able to receive messages from a daemon with the request to create a new daemon on a remote host. Hoster enables us to control all machines where PVM application tasks are running.
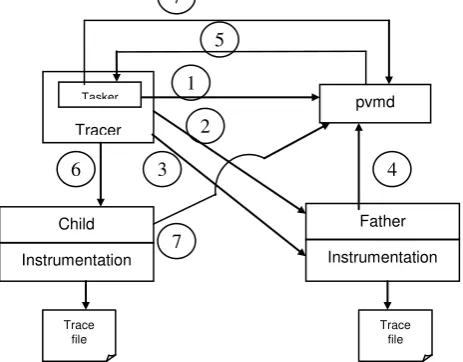
Figure 4 and the following description show more details of the tasker service used in our system.
Fig.4. An example scenario: the start of a traced parallel program.
Trace file
Child
2
4
Tracer
Instrumentation
7
Trace file
Tasker 1
5
6
Father
Instrumentation pvmd
To start a new process, the tracer must be a tasker. Thus, it includes special module that executes the tasker job. This module connects to the local pvmd and registers itself as a PVM task starter (1). After the registration, tracer, as a tasker, starts the parallel application by creating the father process (2). When the father is created, tracer inserts the appropriate instrumentation and then allows the process to execute (3). According to the PVM foundations, the father process while performing its computations usually spawns some number of child processes. When it wants to create a new child process, it sends spawn request to a local PVM daemon (4). The PVM daemon receives the request, checks if there is a registered tasker and passes the spawn message to the tasker (5).
The tracer (that is the tasker) creates a new child process and automatically instruments this new task (6). Finally, the new process registers itself with the PVM daemon as a PVM-task (7).
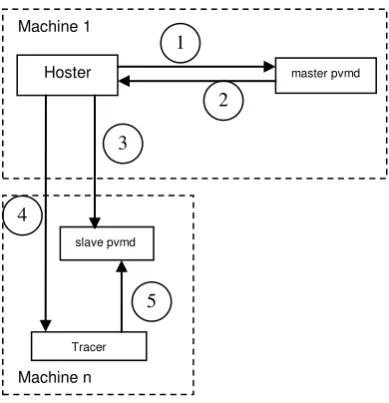
[image:8.595.183.418.301.428.2]Figure 5 and the following description present more details of the hoster service used in our system.
Fig.5. The start of a slave PVM daemon with the hoster service.
The PVM virtual machine can have only one hoster. The hoster is a singleton distinct application started before the start of the tracer program. The hoster must reside on the same machine as the master PVM daemon and it must register itself with this daemon (1). When master PVM daemon receives a request to create a new PVM daemon, it checks if there is a registered hoster and passes the message to the hoster (2). The hoster starts a new slave PVM daemon process on a given remote machine (3). Next, the hoster creates a new tracer process on the same remote machine (4). The new tracer follows the same steps (5) as described before in the tasker part.
B. Dynamic Instrumentation
Dynamic instrumentation was firstly used in Paradyn tool. In order to build an efficient automatic analysis tool, the Paradyn group developed a special API that supports this new approach. The result of their work is called DynInst API [10].
DynInst is an API for runtime code patching. It provides a C++ class library for machine independent program instrumentation during application execution. DynInst API allows users to attach to an already running process or start a new process, create a new bit of code and finally insert created code into a running process. The next time the instrumented program executes the block of code that has been modified, the new code is executed in addition to the original one. Moreover, the program being modified is able to continue execution and doesn’t need to be re-compiled, re-linked, or restarted. DynInst manipulates on an executable and thus this library needs access only to a running program, not to its source code. However, DynInst requires instrumented program to contain debug information.
Tracer
execute Points
Building snippets
API
DynInst code
pvm_send begin ... end
Log event snippet
We take advantages of dynamic instrumentation to monitor a parallel program and collect events that happened during program execution. As we have mentioned before, our system inserts and changes the program instrumentation during run-time. Our tracer instruments the program via DynInst library. This API is based on the following abstractions:
• point – a location in a program where instrumentation can be inserted, i.e. function entry, function exit
• snippet – a representation of a bit of executable code to be inserted into a program at a point; snippet must be build as an AST (Abstract Syntax Tree)
[image:9.595.193.388.341.543.2]Using appropriate DynInst API class and methods, tracing module creates the father and children processes. During process creation, DynInst automatically attaches to the process its own run-time library and allocates space for snippets. Tracer builds snippets and then DynInst inserts these snippets into the memory of the process at the given (by the user) points. Figure 6 presents the main concept of using DynInst.
Fig.6. Dynamic instrumentation of an application using DynInst.
The logging snippet may be inserted at arbitrary points, for instance at the entry of pvm_send and pvm_recv functions. The collection of events consists of the following steps:
1. opens trace file – using snippet that is executed once after the father/child process was created 2. writes to trace file – using snippet that is inserted into entry of every function to be traced; when
this function is executed, the snippet code writes an appropriate event to the trace file
3. closes trace file – using snippet that is executed at the end of the main function of the process
Currently, the implementation of our tracer creates trace files. Each event consists of three elements: timestamp, event type that identifies the function that produced the event, and finally parameters of this function. Each process of the parallel program generates its own trace file. After execution of the program, tracer enables the user to join all the files into one global trace file. Event dating is causally coherent because of the use of a global clock algorithm [11].
5. Future Work
Machine 1
Hoster master pvmd 1
2
Machine n
Tracer slave pvmd
5 3
Currently we are continuing our work under the tracer module. We must extend it with the capabilities of sending events to a central location instead of generating trace files. Moreover, current version of tracer requires us to manually collect all generated trace files and after that provides us with the one global trace file. Final version must collect events and order them during run-time.
Future work on the system will focus on the interactions between both modules: analyzer and tuner. Analyzer must receive events generated by tracer, and find the performance bottlenecks in the same sense that the trace file based tool does. Its objective is also to provide some solutions to those performance problems found. In addition, analyzer must be in cooperation with tracer to send requests about the instrumentation required for every particular performance problem found. In the long run, the tuner module will use solutions given by the analyzer, find appropriate modifications and apply them dynamically in the executable.
6. Conclusions
The performance of parallel applications is one of the crucial issues to parallel programming. This implies the need for the optimization and the analysis of the behavior of a program. In this paper we have reviewed approaches to the performance analysis and corresponding tools. We have briefly surveyed difficult duties that are in the developer’s hands while using traditional tools. Current situation requires a developer to manually analyze the program behavior finding potential problems and solutions and change the source code.
We have presented a performance analysis tool, Kappa Pi, that uses a new perspective to the performance analysis of parallel programs. The methodology used has been presented, together with their limitations. To overcome those limitations, our goal is to develop a system that automatically and dynamically tunes parallel applications. Therefore, the main objective of our tool is to improve the performance of parallel programs during run-time. We have described the conceptual design of our dynamic tuning system and used techniques. By applying a dynamic instrumentation method, we are able to trace, analyze and tune a parallel program during its run-time. Moreover our tool does not require an access to source code. By providing automatic tuning of parallel programs during their executions, developers are relieved from duties of analyzing of program behavior, as well as from intervention into a source code.
7. References
[1] E. Maillet: TAPE/PVM an efficient performance monitor for PVM applications – User guide. LMC-IMAG, Grenoble, France, June 1995.
[2] W. Nagel, A. Arnold, M. Weber, H. Hoppe: VAMPIR: Visualization and Analysis of MPI Resources. Supercomputer 1 pp. 69-80, 1996.
[4] M. Heath, J. Etheridge: Visualizing the Performance of Parallel Programs. IEEE Computer, vol. 28, pp. 21-28, November 1995.
[5] A. Espinosa, T. Margalef, E. Luque: Análisis automático del rendiminto de ejecución de los programas paralelos. Congreso Nacional Argentino sobre las ciencias de la computación. (CACIC '98)
[6] S. Krishnan, L.V. Kale: Automating Parallel Runtime Optimizations Using Post-Mortem Analysis. International Conference on Supercomputing, pp. 221-228, 1996.
[7] J. Yan, S. Sarukhai: Analyzing Parallel Program Performance Using Normalized Performance Indices and Trace Transformation Techniques. Parallel Computing, vol. 22, pp. 1215-1237, 1996.
[8] J. K. Hollingsworth, B. P. Miller: Dynamic Control of Performance Monitoring on Large Scale Parallel Systems. International Conference on Supercomputing, Tokyo, July 1993.
[9] A. Geist, A. Beguelin, J. Dongarra, W. Jiang, R. Manchek, V. Sunderam: PVM: Parallel Virtual Machine, A User´s Guide and Tutorial for Network Parallel Computing. MIT Press, Cambridge, MA, 1994.
[10] J.K. Hollingsworth, B. Buck: Paradyn Parallel Performance Tools, DyninstAPI Programmer’s Guide. Release 2.0, University of Maryland, Computer Science Department, April 2000.