Software Process Improvement Behavior of Small and Medium
Organizations in Argentina
Pedro E. Colla
FRSF – UTN -- Lavaise 610 – (3004) Santa Fe - Argentina ([email protected])
GCC Córdoba, EDS Argentina - Av. V. Interior 7050 - (5000) Córdoba-Argentina ([email protected])
and
Jorge Marcelo Montagna
INGAR-UTN-Avellaneda 3657-(3004) Santa Fe- Argentina ([email protected])
Abstract.
This paper reports on a research work performed on data extracted from the 2007 Annual CESSI survey among Argentina software development organizations. Although SPI has been researched before little data exists about the behavior of organizations in Argentina. The analysis provides insights on the profile of the companies regarding Software Process Improvement (SPI) trends, their motivations and drivers. The conclusions can be used to understand what drivers facilitate SPI adoption by SME organizations in order to increase their competitiveness in domestic and off-shore markets.
Resumen.
Este artículo reporta el trabajo de investigación realizado en base a datos extraídos de la Encuesta Anual realizada por la CESSI durante el año 2007 entre organizaciones dedicadas al desarrollo de Software en Argentina. Si bien la temática de mejora de procesos de software há sido investigada previamente muy pocos datos existen sobe el comportamiento de organizaciones en Argentina. El análisis realizado contribuye a la comprensión del perfil de las organizaciones en cuanto a las tendencias de Mejora de Procesos de Software, las motivaciones que las movilizan y los facilitadores de estas iniciativas. Las conclusiones pueden ser utilizadas para entender que facilitadores mejoran la adopción de iniciativas de mejora por parte de organizaciones PyME de forma que incrementen su competitividad en los mercados domésticos y off-shore.
Keywords
Introduction
The research was carried out using the data gathered during the 2007 CESSI1 Survey among
software organizations in Argentina. In these software organizations activities are held for development of standard products and customized implementations, update and maintenance of existing products as well as embedded applications for electronic devices. Software size and complexity are increasing rapidly and the total software staff is growing continuously; still, most
of the work is performed at Small and Medium Enterprises 2 (SMEs) organizations. Software
Process Improvement (SPI) bears relevance to this segment as in the demanding technology markets at US and Europe the buyers routinely ask provider organizations to present objective proof of their Software Engineering capabilities thru the adherence to some formal quality model, and in many cases specifically to concrete SEI-CMMI maturity levels.
Most scenarios and results captured by the bibliography [01] reflects the experiences of large
scale organizations leaving smaller ones wondering whether an SPI approach is realistic for them,
frequently leading to the a-priori estimation that formal SPI initiatives are simply outside their
realm of possibilities. Even though SPI efforts made at SMEs sized companies have already been documented, the focus is often placed on qualitative or methodological factors rather than quantitative ones. It seems the implicit assumption is for SPI efforts to unconditionally be a good initiative regardless of the company business context.
This notion has been challenged by several authors where the actual affordability and suitability of formal CMMI oriented SPI initiatives for SMEs is questioned from different perspectives.
Previous work from the authors [04,05,06,07] described a comprehensive framework which helps in
the modeling of organizations attempting to implement SPI initiatives and allows understanding the different organizational parameters involved in the business decision, the outcome that might be expected and the level of risk associated with it. A window of opportunity appears on the usage of data gathered at a national scale to validate some of the concepts modeled and the relationship exhibit among them.
Until now research work had to be done using sources from different development markets and results extrapolated to Argentina under the implicit assumption of validity. Very few sources previously addressed a systematic analysis or provide insights on the profile of Argentina based companies regarding SPI; this is specially important in relation to the research effort carried out by the authors where a modeling effort has been made and initially calibrated based on data published elsewhere giving room for the implicit threat to validity about the applicability at the Argentina’s based organizations.
This paper proposes a contribution by analyzing data collected in Argentina focusing on the specific group of small companies (less than 160 persons) trying to understand the dynamic behavior of the different variables associated with the SPI effort outcomes, specially when implemented thru the usage of SEI-CMMI as the reference model, in order to evaluate possible strategies to address this initiative and the likelihood of its results. Finally, threats to the validity of this approach and preliminary conclusions are explored.
Quality Reference Model
The SEI CMMI v1.2 reference model seems to be the choice to guide the deployment of SPI efforts to develop a comprehensive process that unveils the organization’s technologic potential at
delivering software products. Positive correlation between the maturity level and better
performance is backed up by many industry and academic references[02,09,12].
Although other reference models can equally be eligible for this purpose, the SEI-CMMI
model3 presents significant industry acceptance at a global scale, a long standing record of
applications and some metrics for the results obtained by different organizations. One of the research questions of this paper is to understand whether SEI-CMMI v1.2 is the reference guiding the SPI efforts in Argentina.
Although not specifically designed for the software industry, the ISO9000 quality standards had been also adopted by a significant number of organizations in Argentina; either alone, together with CMMI or with other quality certifications approaches. The nature of this adoption and the profile of the organizations embracing it have been also identified as an interesting topic addressed by this paper.
SPI at Small and Medium Enterprises
Multiple sources [11,13,14,15] identify the importance of the Small and Medium Enterprises (SMEs)
as the dominant group at delivering software services for both domestic and off-shore markets. Previous surveys performed by CESSI confirm that trend in Argentina as well. Even though SMEs need to address SPI for a variety of reasons, they are still reluctant to initiate and sustain SPI
efforts in significant numbers [08,10,17]. All evidence points to confirming the SMEs segment
understands the value of SPI initiatives and is willing to consider them, specially as reported in
markets with significant participation in the off-shore delivery of services [03,16, 17].
Research Method
Most empirical studies of the adoption of SPI rely on very simple statistical and analytical methods such as percentage tables, chart and related univariate and bivariate statistics. Sample sizes are typically small, with correspondingly few degrees of freedom to support multivariate analysis. A good deal of insight can be actually gained from relatively simple analytical techniques.
Data Source
The scope of the collected survey was beyond the requirements of this research activity to include a group representing a variety of software organizations in Argentina. It is composed by 44
questions segmented in 8 sections named General Characteristics (A), Investment and Innovation
(B), Problems and Expectative (C), Performance (D), Exports (E), Economy and Finance (F),
Quality (G) and Human Resources (H). A combination of Yes/No, Multichoice, 10-Likert, 3-Likert,
4-Likert, 5-Likert, Categorical and Direct values are captured through the questions. CESSI makes available to the public both the survey structure and results so interested readers might refer detailed questions on the operating definition of the different aspects to that source.
Analysis Framework
Previous published efforts from the authors have been focused on building a preliminary model of the relations to be used to evaluate the survey; several specific questions were mapped into
independent variables, parameters or results taken as dependent variables. A complete mapping of
the questions extracted from the survey can be seen in the Appendix A.
A number of factors are subject to decisions being made by the management whose relation to the CMMI adoption, either existing or planned, is to be evaluated. Although not being part of the initial model, the availability of data regarding other quality references such as ISO9000 is also incorporated in the analysis and some comparative analysis between both models is performed. The adoption of other, unspecified, quality certifications has been captured also by the survey so a customary validation of it potential relevance has been also done. The previously referred research
made by the authors predicts a significant relation between the organization size (N) and the
likelihood of achieving a maturity level as given by the CMMI model. Intuitive as it might seem, this notion had received little attention in published papers in terms of validation. There is also a number of decisions the organization can make such as having a priority on investment in quality or having income increase expectations which are also assessed here as per their relation to present or future adoption of SPI initiatives, specially CMMI.
The availability of R&D intentions also allows understanding the incidence on present or future
adoption of SPI actions of focus on Productivity, Software Quality, Cycle Time or Process
Improvement. Other R&D focuses are also analyzed and their relation to SPI is evaluated.
Organizations’ journeys to achieve a high maturity or certified status under a formal quality model require adopting and deploying practices which can be seen as pre-requisites. The existence
of several such practices as Schedule Management, Project Planning, Project Monitoring and
Control, Estimation practices and Risk Management has been captured by the survey and analyzed. Finally the analysis includes three factors assumed to operate as facilitators of SPI such as the
current or future intention to operate at international (off-shore) markets, the membership of
economic groups and the adherence to the Argentina’s Software Law (Ley 25922) which are incorporated as parameters.
Survey Demographics
This section briefly provides some survey demographics. All the analysis performed in this paper has been made using MiniTab as the statistical tool. The total number of unique answers made available to this research effort were 191 from different organizations, out of them 173
(90.5%) reports being focused in Software Development, Maintenance and Support and included
in the analysis whilst only 18 (9.5%) reports being focused on other aspects such as value added
services, services being provided using software or other related services have not been included in the analysis because of being considered to belong to a segment having no incentives to be inclined to SPI efforts. From the target population survey, 32 records not providing information about organization size were removed since it’s considered to be a major factor in the analysis and taken as quality indicator of the rest of the answers. Additional 30 records were removed because of not stating the revenue during the year 2006. Revenues were roughly used as a validation for the organizational size and the lack of the data is also taken as a quality indicator of the rest of the data. The complete analysis isn’t reproduced here because of space constraints but results obtained do not vary significantly by pulling this data out of the sample.
Figure 1 Organization Size distribution
Figure 2 Frequency for CMMI and ISO9000
The organization size is found not to follow a normal distribution since the Anderson-Darling normality test have a p-value=0.005. Further investigation shows it fits a log-normal distribution whose normality test yields a p-value=0.586. The vast majority of the organizations captured in the survey data are composed by 160 persons or less (97.3%) and therefore are regarded by the authors as Small and Medium Enterprises with the size median being 19 persons or less and the 3th quartile of the distribution (75% of the population) composed by organizations of 39 persons or less. The data order is tested for randomness using a non-parametric independence test, were evidence is gathered to conclude that the data are in random order with the resulting p-value=0.767 being greater than the alpha level of 0.10 set as the decision threshold.
Regarding the independent variables the organizations expecting incomes to increase in the
future are 48 (43,24%) whilst respondents stating a willingness to perform quality investments are
75 (67,57%).
R&D focus are aimed towards Productivity in 57 answers (51,35%), Software Quality in
71 cases (63,96%), Cycle Time cited in 48 (43,24%) while Process Improvement in 49 (44,14%)
and finally other aspects in 57 (51,35%).
Regarding best practices, Schedule management is reported as being performed practice in 89
cases (80,18%), Project Planning in 76 cases (68.47%), Project Monitoring and Control in 93
(83.78%), Estimation methodologies in 63 cases (56.76%) and finally Risk Management practices
in 38 cases (34.23%).
Organizations adopting the Argentina’s Software Law (Ley 25922) are 43 (38.7%) whereas
organizations declaring membership of an economic group are also 43 (38.7%) although not
necessarily the same since only 18 (16.2%) conveys both conditions. Respondents claiming to
have some activities in off-shore markets amount 88 answers (79.2%) being a significant
proportion of the answers.
The profile of the dependent variables have CMMI as a reference model to be reported as being selected by 29 organizations (26.13%) with 17 of them (15.32%) already been assessed at some maturity level while the remaining 12 (10.81%) being in process of getting assessed.
percentage of adoption by organizations of different sizes of CMMI and ISO9000 can be seen in the Figure 2. From organizations excluded from the analysis because of the main activity is not associated with software development, none of them actually aim to perform activities related to CMMI and only 2 (11.1%) are planning to perform activities using ISO9000. This very low frequency for both confirms the initial assumption that this segment of organizations is not likely interested in SPI activities because of the nature of their operation.
Method
Our research questions were:
• Is the adoption of SPI initiatives under CMMI, related to the size of the organization?
• How is the adoption of SPI initiatives under CMMI vs. ISO9000 related in the sample
population?
• Is the adoption of SPI initiatives under CMMI related to the proposed set of
independent variables and parameters?
Whenever feasible, we will explore the research questions under ISO9000 given the data availability in the survey. During the analysis a higher level of Type I error is accepted in order to
allow relations to emerge and a significance of the test with α=0.10 is used, that will require
further confirmation to be performed in all the findings of this analysis by other means. The following sections describe the posed questions.
Organization Size dependency
The frequency analysis for both CMMI and ISO9000 adoption among the organizations included in the survey analysis can be seen in the Table 1.
The proportion of the total population adopting CMMI increases with the organization size: more than half of the organizations sized 40 persons or higher embrace CMMI. The distribution for firms using ISO9000 shows a distribution pattern where smaller organizations (40 persons or less) seems to prefer ISO9000 over CMMI but beyond that point the preferences for ISO9000 decays and preferences tilts towards CMMI. In absolute terms the companies using ISO9000 outnumber significantly firms with CMMI because the higher frequency of adoption on the sample is for small organizations which are also more significant in absolute numbers.
Assuming the size of the organization can closely approximate a continuous variable the
adoption of CMMI can be modeled using a General Linear Model (GLM) technique which reports
a good fit with p-value=0.00 and ρ2=73.05% . The same technique applied over the adoption of
ISO9000 reports yield not such a good correlation with the organizational size with a
p-value=0.522 and ρ2=45.03% meaning there is no evidence to support a relation with size
Both CMMI and ISO9000 distribution are compared using the Mann-Whitney technique where
Table 1 Frequency CMMI vs. ISO9000
From To FrequencyFrequency %Pop Frequency %Pop
1 19 58 3 5,2% 18 31,0%
20 39 27 8 29,6% 12 44,4%
40 79 17 11 64,7% 9 52,9%
80 159 6 5 83,3% 1 16,7%
160 3 2 66,7% 1 33,3%
111 29 41
Organization Size CMMI ISO9000
Table 2CMMI and ISO9000 dependency from parameters
Ley 25922 E.Group OffShore Ley 25922 E.Group OffShore
Plan Yes No No No No No
Achieved No No No No No No
CMMI ISO9000
Status
Table 3 CMMI and ISO9000 dependency from independent variables
Variable CMMI ISO9000 Income Increase No No Quality Investment No Yes Productivity No Yes
Software Quality No Yes Cycle Time Yes No Process Improvement Yes No Other Investments No No
Schedule No No
Project Planning Yes No Project Monitoring No No Estimation Yes No Risk Management Yes No
Dependency from independent variables and moderating parameters
The impact of parameters such as the adoption of the Argentina’s Software Law (Ley 25922),
membership of an economic group and offshore operation is evaluated in terms of the dependency
of the SPI adoption with them using a Chi-Square method for both CMMI and ISO9000 (Planned
and achieved)4. The results can be also seen in the Table 2, where “Yes” denote a p-value less than
0.1 meaning a dependency was found, whilst “No” means a p-value for the test higher than 0.10 where the independence (null hypothesis) can not be rejected.
Continuing the evaluation, the adoption of CMMI or ISO9000 is also evaluated using a Chi-Square analysis technique where each method is compared with the different independent variables proposed. All p-values above 0.10 are stated as “No” meaning no dependency found and below that margin as “Yes” meaning a dependency was found. Results can be seen at Table 3.
The test was repeated using the Goodman-Kruskal non-parametric method where a
measurement of the improvement percentage in the probability of the dependent variable gives the
value of the other variable. Also a Cramer v2 non-parametric method was used to measure the
association between two variables, a value of zero indicates there is no association. Both tests support the findings provided by the Chi-Square analysis.
Finally, we use the General Linear Model (GLM) technique to perform univariate analysis of
variance with balanced and unbalanced designs, analysis of covariance, and regression, for each response variable, in this case first the planned or current adoption of CMMI and ISO9000.
The Analysis of Variance in Table 4 gives, for each term in the model, the degrees of freedom,
the sequential sums of squares (Seq SS), the adjusted (partial) sums of squares (Adj SS), the adjusted means squares (Adj MS), the F-statistic from the adjusted means squares, and its p-value. The sequential sums of squares are the added sums of squares given that prior terms are in the model. These values depend upon the model order. The adjusted sums of squares are the sums of squares given that all other terms are in the model. These values do not depend upon the model order.
4 In all hypothesis subject to evaluation both the null hypothesis (H
0) meaning the “no change” and the alternate hypothesis (Ha) expressing the change are
In the analysis all p-values below 0.1 are assumed to indicate significant evidence of effects.
The ρ2 value (R-Sq) shows that model explains 80.33% of the variance in CMMI adoption,
[image:8.612.109.491.167.349.2]indicating that the model fits the data reasonably well. However the results have to be carefully handled since the degrees of freedom with all variables (except organization size) are small.
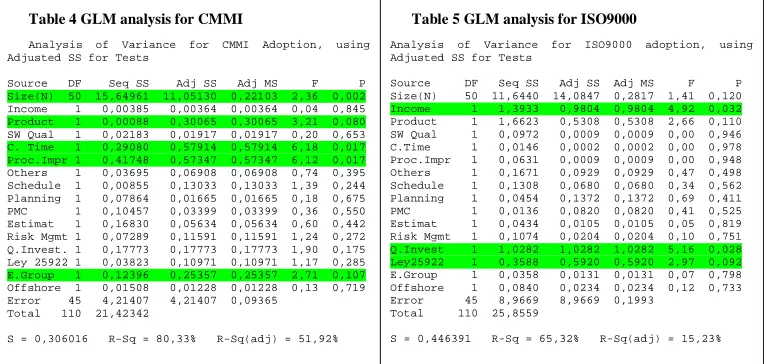
Table 4 GLM analysis for CMMI
Analysis of Variance for CMMI Adoption, using Adjusted SS for Tests
Source DF Seq SS Adj SS Adj MS F P Size(N) 50 15,64961 11,05130 0,22103 2,36 0,002 Income 1 0,00385 0,00364 0,00364 0,04 0,845 Product 1 0,00088 0,30065 0,30065 3,21 0,080 SW Qual 1 0,02183 0,01917 0,01917 0,20 0,653 C. Time 1 0,29080 0,57914 0,57914 6,18 0,017 Proc.Impr 1 0,41748 0,57347 0,57347 6,12 0,017 Others 1 0,03695 0,06908 0,06908 0,74 0,395 Schedule 1 0,00855 0,13033 0,13033 1,39 0,244 Planning 1 0,07864 0,01665 0,01665 0,18 0,675 PMC 1 0,10457 0,03399 0,03399 0,36 0,550 Estimat 1 0,16830 0,05634 0,05634 0,60 0,442 Risk Mgmt 1 0,07289 0,11591 0,11591 1,24 0,272 Q.Invest. 1 0,17773 0,17773 0,17773 1,90 0,175 Ley 25922 1 0,03823 0,10971 0,10971 1,17 0,285 E.Group 1 0,12396 0,25357 0,25357 2,71 0,107 Offshore 1 0,01508 0,01228 0,01228 0,13 0,719 Error 45 4,21407 4,21407 0,09365
Total 110 21,42342
S = 0,306016 R-Sq = 80,33% R-Sq(adj) = 51,92%
Table 5 GLM analysis for ISO9000
Analysis of Variance for ISO9000 adoption, using Adjusted SS for Tests
Source DF Seq SS Adj SS Adj MS F P Size(N) 50 11,6440 14,0847 0,2817 1,41 0,120 Income 1 1,3933 0,9804 0,9804 4,92 0,032 Product 1 1,6623 0,5308 0,5308 2,66 0,110 SW Qual 1 0,0972 0,0009 0,0009 0,00 0,946 C.Time 1 0,0146 0,0002 0,0002 0,00 0,978 Proc.Impr 1 0,0631 0,0009 0,0009 0,00 0,948 Others 1 0,1671 0,0929 0,0929 0,47 0,498 Schedule 1 0,1308 0,0680 0,0680 0,34 0,562 Planning 1 0,0454 0,1372 0,1372 0,69 0,411 PMC 1 0,0136 0,0820 0,0820 0,41 0,525 Estimat 1 0,0434 0,0105 0,0105 0,05 0,819 Risk Mgmt 1 0,1074 0,0204 0,0204 0,10 0,751 Q.Invest 1 1,0282 1,0282 1,0282 5,16 0,028 Ley25922 1 0,3588 0,5920 0,5920 2,97 0,092 E.Group 1 0,0358 0,0131 0,0131 0,07 0,798 Offshore 1 0,0840 0,0234 0,0234 0,12 0,733 Error 45 8,9669 8,9669 0,1993
Total 110 25,8559
S = 0,446391 R-Sq = 65,32% R-Sq(adj) = 15,23%
In this case analysis of the p-value indicates significant evidence of effects on the CMMI
adoption from the Organizational Size (N), the R&D focus on productivity, cycle time and Process
Improvement. Somewhat marginal evidence is also shown towards the membership of an
economic group. Repeating the analysis for ISO9000, Table 5, the p-value obtained indicates
significant evidence of effects on the ISO9000 adoption from the considering the operation under
the terms of the Argentina’s software law (Ley 25922), the expectation of Income Increase and the
desire to have a priority to Invest in Quality. Marginally outside the acceptance threshold effects
from Organizational Size and R&D focus on productivity can also be noted. The ρ2 value shows
that model explains 65.32% of the variance in ISO9000 adoption indicating that the model fits the data just marginally.
Discussion
Is the adoption of SPI initiatives under CMMI, related to the size of the organization? CMMI as a reference model is adopted with increased frequency as the organization is larger. This is consistent with a return model having a relatively large initial investment being recovered over time by increased productivity in the on-going operation which is one of the conclusions obtained by previous research work by the authors thru the proposal of a theoretically based modeling of the factors involved in the SPI deployment at software development organizations..
Is the adoption of SPI initiatives under CMMI related to the proposed set of independent variables and parameters?
CMMI reflects dependency from variables related to R&D focus on a more efficient operation
such as Productivity, Cycle Timeor Process Improvement; marginal dependencies have been also
found from operating at off-shore markets from its adoption; it is all but encouraging also that
identified between CMMI and the existence of best practices related to Project Planning,
Estimation and Risk Management whilst the same dependency isn’t evident for the adoption of ISO9000.
How is the adoption of SPI initiatives under CMMI vs. ISO9000 related in the sample population?
Organizations roughly below 40 persons seems to prefer ISO9000 which hints a lower investment needed to operate under this framework but a lower return from the on-going increase of productivity from it as well; then a decision rule being taken by Argentina’s organization because of the broad business conditions they operate emerges. ISO9000 seems at the same time to depend on an entirely different set of reasons such as expectations of income increase or willingness to
invest in quality as well as compliance with the terms of the Argentina’s software law.
Threats to validity
The data for this study was collected as part of a methodical industry survey exercise and not using a survey instrument designed to support this particular research study. This has resulted in more threats to internal validity than would be desirable. We have persevered because this is very rare data which sheds light on important but previously unaddressed questions, especially for the Argentina environment.
Organizations might be tempted to give inaccurate reasons that reflected better on them that their real reasons, especially when talking about their future plans for SPI. This threat is partly controlled by filtering inconsistent data, even increasing the risk to reduce the significance of the analysis because of the reduced sample size.
Data might be up to a year out-of-date and it is also possible that in some cases answers provided might have changed already. However we feel that SPI initiatives are usually a long horizon propositions for this factor to disturb significantly the conclusions in a short timeframe.
In an idealized setting, organizational decisions are cost vs. benefit judgments, however in practical terms this is a simplistic theoretical perspective that might be invalid for any individual organization to make a decision about adopting SPI within a short-to-medium timeframe, and especially for the resources-constrained small organizations which were a large part of the surveyed population. Further complication is that the independent variables were assessed using retrospective recall. This involves the risk for the introduction of retrospective bias.
Regarding external validity, it is possible that our findings do not generalize to other context. Although the sample is large enough there may be hidden systematic bias affecting the valid generalization of results. Organizations in the study are all Argentine, which was one of the focuses of the work given the lack of previous analysis in the same direction, but this makes worth note our findings might not be generalized to other environments. However it is worth note that the overall results agree with a large body of research and industry references and our previously published modeling based on simulation techniques.
Conclusion
1. CMMI and ISO-9000 are complementary SPI approaches being taken by different segments of the organizations included in the survey; the adoption of CMMI seems to be preferred by larger organizations confirming previous theoretically based predictions where the probability of having a positive result out of a SPI initiative increases with the size of the organization because of the nature of the return (payback) model involved.
2. Because of smaller organizations seems to prefer ISO9000 and being a larger set, the adoption
of ISO9000 outnumbers the adoption of CMMI in absolute terms.
3. The Argentina Software Law (Ley 25922) seems to influence organizations planning to adopt
CMMI, but not these that already adopted it, or organizations planning or already achieving ISO9000 as the SPI framework.
4. Focus on Productivity, Cycle Time, Process Improvement and offshore activity influences the
adoption of CMMI. ISO9000 seems to be dependant on expectations of higher income, decisions to invest in quality and the use of the Software Law incentives.
5. CMMI adoption seems to be linked to some of the practices such as Project Planning,
Estimation methods or Risk Management.
Future work
SPI success measurement is a controversial issue and more research is needed to study it. Several levels of analysis are possible (i.e. individual, group, process and organization, each one with complex interactions with the others). Further research should be related to the study of improved analysis of SPI efforts being conducted in the same environment, comparison of key investment characteristics and validation of the results. At the same time, context variables, such as organizational culture, business environment and other factors key to the survival of SMEs did not play an important role into understanding the relation with SPI outcomes It is needed then to investigate further the importance of such variables to several types of SPI problems and to validate the approaches proposed for solving them.
Acknowledgements
Thanks to Dr. Miguel Calello and Lic. Vanessa Lucchesi, president and executive director of the CESSI by providing the cooperative framework that enable us to receive the 2007 CESSI Survey data and ultimately made this work possible, deepful thanks are also provided to Lic. Mario Sosa from the Observatorio CESSI who worked closely with the authors into providing technical support on the definition and extraction of the survey data used in this paper.
The authors want to thank the financial support from CONICET (Consejo Nacional de Investigaciones Científicas y Técnicas), Agencia Nacional de Promoción Científica y Tecnológica and UTN (Universidad Tecnológica Nacional) from Argentina.
References
[01] Brodman,, J., Johnson, D.: ROI from Software Process Improvement as Measured in the US Industry. Software Process Improvement and Practice, vol. 1, no. 1, pp. 35-47.
[02] Capell P.: Benefits of Improvement Efforts, Special Report CMU/SEI-2004-SR-010,Sep’2004.
[03] Coleman Dangle, K.C.; Larsen, P.; Shaw, M.; Zelkowitz, M.V.; Software process improvement in small organizations: a case study Software, IEEE V22, I6 Nov2005 pp 68 – 75
[05] Colla P: Montagna J. Modelado de Mejora de Procesos de Software en Pequeñas Organizaciones JIISIC’08. (Guayaquil, Ecuador).
[06] Colla P. Montagna J. Framework to evaluate software process improvement in small organizations. International conference on software process (ICSP 2008), Leipzig, Germany, May 2008. pp. 36-50.
[07] Colla, P, Montagna M. Evaluation of Software Process Improvements in Small Organizations, SEAFOOD’08 (accepted paper, proceedings being edited).
[08] Conradi, H; Fuggetta, A; Improving Software Process Improvement IEEE Software V19I4 Jul 02 pp92 - 99 [09] Diaz, M, King J. "How CMM Impacts Quality, Productivity, Rework, and the Bottom Line," CrossTalk, V15 I3 Mar 2002, pp. 9-14
[10] Galin D. Avrahami M. “Are CMM Program Investment Beneficial?” Analysis of Past Studies – IEEE Software Nov/Dec 2006 p81-87
[11] Garcia, Suz. “Thoughts on applying CMMI on small settings” US DoD, Carnegie Mellon 2005.
[12] Gibson, D, Goldenson D, Kost K. Performance Results of CMMI based Process Improvement, CMU/SEI-2006-TR-004, 2006.
[13] Guerrero F. Adopting the SW-CMMI in Small IT Organizations – IEEE Software Jan/Feb 2004 p29-35 [14] Kelly, D.P.; Culleton, B.;Process improvement for small organizations, Computer, V32I10 Oct. 1999 pp 41-47 [15] Laporte C.Y April A. Applying SWE Standards in Small Settings. IRWPISS, SEI. Oct 19-20 2005.
[16] McFall D. et al Software An evaluation of CMMI process areas for small- to medium-sized software development organizations. Software Process: Improvement and Practice Volume 10, Issue 2 , Pages 189 - 201
[17] Staples M, Niazi, M, Jeffery R, Abrahams A, Byatt P, Murphy R. “ An Exploratory study on why organizations do not adopt CMMI”, Journal of Systems and Software 80 (2007) p883-895.
Appendix I-Survey Mapping
Data Item CESSI 2007 Survey
Variable
Name Filter
Validation and Processing Notes
Register Id N/A ID Sequential number, row id
Revenue A.18.4 REVENUE06 >0 Revenue during 2006
Worked Hours A.16.2 WORKLOAD >0 1=Up,2=Equal,3=Down
Used as Income Proxy Main Activity A.1 ACT 1,2,3,4,7 Software dev only. (1,2,3,4,7) Organization Size A.19 N
CMMI G.31.2 CMMI 1=Have,2=Working,3=No
ISO G.31.1 ISO 1=Have,2=Working,3=No
Other Certifications G.31.3 SPIOthers 1=Have,2=Working,3=No
Ley 25922 A.3 LEY25922 1=Yes,0=No
OffShore A.16.4 OFFSHORE 1=Up,2=Equal,3=Down,4=No
Economic Group A.7 GE 1=Yes,2=No
Current I+D Focus
Productivity SW Quality CycleTime Process Impr Others B.13.1 B.13.10 B.13.4 B.13.3 B.13.5 B.13.6 B.13.7 B.13.8 B.13.9 I+D-PROD I+D-SWQUALITY I+D-CT I+D-PE I+D-OTHERS 1=Yes,2=No 1=Yes,2=No 1=Yes,2=No 1=Yes,2=No 1=Yes,2=No
B.[13.5-9] OR as a single one
Practices Schedule Mgmt Project Planning Project Monitoring Estimation Risk Mgmt G.39.1 G.39.3 G.39.2 G.39.4 G.39.5 SCHEDULE PP PMC ESTIMATION RISKMGMT 1=Yes,2=No