ADVERTIMENT. La consulta d’aquesta tesi queda condicionada a l’acceptació de les següents condicions d'ús: La difusió d’aquesta tesi per mitjà del servei TDX (www.tesisenxarxa.net) ha estat autoritzada pels titulars dels drets de propietat intel·lectual únicament per a usos privats emmarcats en activitats d’investigació i docència. No s’autoritza la seva reproducció amb finalitats de lucre ni la seva difusió i posada a disposició des d’un lloc aliè al servei TDX. No s’autoritza la presentació del seu contingut en una finestra o marc aliè a TDX (framing). Aquesta reserva de drets afecta tant al resum de presentació de la tesi com als seus continguts. En la utilització o cita de parts de la tesi és obligat indicar el nom de la persona autora.
ADVERTENCIA. La consulta de esta tesis queda condicionada a la aceptación de las siguientes condiciones de uso: La difusión de esta tesis por medio del servicio TDR (www.tesisenred.net) ha sido autorizada por los titulares de los derechos de propiedad intelectual únicamente para usos privados enmarcados en actividades de investigación y docencia. No se autoriza su reproducción con finalidades de lucro ni su difusión y puesta a disposición desde un sitio ajeno al servicio TDR. No se autoriza la presentación de su contenido en una ventana o marco ajeno a TDR (framing). Esta reserva de derechos afecta tanto al resumen de presentación de la tesis como a sus contenidos. En la utilización o cita de partes de la tesis es obligado indicar el nombre de la persona autora.
Institut de Bioenginyeria de Catalunya (IBEC)
Doctoral program: Biomedical Engineering
Doctoral thesis
BREATHING PATTERN CHARACTERIZATION IN PATIENTS
WITH RESPIRATORY AND CARDIAC FAILURE
by
Ainara Garde Martinez
Thesis advisor:
Dr. Beatriz F. Giraldo Giraldo
Biomedical Signals and Systems (SISBIO) group, UPC
Biomedical Signal Processing and Interpretation (BIOSPIN) group, IBEC Departament d’Enginyeria de Sistemes, Automàtica i
Informàtica Industrial (ESAII)
Ama, ahizpa eta
Fernandorentzat...
Ez diren gauzak ere badira
Bizitza, ez diren gauzez ere osatzen delako.
BREATHING PATTERN CHARACTERIZATION IN PATIENTS WITH RESPIRATORY AND CARDIAC FAILURE
Ainara Garde Martinez
Departament d’Enginyeria de Sistemes, Automàtica i Informàtica Industrial (ESAII)
Doctoral thesis
trial is discomforting for patients, since it may induce cardiopulmonary dis-tress and carries a higher mortality rate. Our purpose is to obtain indices that provide enhanced information about the respiratory pattern and the dynamic interaction between heart rate and breathing rate. This is achieved through a comparison of patients with successful trials, patients who fail to maintain spontaneous breathing in the weaning procedure and are reconnected, and patients who successfully maintain spontaneous breathing and are extubated, but require the reinstitution of mechanical ventilation in less than 48 hours because they are unable to breathe spontaneously. Since electrocardiographic (ECG) and respiratory flow signals can be measured noninvasively, this anal-ysis could facilitate future automatic diagnoses of patients during weaning trials.
This study was carried out using the weaning dataset, which contains 30-minute ECG and respiratory flow signals acquired during T-tube tests. Three groups of patients are considered: GS, 94 patients with successful weaning;
GF, 39 patients who failed to maintain spontaneous breathing; and GR, 21 patients with successful weaning trials, who needed to be reintubated in less than 48 hours. The ECG and the respiratory flow signals used in this study were acquired during T-tube tests and last 30 minute.
suit-accuracy of 80% was obtained in the classification of GS versus GF through support vector machines (SVM), using only 8 of the 35 features.
In a second study, the cardiorespiratory interactions of the patients on weaning trials were studied by a nonlinear procedure. Joint symbolic dynamics applied to time series of heart rate and respiratory frequency can be used to describe the cardiorespiratory interactions of patients during the weaning trial process. The values of cardiac interbeat and breath duration series were synchronized and interpolated.
of patients and maintained a good balance between sensitivity and specificity, even for unbalanced datasets.
The results show good performance of the proposed SVM-based feature selection, since it selects the most relevant features and maintains a balance between sensitivity and specificity for unbalanced groups of data. It might be a useful tool for enhancing the analysis of patients on weaning trials because it adds objective information to the doctor’s expertise. Nevertheless, additional features and clinical information about patient condition before the weaning trial, should be considered to further increase the discrimination among these three groups, and to identify the reintubated patients in particular.
Chronic heart failure (CHF) is an increasingly widespread, costly and deadly disease that is frequently called an epidemic of the twenty-first cen-tury. Despite advances in modern treatment, the mortality rate in CHF pa-tients remains high. Risk stratification in these papa-tients is still one of the major challenges of contemporary cardiology. CHF patients often develop breathing abnormalities, including various forms of periodic breathing patterns, such as Cheyne-Stokes respiration (CSR) and periodic breathing without apnea. Periodic breathing in CHF patients is associated with increased mortality, es-pecially in CSR patients. Under the hypothesis that an in-depth study of the respiratory pattern could improve identification of the risk level of a CHF patient, our purpose is to obtain objective indices that can provide enhanced information about the pathophysiological condition of these patients.
with periodic breathing (PB) and nonperiodic breathing (nPB) patterns and 35 healthy volunteers.
In a first study, we assumed the stationarity of the signals and developed an envelope-based respiratory pattern characterization for CHF patients and healthy subjects. The aim was to study respiratory pattern periodicity as a risk index by characterizing the respiratory flow signal envelope. The objective was to identify and characterize respiratory patterns from healthy subjects or CHF patients with periodic or nonperiodic breathing. In a second study, the nonstationarity of the signals was considered through time-varying AR mod-elling applied to the respiratory envelope signal, to characterize the temporal evolution of breathing patterns. Power-related parameters achieved the best results in all of the classifications involving healthy subjects and CHF patients with CSR, PB and nPB. The main pole magnitude produced good results in the classification of PB and nPB patterns. The ROC curves validated the results obtained for the identification of different respiratory patterns.
These results indicate that power-related parameters of the respiratory envelope signal are powerful indices to detect periodic breathing. Additionally, time-varying modulation of the respiratory envelope signal provided accurate results that characterized the temporal evolution of respiratory patterns.
locations along the frequency axis in the correntropy spectral density (CSD). When correntropy was used to classify PB and nPB patients, the accuracy (88.9%) was higher than that obtained with parameters derived from enve-lope’s time–frequency representation. The importance of this results lies in the fact that the present classification is based on only one parameter.
The main goal of this research was to identify CHF patients’ condition noninvasively by characterizing and classifying respiratory flow patterns from patients with PB and nPB. In general, the best results were achieved with CSD-related parameters that characterized the power in the modulation and respiration discriminant bands, which is defined as a frequency interval cen-tred on the modulation and respiration frequency peaks, respectively. These parameters achieved the best results in all the classifications performed with CHF patients, including CSR patients, PB patients without apnea, and nPB patients. All patients, i.e. both PB and nPB, exhibit various degrees of periodicity depending on their condition, whereas healthy subjects have no pronounced periodicity. The correntropy mean and the correntropy spectral density mean provide excellent results in the classification of CHF and healthy subjects, as well as that of nPB patients and healthy subjects (CHF versus healthy 95.2%, and nPB versus healthy 94.4%).
This thesis has been developed in the research groups SISBIO at the Uni-versitat Politècnica de Catalunya (UPC) and BIOSPIN (Recognized Research Group [GRC], 2009 SGR 722) at the Institute for Bioengineering of Catalonia (IBEC), led by Drs. Pere Caminal and Raimon Jané. I am sincerely grateful to them for helping me during my doctoral research.
First, I would like to express my gratitude to my supervisor, Dr. Beat-riz F. Giraldo, whose encouragement and guidance from start to finish en-abled me to write this thesis. Her support and advice, particularly in the search for funding, was critical to the success of the entire thesis. I would also like to thank the people from the Department of Automatic Control (ESAII) of the UPC.
I would like to acknowledge Drs. S. Benito and A. Bayés-Genis and their colleagues at Santa Creu i Sant Pau Hospital, Barcelona, Spain, for their fruitful collaboration in the signal database acquisition and their help in the interpretation of clinical aspects of this thesis.
I am grateful to Prof. Andreas Voss and the people from the Department of Medical Engineering at the University of Applied Sciences Jena for their warm welcome, help and support during my stay. The research stay in Germany was partly supported under HA2005-0085 grant (Acción integrada MEC).
corrections. It is always a stimulating and rewarding experience working with you. Thanks also to the signal processing group at the Department of Electrical and Information Technology and Centre of Integrative Electrocardiology at Lund University. Thank you for being so kind during my stay. The research stay in Sweden was partly supported by the Centro de Investigación Biomédica en Red en Bioingeniería, Biomateriales y Nanomedicina (CIBER-BBN).
Thank you to Dr. Javier Hernando and the TALP Research Center in the Department of Signal Theory and Communications at the Universitat Politèc-nica de Catalunya (UPC) for introducing me to machine learning techniques. I would also like to thank all of my colleagues at the UPC, IBEC and CIBER-BBN, for their companionship.
A big thank you to all my friends in Jena and Lund, for being my family during my stay and for making my time there so incredible.
Thanks to all of my friends at the UPC for your constant support, the entertaining conversation during meals, the incredible experiences at different congresses and all the good times we have had together. It has been a real pleasure to work with you.
I am very grateful to all my close friends who have been always there with and for me during the good and the bad times. Thank you for your support, advice, love and presence in my life. I am really lucky to have such good friends.
I would like to thank the entire Lopez family for their constant support, exceptional advice and goodwill.
difficult times in this period and I have been a bundle of nerves, so thank you for supporting me and not giving up on me.
Thanks to all of you: this thesis would not have been possible without your support and trust.
Table of Contents xiii
List of Tables xvii
List of Figures xix
1 Introduction 1
1.1 Thesis introduction . . . 1
1.2 Thesis objective . . . 2
1.3 Thesis outline . . . 3
2 Weaning and chronic heart failure 7 2.1 Respiratory system . . . 8
2.1.1 Pulmonary ventilation . . . 8
2.1.2 Pulmonary volumes and capacities . . . 10
2.1.3 Respiratory flow and volume signals . . . 14
2.1.3.1 Respiratory signal acquisition . . . 15
2.1.4 Respiratory failure or insufficiency . . . 17
2.1.5 Mechanical Ventilation . . . 18
2.1.6 Modes of mechanical ventilation . . . 19
2.2 Discontinuation of mechanical ventilation or weaning . . . 21
2.2.1 Weaning methods . . . 22
2.2.2 Weaning indices . . . 23
2.2.3 Weaning versus extubation risks . . . 25
2.2.4 Recommended weaning . . . 27
2.2.4.1 Weaning process . . . 27
2.2.4.2 Spontaneous breathing trial, SBT . . . 28
2.2.4.3 SBT readiness . . . 29
2.2.4.4 SBT failure . . . 31
2.2.4.5 Extubation . . . 31
2.3.1 Linear methods . . . 35
2.3.2 Nonlinear methods . . . 36
2.3.3 Multidimensional . . . 37
2.4 Cardiovascular system . . . 39
2.4.1 Cardiac function: electrocardiogram . . . 40
2.4.2 Heart failure . . . 42
2.4.3 Chronic heart failure . . . 43
2.5 Datasets . . . 49
2.5.1 Weaning dataset . . . 49
2.5.2 Chronic heart failure dataset . . . 51
2.5.3 Healthy dataset . . . 53
2.6 Summary . . . 54
3 Pattern recognition techniques 57 3.1 Introduction . . . 58
3.2 Statistical pattern recognition . . . 59
3.3 Supervised and unsupervised learning . . . 60
3.4 Generalization error . . . 61
3.5 Classification techniques . . . 62
3.5.1 K-means clustering . . . 62
3.5.2 Discriminant analysis . . . 62
3.5.3 Support vector machines (SVM) . . . 64
3.5.3.1 Introduction . . . 64
3.5.3.2 Technique description . . . 65
3.6 Performance evaluation measures . . . 73
3.6.1 Accuracy . . . 73
3.6.2 Sensitivity / specificity . . . 74
3.6.3 Precision/Recall/F-measure . . . 74
3.6.4 Youden’s index and discriminant power . . . 75
3.7 Validation methods . . . 76
3.8 Feature selection . . . 77
3.9 Unbalanced database: new balance metric . . . 78
3.10 Summary . . . 79
4 Support vector machines applied to weaning 81 4.1 Medical application: weaning dataset . . . 82
4.2 Respiratory pattern analysis using SVM . . . 84
4.2.1 Methodology . . . 85
4.2.1.1 Respiratory pattern characterization . . . 85
4.2.1.2 Histogram equalization . . . 86
4.3Cardiorespiratory interaction analysis using SVM . . . 89
4.3.1 Methodology . . . 90
4.3.1.1 Joint symbolic dynamics . . . 90
4.3.1.2 Optimizing SVM feature selection . . . 93
4.3.2 Data analysis . . . 94
4.3.3 Results . . . 95
4.4 Conclusion . . . 106
5 Time-frequency analysis of respiratory pattern 111 5.1 Respiratory flow signal pre-processing . . . 112
5.1.1 Artefact removal . . . 112
5.1.2 Downsampling . . . 117
5.2 Respiratory pattern characterization . . . 117
5.2.1 Envelope detection . . . 118
5.2.1.1 Envelope detection in time domain . . . 118
5.2.1.2 Envelope detection in the frequency domain . . . 119
5.2.2 Envelope modelling . . . 124
5.2.2.1 Selection of the AR model order . . . 124
5.2.2.2 Whiteness test . . . 129
5.2.3 Envelope spectral analysis . . . 130
5.2.3.1 Nonparametric spectral analysis . . . 131
5.2.3.2 Parametric spectral analysis . . . 137
5.3 Time-frequency applied to the respiratory flow signal . . . 145
5.4 Summary . . . 151
6 Respiratory pattern analysis applied to chronic heart failure 153 6.1 Introduction . . . 153
6.2 Dataset . . . 154
6.3 Respiratory pattern in CHF patients and healthy subjects . . . 156
6.3.1 Parameter extraction . . . 156
6.3.2 Data analysis . . . 157
6.3.3 Results . . . 159
6.3.4 Performance evaluation . . . 168
6.4 Time-varying respiratory pattern in CHF patients and healthy subjects 170 6.4.1 Time-varying spectral estimation . . . 171
6.4.2 Time-varying parameter extraction . . . 175
6.4.3 Data analysis . . . 177
6.4.4 Results . . . 178
7 Correntropy-based respiratory pattern analysis 183
7.1 Correntropy: definition . . . 185
7.2 Correntropy: estimation . . . 186
7.3 Centred correntropy . . . 188
7.4 Correntropy: properties . . . 189
7.5 Correntropy spectral density . . . 191
7.6 Parameter extraction . . . 192
7.6.1 Simulated data . . . 193
7.6.2 Data analysis . . . 193
7.7 Results . . . 194
7.7.1 Simulated signals . . . 195
7.7.2 Real Signals . . . 201
7.7.3 Sensitivity to σ . . . 206
7.7.4 Performance evaluation . . . 206
7.8 Conclusion . . . 210
8 Conclusions 215 8.1 Weaning readiness assessment . . . 217
8.2 Chronic heart failure . . . 218
8.3 Future extension . . . 219
Bibliography 221
Publications derived from this thesis 235
2.1 Static volume measures . . . 12
2.2 Commonly used clinical parameters that predict successful weaning from mechanical ventilation . . . 25
2.3 Considerations for assessing readiness to wean [1] . . . 30
2.4 Failure parameters of spontaneous breathing trials [1] . . . 32
2.5 Criteria for extubation failure [1] . . . 33
3.1 Confusion matrix for binary classification . . . 73
4.1 M ean(x), standard deviation SD(x) and interquartile range IQR(x) of the interbeat durations (RR) and breath durations (TT ot), and p− value classifying group GS versus GF+GR. . . 96
4.2 Accuracy (Acc), balance index (B), sensitivity (Sn), specificity (Sp) and the number of features applied in the SVM classification for every τ value. . . 97
4.3 The best feature subset selected by discriminating the group of patients GSfromGF with both discriminant methods, using JSD without shift-ing (τ = 0). *: two symbols shifted to the right (τ= 2), and **: two symbols shifted to the left (τ =−2). . . 100
4.4 The best feature subset selected by discriminating the group of patients GSfrom the rest of the patients (GR+GF) by applying SVM and LDA and using JSD with two symbols shifted to the left τ=−2. . . 102
4.5 The best feature subset selected by discriminating the group of patients GRfromGS using SVM and JSD with two symbols shifted to the left τ=−2. . . 104
4.6 The best feature subset obtained by discriminating the group of pa-tientsGRfrom the rest (GS+GF) by applying SVM and JSD without shifting (τ = 0). *: two symbols shifted to the right (τ = 2), and **: two symbols shifted to the left (τ =−2). . . 106
6.2 Mean and standard deviation of P, PR, PL, S, K and r1 for each
group of subjects . . . 160
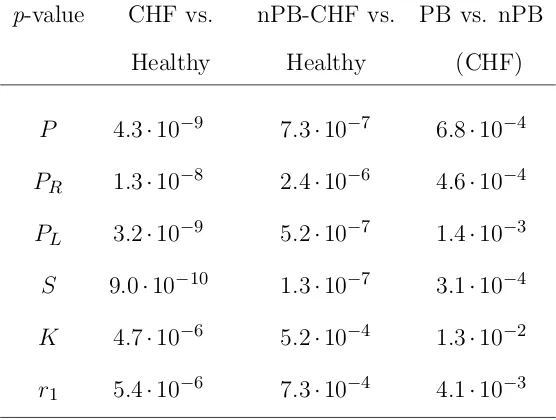
6.3 p-value of the most statistically significant parameters for each classi-fication . . . 161
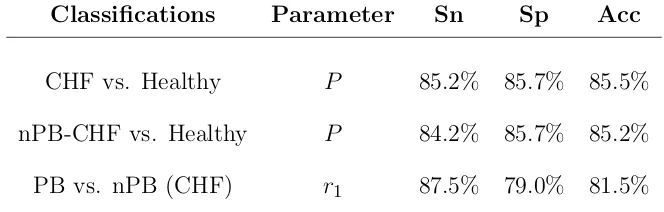
6.4 Sensitivity (Sn), specificity (Sp), and total accuracy (Acc) obtained with the best parameter for each classification using leave-one-out cross-validation . . . 168
6.5 Area under the curve (AUC) . . . 169
6.6 Time-varying parameter description . . . 175
6.7 Parameter description and statistics . . . 177
6.8 Mean and standard deviation of mP,mK, mS,mr1, ca1, cK, cP and cS for each group of subjects . . . 178
6.9 p-value of the classifications: CHF patients versus healthy subjects, nPB patients versus healthy subjects, and within the CHF patients, PB versus nPB . . . 180
6.10 Sensitivity (Sn), specificity (Sp), and total accuracy (Acc) obtained with the best parameters for each classification using leave-one-out cross-validation . . . 180
7.1 Parameter description . . . 193
7.2 Mean and standard deviation of V and R for each group of subjects * 206 7.3 p-value of the classifications: CHF patients versus healthy subjects, nPB patients versus healthy subjects, and PB versus nPB within the CHF patients . . . 208
2.1 The respiratory system. The air is distributed to the lungs by way of the trachea, bronchi and bronchioles (authorized by [2]). . . 9 2.2 The process of inspiration and expiration (authorized by [2]). . . 10 2.3 Spirogram with lung volume changes under different breathing
condi-tions. The air in the lungs has been subdivided into four volumes and four capacities, which are the average for a young adult man (autho-rized by [2]). . . 11 2.4 Forced vital capacity measurements in a healthy and with partial
air-way obstruction subject (The “ zero” on the volume scale is the residual volume), (authorized by [2]). . . 16 2.5 Heart muscle (authorized by [2]). . . 40 2.6 A normal electrocardiogram composed of a P wave, a QRS complex
and a T wave (authorized by [2]). . . 41 2.7 Weaning trial process. [5pt] . . . 50 2.8 The respiratory flow signal exemplified for (a) a Cheyne-Stokes
res-piration patient, (b) a periodic breathing patient, (c) a nonperiodic breathing patient, and (d) a healthy subject. . . 54 3.1 Proposed model for statistical pattern recognition (slightly modified
from the model proposed by [3]). . . 59 3.2 Two-class linear classification. The support vectors (coloured in black)
provide the useful information for classification. . . 68 3.3 Example of transformation from a two-dimensional space to a
three-dimensional space. . . 70 4.1 Successful (GS) and unsuccessful (GF) patients before the
classifica-tion. Orthogonal projections with principal component analysis are used to represent the hyperspace data on a plane before the classifica-tion. . . 88
4.2 Training set of successful (GS) and unsuccessful (GF) patients after the classification. Appropriate feature selection and histogram equal-ization are obtained with the training set before the final classification. 88 4.3 Testing set of successful (GS) and unsuccessful (GF) patients after the
classification. Appropriate variable selection and histogram equaliza-tion are obtained with the training set before the final classificaequaliza-tion. . 89 4.4 Main stages of the feature selection method based on different
perfor-mance evaluation measures . . . 94 4.5 Classification process using support vector machines (SVM) and linear
discriminant analysis (LDA). . . 95 4.6 Accuracy (Acc), sensitivity (Sn) and specificity (Sp) when a new
se-lected feature is added in the classification of theGSgroup versusGF, using LDA. . . 98 4.7 Accuracy (Acc), sensitivity (Sn) and specificity (Sp) when a new
se-lected feature is added in the classification of theGSgroup versusGF, using SVM. . . 99 4.8 Accuracy (Acc), sensitivity (Sn) and specificity (Sp) when a new
se-lected feature is added in the classification of theGS group versus GF
and GR, using SVM. . . 101 4.9 Accuracy (Acc), sensitivity (Sn) and specificity (Sp) when a new
se-lected feature is added in the classification of the group of patientsGR
versus GS, using SVM. . . 103 4.10 Accuracy (Acc), sensitivity (Sn) and specificity (Sp) when a new
se-lected feature is added in the classification of theGRgroup versus GS
and GF, using SVM. . . 105 5.1 Outlier removal: (a) original flow signal with both thresholds (1st
and 99th percentile) and (b) overlapped original flow signal and pre-processed flow signal. . . 113 5.2 Spike reduction: (a) original flow signal, auxiliary signal and the fixed
threshold and (b) pre-processed flow signal. . . 114 5.3 AR reconstruction process decomposition taken from [4]. . . 116 5.4 Time and frequency domain envelope extraction methods for a real
signal. . . 120 5.5 (a) Respiratory flow signal segment of a PB patient and (b) the
sim-ulated AM signal with a 0.3 Hz carrier and a 0.02 Hz sinusoid as modulation. . . 122 5.6 Time and frequency domain envelope extraction methods for the AM
signal. . . 123 5.7 (a)F P Ecriterion, (b)AIC criterion and (c)M DLcriterion evaluated
5.8 (a)F P Ecriterion, (b)AICcriterion, and (c)M DLcriterion evaluated by the simulated AM signal’s envelope. . . 127 5.9 (a)F P Ecriterion, (b)AIC criterion and (c)M DLcriterion evaluated
for the respiratory flow signal of a CHF patient. . . 128 5.10 (a)F P Ecriterion, (b)AIC criterion and (c)M DLcriterion evaluated
for the respiratory flow envelope of a CHF patient. . . 129 5.11 (a) Flow signal and its envelope, (b) Welch, (c) Blackman-Tukey, (d)
Yule-Walker, (e) Covariance, (f) Modified covariance, and (g) Burg to estimate the PSD of the simulated AM signal envelope. . . 146 5.12 (a) Flow signal and its envelope, (b) Welch, (c) Blackman-Tukey, (d)
Yule-Walker, (e) Covariance, (f) Modified covariance, and (g) Burg to estimate the PSD of the envelope of a CHF patient with Cheyne-Stokes respiration. . . 147 5.13 (a) Flow signal and its envelope, (b) Welch, (c) Blackman-Tukey, (d)
Yule-Walker, (e) Covariance, (f) Modified covariance, and (g) Burg to estimate the PSD of the envelope of a CHF patient with periodic breathing. . . 148 5.14 (a) Flow signal and its envelope, (b) Welch, (c) Blackman-Tukey, (d)
Yule-Walker, (e) Covariance, (f) Modified covariance, and (g) Burg to estimate the PSD of the envelope of a CHF patient with nonperiodic breathing. . . 149 5.15 (a) Flow signal and its envelope, (b) Welch, (c) Blackman-Tukey, (d)
Yule-Walker, (e) Covariance, (f) Modified covariance, and (g) Burg to estimate the PSD of the envelope of a healthy subject. . . 150 6.1 The respiratory flow signal exemplified for (a) a Cheyne-Stokes
res-piration patient, (b) a periodic breathing patient, (c) a nonperiodic breathing patient, and (d) a healthy subject. . . 155 6.2 Parameters extracted from the discriminant band of the power spectral
density. . . 158 6.3 Discriminant band (DB) of a CSR patient, a PB patient without apnea,
an nPB patient, and a healthy subject. . . 159 6.4 Normalized distribution of the most significant non-correlated
param-eters P, S, K and r1 selected for each linear classification: (a, b, c,
d) CHF patients versus healthy subjects, (e, f, g, h) nPB patients vs. healthy subjects, and (i, j, k, l) PB vs. nPB patients. . . 162 6.5 (a) The pre-processed flow signal and its envelope, (b) the PSD, (c) the
6.6 (a) The pre-processed flow signal and its envelope, (b) the PSD, (c) the poles of the autoregressive model, and (d) the autocorrelation signal of a patient with periodic breathing without apnea. . . 164 6.7 (a) The pre-processed flow signal and its envelope, (b) the PSD, (c) the
poles of the autoregressive model, and (d) the autocorrelation signal of a patient with nonperiodic breathing (nPB). . . 165 6.8 (a) The pre-processed flow signal and its envelope, (b) the PSD, (c) the
poles of the autoregressive model, and (d) the autocorrelation signal of a healthy subject. . . 166 6.9 PSD of the subjects: (a) CSR patients, (b) PB patients, (c) nPB
pa-tients, and (d) healthy subjects. . . 167 6.10 ROC curves of the most significant parameters: power-related
param-eters (P, PL, PR) and main pole radius r1 in the classification of (a)
CHF patients vs. healthy subjects, (b) nPB patients vs. healthy sub-jects, and (c) PB vs. nPB within the CHF patients. . . 169 6.11 Time-varying autoregressive modelling process by means of recursive
least squares. . . 174 6.12 Time-varying power spectrum of (a) a CSR patient, (b) a PB patient,
(c) an nPB patient, and (d) a healthy subject. . . 176 6.13 Time-varying parameters extracted from the discriminant band. . . . 177 6.14 ROC curves of the most significant parameters: (a) CHF patients vs.
healthy subjects, (b) nPB patients vs. healthy subjects, and (c) PB vs. nPB within the CHF patients. . . 179 7.1 (a) A respiratory flow signal acquired from a PB patient, and (b) a
simulated AM signal with 0.3 Hz carrier (“respiratory”) frequency, 0.02 Hz modulation frequency, and µ= 0.8. . . 194 7.2 (a) A simulated AM signal with 0.3 Hz carrier frequency, 0.02 Hz
modulation frequency, and µ= 1, (b) its correntropy function and (c) its correlation function. The CSD obtained with (d) Yule–Walker’s method and (f) Blackman-Tukey’s method. The PSD obtained with (e) Yule–Walker’s method and (g) Blackman-Tukey’s method. . . 196 7.3 (a) The simulated AM signal (0.3 Hz carrier frequency, 0.02 Hz
mod-ulation frequency and µ= 1) with some outliers randomly added, (b) its correntropy function computed with σopt and (c) its correlation
7.4 (a) The simulated AM signal (0.3 Hz carrier frequency, 0.02 Hz mod-ulation frequency and µ= 1) with some outliers randomly added, (b) its correntropy function computed with 0.1σopt and (c) its correlation
function. The CSD obtained with (d) Yule–Walker’s method and (f) Blackman-Tukey’s method. The PSD obtained with (e) Yule–Walker’s method and (g) Blackman-Tukey’s method. . . 199 7.5 (a) The simulated AM signal (0.3 Hz carrier frequency, 0.02 Hz
mod-ulation frequency and µ= 1) with some outliers randomly added, (b) its correntropy function computed with 10σopt and (c) its correlation
function. The CSD obtained with (d) Yule–Walker’s method and (f) Blackman-Tukey’s method. The PSD obtained with (e) Yule–Walker’s method and (g) Blackman-Tukey’s method. . . 200 7.6 (a) The respiratory flow signal of a CSR patient, (b) its correntropy
function, and (c) its correlation function. The CSD obtained with (d) Yule–Walker’s method and (f) Blackman-Tukey’s method. The PSD obtained with (e) Yule–Walker’s method and (g) Blackman-Tukey’s method. . . 202 7.7 (a) The respiratory flow signal of a CHF patient with PB, (b) its
cor-rentropy function, and (c) its correlation function. The CSD obtained with (d) Yule–Walker’s method and (f) Blackman-Tukey’s method. The PSD obtained with (e) Yule–Walker’s method and (g) Blackman-Tukey’s method. . . 203 7.8 (a) The respiratory flow signal of a CHF patient with nPB, (b) its
cor-rentropy function, and (c) its correlation function. The CSD obtained with (d) Yule–Walker’s method and (f) Blackman-Tukey’s method. The PSD obtained with (e) Yule–Walker’s method and (g) Blackman-Tukey’s method. . . 204 7.9 (a) The respiratory flow signal of a healthy subject, (b) its correntropy
function, and (c) its correlation function. The CSD obtained with (d) Yule–Walker’s method and (f) Blackman-Tukey’s method. The PSD obtained with (e) Yule–Walker’s method and (g) Blackman-Tukey’s method. . . 205 7.10 (a) A simulated AM signal and (b) a respiratory flow signal of a PB
patient. Their respective (c), (d) PSDs, (e), (f) parametric CSDs and (g), (h) nonparametric CSDs evaluated all for the kernel values 0.1σopt,
σopt, and 10σopt. . . 207
Introduction
1.1
Thesis introduction
In order to help clinical doctors in the diagnosis of patients, in this research we analyse the respiratory system of patients with different pathologies in depth. Specifically, we study patients on weaning trials and patients with chronic heart failure.
The process of discontinuing mechanical ventilation that is referred to as weaning is still one of the most challenging problems in intensive care units. Although a lot of research has been done on this topic, a high percentage of patients who undergo successful T-tube trials have to be reintubated in less than 48 hours. Reintubation percentages that range from 6% to 47% have been reported for different populations. Withdrawal of mechanical ventilation should be performed as soon as spontaneous respiration can be sustained. Critical care clinicians must carefully assess the benefits of prompt liberation from mechanical ventilation against the risks of premature tests of spontaneous breathing and extubation. Both delayed and failed extubation have detrimental consequences. A failed weaning trial is discomforting for patients, since
it may induce cardiopulmonary distress and carries a higher mortality rate.
Chronic heart failure (CHF) is an increasingly widespread, costly and deadly ma-jor health problem that is frequently called an epidemic of the twenty-first century. Despite advances in modern treatment, the mortality rate in CHF patients remains high. Risk stratification in these patients is still one of the major challenges of con-temporary cardiology. Patients with CHF often develop breathing abnormalities, including various forms of periodic breathing (PB) patterns. Cheyne–Stokes respira-tion (CSR) is characterized by repetitive gradual increases and subsequent gradual decreases in ventilation, followed by periods of apnea. PB in CHF patients has a similar increase and decrease in ventilation, but there are no periods of apnea. Both ventilatory patterns may have the same mechanistic explanations, as PB is a less severe form of CSR. The prevalence of PB in CHF patients is as high as 70%, and is associated with increased mortality, especially in patients with CSR. The most rele-vant accepted clinical predictors of the outcome of heart failure patients perform well in the prediction of mortality due to disease progression, but the prediction of sudden cardiac death appears more problematic. In ambulatory patients with less severe CHF, symptoms may be less obvious and death is more often sudden in nature. The importance of being able to identify mildly symptomatic CHF patients at risk from sudden cardiac death is of paramount importance.
1.2
Thesis objective
information that could increase understanding of the underlying physiological pro-cesses and help in the diagnosis of these patients.
One goal of this thesis is to obtain objective indices that provide relevant in-formation about the respiratory pattern and the dynamic interaction between heart rate and breathing rate. This could help to improve the weaning outcome in pa-tients on weaning trials and reduce the number of papa-tients who successfully maintain spontaneous breathing and are extubated, but require the reinstitution of mechanical ventilation in less than 48 hours, because they are unable to breathe spontaneously.
Under the hypothesis that an in-depth study of the respiratory pattern could im-prove identification of the risk level of a CHF patient, another goal of this thesis is to obtain objective indices that can provide enhanced information about the pathophys-iological condition of these patients, which could help in the prognosis and subsequent risk stratification of these patients.
A final study should be carried out for each problem, including all the relevant clinical information and all the significant indices. This would increase our knowledge of these patients and contribute to clinical practice.
1.3
Thesis outline
The thesis is organized as follows:
Chapter 2: Weaning and chronic heart failure. An overview is given of the respiratory system. Acute respiratory failure and chronic heart failure are de-scribed briefly, and the state-of-the-art in weaning readiness assessment and periodic breathing in chronic heart failure is discussed.
recognition techniques are reviewed. Support vector machines, and a number of metrics employed to evaluate the performance of respiratory pattern recognition, are described.
Chapter 4: Support vector machines applied to weaning. SVM is used to study the differences between patients with successful weaning trials, patients with unsuccessful trials and patients who successfully pass the trial, but cannot maintain spontaneous breathing and require the reinstitution of mechanical ventilation. The respiratory flow signal and the ECG of the patients are used to characterize the respiratory pattern and cardiorespiratory interactions.
Chapter 5: Time-frequency analysis of the respiratory pattern. This chapter describes a number of time-frequency techniques that are applied to the res-piratory flow signal to characterize the resres-piratory pattern in patients with CHF. We review pre-processing for artefact reduction, various envelope extraction techniques, and a number of parametric and nonparametric methods for power spectral analysis that are applied in all cases to the respiratory flow signal.
Chapter 6: Respiratory pattern analysis applied to chronic heart
fail-ure. This chapter analyses the breathing pattern through the respiratory flow signal in CHF patients and healthy subjects using the envelope of the respiratory flow signal. On the basis of autoregressive power spectral analysis of the envelope, the relevant discriminant band is characterized by a number of spectral parameters.
and serve as indicators of patient condition.
Chapter 8: Conclusions. The outcome and contributions of this thesis are summarized in this chapter. Some possible future extensions are briefly presented for further work on this topic.
Publications derived from this thesis.
Weaning and chronic heart failure
Breathing is essential to life and must occur in the conscious or unconscious state, awake or asleep. The voluntary and involuntary control of the respiratory system is unparalleled and a highly complex process. It constantly adapts to environmental changes, from small environmental variations that are nearly imperceptible to the senses to changes that provoke an explicit response, such as a cough or sneeze. In spite of its relevance to our daily life, some aspects of the mechanics and physiology of the respiratory system are still unknown. Thus, the study of the respiratory system’s complexity has became a promising area, in which scientific progress can be made.
Respiratory failure is a dysfunction of one or more essential components of the respiratory system and represents a medical emergency. Health care professionals treat respiratory failure by restoring normal function, and by using devices such as mechanical ventilators to maintain gas exchange until the respiratory system heals. When mechanical ventilation is discontinued, problems may arise. Extubation failure occurs in 6% to 47% [5] of cases in different populations.
piratory failure. Respiratory pattern is closely linked with the circulatory system, therefore its abnormalities could reveal a loss of stability in the closed-loop chemical control of ventilation. For instance, it has been reported in the literature that patients with chronic heart failure develop specific breathing abnormalities.
To enhance the available information in the diagnosis of patients, we have studied in depth the respiratory pattern of patients with different pathologies, specifically patients on weaning trials and patients with chronic heart failure.
2.1
Respiratory system
The primary role of the respiratory system is to provide oxygen to the tissues and to remove carbon dioxide (Fig. 2.1). To achieve these goals, respiration can be divided into four major functions: (1) pulmonary ventilation, which means the inflow and outflow of air between the atmosphere and the alveoli in the lungs; (2) diffusion of oxygen and carbon dioxide between the alveoli and the blood; (3) transport of oxygen and carbon dioxide in the blood and body fluids to and from the body’s tissue cells; and (4) regulation of ventilation and other aspects of respiration [2].
2.1.1
Pulmonary ventilation
Figure 2.1 The respiratory system. The air is distributed to the lungs by way of the trachea, bronchi and bronchioles (authorized by [2]).
the lungs and a return to the initial volume moves the air out. During inspira-tion, contraction of the diaphragm pulls the lower surfaces of the lungs downward. Then, during expiration, the diaphragm simply relaxes, and the elastic recoil of the lungs, thoracic wall, and abdominal structures compresses the lungs and expels the air (Fig. 2.2). Inspiration is an active process and expiration is generally a passive process, due to the natural elasticity of the lungs.
Figure 2.2 The process of inspiration and expiration (authorized by [2]). there is no reliable method for properly evaluating pulmonary ventilation. Thus, respiration is clinically studied through measurements of static and dynamic volume, pressure and pulmonary capacity [6]
2.1.2
Pulmonary volumes and capacities
Pulmonary volume and capacity measurements can be used to investigate pulmonary disorders, to characterize severity and to control responses to therapy. Measurements are typically reported as absolute volumes, pulmonary capacities and percentages of predicted values, using data derived from large populations of people who are presumed to have normal lung function. The variables that are used to predict normal values include age, sex, weight and height.
volume measurements are obtained by simple spirometry and dynamic measurements are made by forced spirometry. Measurements are influenced by the state of each sub-ject’s breathing mechanism and also by his/her characteristics. Table 2.1 describes some of the static respiratory volume and pulmonary capacity measurements and includes their normal ranges for a healthy subject (Fig. 2.3).
Table 2.1 Static volume measures
Measurement Description Normal value Tidal The amount of air moved into and
Volume (VT) out of the lungs during a normal 500 ml
breath at rest.
Residual The amount of air left in the lungs Volume (RV) following a maximal exhalation. There
is always some air remaining to prevent 1200 ml the lungs from collapsing.
Inspiratory The amount of extra air inspired
Reserve Volume (IRV) (above the tidal volume) during 3000 ml a deep breath.
Expiratory The amount of extra air exhaled
Reserve Volume (ERV) (above the tidal volume) during 1200 ml a forceful breath out.
Vital The most air you can exhale after Capacity (V C) taking the deepest breath you can.
It can be up to ten times more 4500-5500 ml than you would normally exhale.
Total Lung This is the total amount of air Capacity (T LC) the lungs can hold, which is
the vital lung capacity plus 4400-6400 ml the residual volume.
Inspiratory The volume of gas that can be taken Capacity (IC) into the lungs in a full inspiration,
starting from the resting inspiratory 3600 ml position. It is equal to the tidal volume
plus the inspiratory reserve volume. Functional Residual The volume of gas in the lungs at the
Capacity (F RC) end of a normal tidal volume expiration.
The dynamic measurements resulting from spirometry can be used to evaluate the existence of respiratory pathologies in the subject. Numerous parameters have been proposed by different researchers, but spirometry can be fully interpreted with just three of them. Some general considerations for appropriate lung function testing are presented in [7] and some spirometric reference values are given in [8].
Forced Vital Capacity (F V C)
F V C is the maximum volume of air that a subject can forcibly exhale after taking a maximal inspiration. It is a capacity measurement that quantifies pulmonary capacity. It is expressed in litres, as is the percentage of the theoretical reference value. Values greater than or equal to 80% of the theoretical value are considered normal F V C
measurements. The Spanish Society of Pulmonology and Thoracic Surgery (SEPAR) has accepted a theoretical value for Barcelona’s population that is calculated by the following expressions [9]
F V C (M ale) = 0.0678·Height−0.0147·Age−6.0548 (2.1)
F V C (F emale) = 0.0454·Height−0.0211·Age−2.8253 (2.2)
Forced Expiratory Volume in 1 second (F EV1)
F V E1 is the maximum volume of air that a subject can forcibly exhale in the first
second after taking a maximal inspiration. LikeF V C, it is expressed in litres and as a percentage of the theoretical reference value. Within Barcelona’s population, the reference value for a healthy subject is given by
F V E1 (F emale) = 0.0317·Height−0.0250·Age−1.2324 (2.4)
In general, F V E1 increases from childhood and reaches a maximum value at around
25 years old. It has been proved to be a discriminating factor in the prediction of obstructive disorders characterized by a reduction in airflow [9].
F EV1/F V C ratio
Represented as F EV1 / F V C or F EV1%, this is the percentage of FVC exhaled
during a forced expiration. A drop in this index implies the existence of respiratory obstruction. The F EV1 /F V C value varies with age and is higher in healthy young
people than in older people. A percentage of 75% is considered normal in young people and 70% in elderly people [9].
2.1.3
Respiratory flow and volume signals
Respiratory flow occurs by convection, as a result of the pressure difference be-tween the chest and the atmosphere. It is a measure of the circulating air volume over time. Consequently, it can be estimated through a time derivative of the vol-ume signal. During inspiration, the air volvol-ume increases and the airflow is positive. In contrast, during expiration the volume decreases, which generates negative flow values. Usually, the flow signal’s sign changes position to indicate the beginning and the end of breathing cycles. Forced expiratory vital capacity and forced expiratory volume are exceedingly useful as simple clinical pulmonary tests to study respiratory abnormalities (Fig. 2.4).
2.1.3.1 Respiratory signal acquisition
The most common methods to acquire the respiratory flow signal are: plethysmogra-phy, which is based on quantifying abdominal and thoracic respiratory movements, and pneumotachography, which is based on quantifying the air that moves into and out of the patient. Respiratory inductive plethysmography is a widely accepted method for quantitative and qualitative noninvasive respiratory measurements. When correctly calibrated, respiratory inductive plethysmography allows the measurement of volume and time components of the breathing cycle, as well as the relative partic-ipation of thorax and abdomen in this cycle [10].
Figure 2.4 Forced vital capacity measurements in a healthy and with partial airway obstruction subject (The “ zero” on the volume scale is the residual volume), (authorized by [2]).
plethys-mograph. The same comparison was carried out with the pneumotachograph as it is currently used for breathing pattern analysis.
2.1.4
Respiratory failure or insufficiency
Respiratory failure is a syndrome of inadequate gas exchange due to the dysfunction of one or more essential components of the respiratory system. The diagnosis and treatment of most respiratory disorders depend heavily on understanding the basic physiological principles of respiration and gas exchange. Some respiratory diseases result from inadequate ventilation. Others result from abnormalities of diffusion through the pulmonary membrane or abnormal blood transport of gases between the lungs and the tissues. The therapy is often entirely different for these diseases, so it is no longer satisfactory simply to diagnose “respiratory insufficiency”. Respiratory failure can be classified into:
• Type I or hypoxemic respiratory failure: failure of oxygen exchange, the blood oxygen saturation may fall critically.
• Type II or hypercapnic respiratory failure: failure to exchange or remove carbon dioxide, which manifests as abnormally high carbon dioxide.
• Type III or perioperative respiratory failure: increased atelectasis due to low functional residual capacity linked to abnormal abdominal wall mechanics. At-electasis is defined as the lack of gas exchange within alveoli, due to alveolar collapse or fluid consolidation.
ventilation is to stabilize gas exchange and to unload the respiratory muscles, thus lowering their oxygen consumption.
Respiratory failure represents a medical emergency. Health care professionals treat respiratory failure by restoring normal function, assisting crippled function or using devices such as mechanical ventilators to sustain gas exchange until the respiratory system heals [2].
2.1.5
Mechanical Ventilation
Mechanical ventilation is a method to assist or replace spontaneous breathing. It is the principal medical treatment for acute respiratory failure, and one of the most com-monly used techniques in intensive care. Although mechanical ventilation provides assistance for breathing when the patient’s spontaneous ventilation is not sufficient to maintain life, it does not cure a disease. Hence, the patient’s underlying condition should be resolved over time.
Mechanical ventilation is initiated in situations of apnea, oxygen deficiency, acute ventilatory failure, imminent ventilatory failure, resuscitation from cardiorespiratory arrest, under anaesthetics, in cases of drug overdose, muscular paralysis, central ner-vous system malfunction, peripheral neuropathy, intoxications, loss of mechanical integrity of the thorax, hydroelectrolytic imbalance, pulmonary contusion, correction of mitral stenosis with severe pulmonary hypertension, acid aspiration and so on.
Invasive mechanical ventilation is associated with risks and complications that prolong the duration of the procedure and increase the risk of death. Therefore, discontinuation of mechanical ventilation should be performed as soon as possible.
con-trolled ventilation, assisted ventilation, assisted concon-trolled ventilation, intermittent mandatory ventilation, synchronized intermittent mandatory ventilation, pressure support ventilation, high-frequency oscillatory ventilation and so on.
2.1.6
Modes of mechanical ventilation
Ventilation modes are generally classified into controlled or assisted ventilation. In controlled ventilation, the ventilator initiates the breaths and does all the work of breathing. In assisted ventilation, the patient initiates and terminates some or all the breaths and the ventilator provides varying amounts of support throughout the respiratory cycle [13]. In order to meet the specific needs of each patient, mechanical support can be supplied by a number of ventilation modes, such as:
• Controlled ventilation (CV) is indicated primarily for patients who are unable or not required to generate a voluntary respiratory effort. It is a time-cycling process. The timing mechanism generates the inspiratory tidal volume breath, independent of the patient’s respiratory effort. During this ventilation mode, the ventilator does not allow the patient to self-generate a tidal volume breath and assumes all the work.
• Assisted controlled ventilation (ACV) is a combination of the previous modes (CV and AV). During assisted controlled ventilation, the patient receives a predetermined mechanical respiratory rate and tidal volume, as with CV, but is able to self-generate additional tidal volume breaths. The self-generated breaths occur due to the negative pressure created by the patient within the ventilator circuit.
• Intermittent mandatory ventilation (IMV) is similar to ACV, but it allows the patient to breathe spontaneously between predetermined ventilator breaths. The ventilator delivers a predetermined tidal volume at specific time intervals. Moreover, patients can determine their own tidal volume and respiratory rate during spontaneous breathing. This allows patients to slowly increase the work of breathing and provides more independence from full ventilator support. IMV can be used as full ventilator support with a high respiratory rate or as partial ventilator support.
• Synchronized intermittent mandatory ventilation (SIMV) is similar to IMV. The only difference is that the patient’s own spontaneous breathing pattern is synchronous with the SIMV rate. During SIMV, the patient receives a pre-determined number of mechanical ventilation breaths plus any additional self-generated breaths. The system prevents the accumulation of breaths between the mechanical breath and the patient’s spontaneous inspiratory tidal volume.
the ventilator circuit. In addition, PSV is used as a tool for ventilator weaning, since it requires full spontaneous respiratory effort by the patient.
• Continuous positive airway pressure (CPAP) consists of a continuous level of elevated pressure that is provided through the patient circuit to maintain ad-equate oxygenation and decrease the work of breathing. There is no cycle of ventilator pressure, and the patient must initiate all breaths. Moreover, no ad-ditional pressure above the CPAP pressure is provided during breaths. CPAP may be used invasively through an endotracheal tube or non-invasively with a face mask or nasal prongs.
2.2
Discontinuation of mechanical ventilation or
weaning
Weaning is usually carried out by gradually removing the mechanical support as spontaneous breathing is resumed. It involves the entire process of liberating the patient from mechanical support and from the endotracheal tube, including relevant aspects of terminal care.
2.2.1
Weaning methods
Different modes of mechanical ventilation have been used in weaning. Indeed, some modes, such as intermittent mandatory ventilation (IMV), were introduced specifi-cally for weaning, and were then subsequently used for mechanical ventilatory sup-port. Specifically, the ventilatory modes used for weaning include T-tube test, in-termittent mandatory ventilation, synchronized inin-termittent mandatory ventilation, pressure support ventilation, and so on [14] and [15].
T-tube test forces the patient to breathe spontaneously through a T-tube sys-tem before the final disconnection from the ventilator. The T-tube syssys-tem does not introduce additional breathing work. Periods of spontaneous ventilation are grad-ually lengthened, according to patient capability and endurance, until the patient becomes free from mechanical ventilation day and night. Extubation is postponed until successful weaning has been demonstrated. T-tube test is the simplest and most commonly used weaning mode. Psychological preparation is essential for patients to be weaned by this method. It is generally used in patients who have been venti-lated for short periods, since some patients poorly tolerate the change from ventilator support to complete spontaneous breathing.
from continuous mechanical ventilation to spontaneous breathing. Ventilator deliv-ered breathing is progressively reduced as the patient’s respiratory function improves. The patient is then weaned to spontaneous breathing by a T-tube or a CPAP circuit when the IMV ventilator’s breath rate is as low as 2-4 breaths/min. In synchro-nized intermittent mandatory ventilation, the mechanical breaths are provided by assisted ventilation. If no breath is generated within a predetermined time period, a mandatory ventilator breath is automatically delivered.
Pressure support ventilation is the most commonly used weaning method. It provides constant, preset airway pressure at the start of inspiration. Pressure support stops after a given fraction of inspiratory time or when inspiratory flow falls below a predetermined fraction of the initial inspiratory flow. Expiration is passive. The pressure support level is gradually decreased as the patient improves, but the volume is not controlled. This method also allows a gradual transition from mechanical to spontaneous ventilation. Low levels of PSV (e.g. 5-10 cm H2O) increase spontaneous
tidal volumes and help to reduce inspiratory work from circuit impedance. High levels of PSV (e.g. 20 cm H2O) are analogous to using the assisted ventilation mode in a
pressure cycled ventilator, and will result in variable tidal volumes in a patient with unstable respiratory mechanics. When the required PSV is less than 2-3 cm H2O,
the patient is usually changed to spontaneous breathing by a T-tube system.
2.2.2
Weaning indices
(P EEP) between 5-8 cm H2O; (c) F iO2 <50%; (d) pH >7.25; and (e) ability to
initiate spontaneous breaths. Some of the subjective indices include: (a) hemody-namic stability; (b) absence of active myocardial ischemia; (c) absence of clinically significant, vasopressor-requiring hypotension; (d) appropriate neurological examina-tion; (e) improving or normal chest radiogram; and (f) adequate muscle strength that enables the patient to initiate and sustain respiratory effort [16].
Table 2.2 Commonly used clinical parameters that predict successful wean-ing from mechanical ventilation
Parameter Desired value
Respiratory rate (f) Less than 30-38 breaths/min Tidal volume (VT) 4-6 ml/kg
Minute ventilation ( ˙VE) 10-15 l/min
Negative inspiratory force (N IF) -20 to -30 cm H2O
Maximal inspiratory pressure (Pmax) -15 to -30 cm H2O
Mouth occlusion pressure 100 ms after the onset 0.3 of inspiratory effort (P0.1) divided by Pmax
Rapid shallow breathing index (RSBI) 60-105 breaths/min ·l (respiratory rate divided by tidal volume, f /VT)
Rapid shallow breathing index rate Less than 20% [(RSBI2 -RSBI1)/RSBI1] · 100
CROP score (index including compliance, 13 rate, oxygenation and pressure)
2.2.3
Weaning versus extubation risks
reintubation within a specified time period of 24-72 hours or up to 7 days. Weaning predictors and outcomes have been extensively described in the literature. However, most of them do not accurately predict extubation results. Intensive care units (ICU) aim to predict extubation failure, since both delayed and failed extubation have detri-mental consequences, including prolonged mechanical ventilation, a longer ICU stay, a need for tracheostomy, higher treatment costs and greater mortality [19] and [20].
According to a study carried out by Kulkarni [5], the incidence of extubation fail-ure varies between 6 and 47%. Patients who needed reintubation required mechanical ventilation for significantly longer, had longer ICU and hospital stays and greater mor-tality. The reported [19] and [21] mortality rates in patients with extubation failure vary between 30 and 40%.
As stated by Kulkarni [5], deconditioned muscles, poor nutrition, upper airway edema due to prolonged translaryngeal intubation, an inability to clear secretions, a decreased level of consciousness due to the persistent effects of sedative and analgesics and critical illness polyneuropathy can all lead to extubation failure.
extubation failure.
Esteban and colleagues [22] found lower mortality for patients who were reintu-bated for upper airway obstruction than those reintureintu-bated for respiratory failure (7% vs. 30%). This is because reintubation for upper airway obstruction rapidly corrects respiratory dysfunction; whereas organ dysfunction that is related to other causes of extubation failure may not be readily reversible.
The third hypothesis is that clinical deterioration occurs during spontaneous breathing with the development of new organ dysfunction, thereby increasing mortal-ity. This may partly explain the relationship between the cause of extubation failure and the outcome. This hypothesis is further supported by the increase in mortality with increasing time between extubation and reintubation, independent of the eti-ology of the extubation failure. Mortality due to respiratory failure increased four times when reintubation occurred >12 h after extubation.
Another similar hypothesis assumes that there is a relationship between delay in reintubation and increased mortality. This delay allows progressive clinical deterio-ration in the patient’s condition, which leads to organ dysfunction/failure.
2.2.4
Recommended weaning
2.2.4.1 Weaning process
Tobin proposed [23] six stages in the process of care, from intubation and initiation of mechanical ventilation through to the initiation of the weaning effort and the final liberation from mechanical ventilation and successful extubation. These stages consist in:
• The clinician suspects that weaning may be possible.
• The clinician actually initiates a process of daily tests of readiness to wean so as to confirm this suspicion.
• The spontaneous breathing trial (SBT) is performed when the results of the daily test confirm a high enough probability of passing the SBT , which is defined as a T-tube test or low-level pressure support (≤8 cm H2O).
• Extubation or removal of the endotracheal tube, if the SBT is successful.
• Reintubation with an endotracheal tube if the patient is unable to maintain spontaneous breathing.
2.2.4.2 Spontaneous breathing trial, SBT
Some reports claim that the best method to assess whether a patient is able to breathe on his/her own is to perform a trial of spontaneous ventilation. Numerous studies [15], [22], [24] and [25] have shown that 60-80% of mechanically ventilated patients can be successfully extubated after passing a spontaneous breathing trial (SBT). The best technique for such trials is not yet clear.
SBT that compared the use of continuous positive airway pressure of 5 cm H2O
with a T-tube test for one hour revealed no difference in the percentage of patients who failed extubation. In a study carried out by the Spanish Lung Failure Collaborative Group, no differences were observed in the percentage of patients who remained extubated 48 hours after trials of spontaneous breathing with either T-tube test or pressure support ventilation of 7 cm H2O. In the case of the T-tube, 63% of patients
addition, when SBT trials of 30 minutes were compared with those of 120 minutes, no differences were found in the rate of successful extubation (84% vs. 89%) between the members of the two study groups [22] who tolerated the SBT.
2.2.4.3 SBT readiness
Table 2.3 Considerations for assessing readiness to wean [1]
Clinical assessment
Adequate cough
Absence of excessive tracheobronchial secretion
Resolution of acute disease phase for which the patient was intubated
Objective measurements
Clinical stability
Stable cardiovascular status (i.e. fC ≤ 140 beats/min,
systolic BP 90−160 mmHg, no or minimal vasopressors) Stable metabolic status
Adequate oxygenation
SaO2 >90% on ≤F IO2 0.4 (or P aO2/F IO2 ≥150 mmHg)
P EEP ≤8 cm H2O
Adequate pulmonary function
fR ≤35 breaths/min
Pmax ≤-20 to -25 cm H2O
VT >5 ml/kg
V C >10 ml/kg
f /VT <105 breaths/min · l
No significant respiratory acidosis
Adequate mental state
No sedation or adequate mental state under sedation (or stable neurologic patient)
fC: cardiac frequency;BP: blood pressure;SaO2: arterial oxygen saturation;F IO2: inspiratory
oxygen fraction;P aO2: arterial oxygen tension;P EEP: positive end expiratory pressure;f:
respiratory frequency;Pmax: maximal inspiratory pressure;VT: tidal volume;V C: vital capacity.
2.2.4.4 SBT failure
Weaning success is defined as extubation and the absence of ventilatory support 48 hours after extubation. Weaning failure is defined as a failed SBT or reintubation of the endotracheal tube for reinstitution of ventilatory support after a successful extubation or death within 48 hours after extubation.
Numerous studies [15], [26], [22], [24] and [27] have demonstrated that approx-imately 13% to 25% of patients who successfully pass the SBT and are extubated require reintubation. In patients who do not receive an SBT and are extubated, the failure rate is 40%. The criteria used to pass SBT include respiratory pattern, adequate gas exchange, hemodynamic stability and subject comfort.
As recommended by consensus [1], when patients fail an initial SBT, the clinician should repeat the SBT frequently (daily) to determine the earliest time at which the patient can be successfully extubated. The criteria for SBT failure are defined in Table 2.4.
2.2.4.5 Extubation
Table 2.4 Failure parameters of spontaneous breathing trials [1]
Clinical assessment and subjective indices
Agitation and anxiety Depressed mental status Diaphoresis
Cyanosis
Evidence of increasing effort
Increased accessory muscle activity
Facial signs of distress
Dyspnoea
Objective measurements
P aO2 ≤50-60 mmHg on F IO2 ≥0.5 or SaO2<90%
P aCO2 >50 mmHg or an increase in P aCO2 >8 mmHg
pH <7.32 or a decrease in pH ≥0.07 pH units
f /VT >105 breaths/min
f >35 breaths/min or increased by ≥50%
fC >140 beats/min or increased by≥20%
Systolic BP >180 mmHg or increased by ≥20% Systolic BP <90 mmHg
Cardiac arrhythmias
P aO2: arterial oxygen tension;F IO2: inspiratory oxygen fraction;SaO2: arterial oxygen
saturation;P aCO2: arterial carbon dioxide tension;f: respiratory frequency;VT: tidal volume;
Extubation failure is defined mainly by the clinical criteria shown in Table 2.5.
Table 2.5 Criteria for extubation failure [1]
f >25 breaths/min for 2 hours
fC >140 beats/min or sustained increase or decrease of>20%
Clinical signs of respiratory muscle fatigue or increased work of breathing
SaO2 <90%; P aO2 <80 mmHg on F IO2 ≥0.50
Hypercapnia (P aCO2 >45 mmHg or 20% from pre-extubation), pH <7.33 f: respiratory frequency;fC: cardiac frequency;SaO2: arterial oxygen saturation; P aO2: arterial
oxygen tension;F IO2: inspiratory oxygen fraction;P aCO2: arterial carbon dioxide tension. 1
mmHg = 0.133 kPa.
2.3
Weaning readiness prediction by means of
sig-nal processing
Since weaning indicator selection and threshold setting for these descriptors may vary according to clinicians’ perceptions, we studied objective indices that were ex-tracted from temporal data by signal processing. These indices might help clinicians in their decisions to increase or decrease the level of respiratory support [25]. They may minimize incorrect decisions and inter/intra expert variability.
Numerous studies have been carried out to detect which physiological variables can identify readiness to undertake a weaning trial. The accuracy of a number of variables has been assessed by statistical tests that determine whether significant differences exist between a group of patients who underwent a successful weaning trial, those who failed such a trial, and those who successfully passed a weaning trial and the extubation process, but had to be reconnected because they were not able to maintain spontaneous breathing. Most of the information collected in the studies [29], [30], [14], [15], [31] and [26] establishes different guidelines for weaning criteria and protocols.
Multiple signal processing methods have been used to assess weaning and the extubation outcome. These techniques include tasks concerning the reduction of artefacts in noisy temporal signals, the treatment of missing data, feature extraction from temporal data, trend detection and processing techniques for multiple channel data merging. Some of the signal processing methods that are used in the weaning problem and their accuracy in weaning prediction are discussed in [29].
weaning process will be successful or a failure.
A number of factors may influence weaning prediction, such as weaning indices, extubation criteria, days of mechanical ventilation before weaning, different clinical procedures, differences between patient populations and even the etiology of the res-piratory failure [26], [32], [33] and [34]. Although some weaning indices appear to be useful in many studies, there is no one criterion available for all population groups [29]. Thus, indicators for accurate prediction are still under research.
2.3.1
Linear methods
One simple way of analysing the data is by applying descriptive statistics (means and dispersion measures) to the dataset. From a physiological perspective, these methods are easy to interpret, but they do not yield information on the system dynamics.
Analyses of respiratory function are commonly performed in terms of inspiration and expiration time series, which are often referred to as breathing pattern vari-ables [35]. Inspiratory time (TI), expiratory time (TE), breath duration (TT ot), tidal
volume (VT), fractional inspiratory time (TI/TT ot), mean inspiratory flow (VT/TI)
and frequency-tidal volume ratio (f /VT), where f is the respiratory frequency, are
some of the time series that are studied [36] and [37].