ADVERTIMENT. La consulta d’aquesta tesi queda condicionada a l’acceptació de les següents condicions d'ús: La difusió d’aquesta tesi per mitjà del servei TDX (www.tesisenxarxa.net) ha estat autoritzada pels titulars dels drets de propietat intel·lectual únicament per a usos privats emmarcats en activitats d’investigació i docència. No s’autoritza la seva reproducció amb finalitats de lucre ni la seva difusió i posada a disposició des d’un lloc aliè al servei TDX. No s’autoritza la presentació del seu contingut en una finestra o marc aliè a TDX (framing). Aquesta reserva de drets afecta tant al resum de presentació de la tesi com als seus continguts. En la utilització o cita de parts de la tesi és obligat indicar el nom de la persona autora.
ADVERTENCIA. La consulta de esta tesis queda condicionada a la aceptación de las siguientes condiciones de uso: La difusión de esta tesis por medio del servicio TDR (www.tesisenred.net) ha sido autorizada por los titulares de los derechos de propiedad intelectual únicamente para usos privados enmarcados en actividades de investigación y docencia. No se autoriza su reproducción con finalidades de lucro ni su difusión y puesta a disposición desde un sitio ajeno al servicio TDR. No se autoriza la presentación de su contenido en una ventana o marco ajeno a TDR (framing). Esta reserva de derechos afecta tanto al resumen de presentación de la tesis como a sus contenidos. En la utilización o cita de partes de la tesis es obligado indicar el nombre de la persona autora.
FREEZE CONCENTRATION
OF COFFEE EXTRACT: STUDY
OF BLOCK AND
FALLING-FILM TECHNIQUES
2014
Fabian Leonardo Moreno Moreno
UNIVERSIDAD DE LA SABANA
BIOSCIENCE DOCTORATE PROGRAM UNIVERSIDAD DE LA SABANA
AGRIBUSINESS TECHNOLOGY AND BIOTECHNOLOGY DOCTORATE UNIVERSITAT POLITÈCNICA DE CATALUNYA BARCELONATECH
FREEZE CONCENTRATION OF COFFEE EXTRACT: STUDY OF BLOCK AND FALLING-FILM TECHNIQUES.
Author:
Eng. MSc. Fabian Leonardo Moreno Moreno
This work has been carried out under the direction of:
Dr. Ruth Yolanda Ruiz Pardo Dr. Mercè Raventós Santamaría
UNIVERSIDAD DE LA SABANA DOCTORADO EN BIOCIENCIAS
UNIVERSIDAD POLITÉCNICA DE CATALUÑA BARCELONATECH DOCTORADO EN TECNOLOGÍA AGROALIMENTARIA Y BIOTECNOLOGÍA
CRIOCONCENTRACIÓN DE EXTRACTO ACUOSO DE CAFÉ: ESTUDIO DE LAS TÉCNICAS DE BLOQUE TOTAL Y PELÍCULA DESCENDENTE.
Autor:
Ing. MSc. Fabian Leonardo Moreno Moreno
Memoria presentada para optar al título de
Doctor en Biociencias por la Universidad de La Sabana
y
Doctor por La Universidad Politécnica de Cataluña
Directores:
Dr. Ruth Yolanda Ruiz Pardo Dr. Mercè Raventós Santamaría
ii
iii
AGRADECIMIENTOS
Es un gran placer para mí agradecer sinceramente a todas las personas que contribuyeron a la realización de esta tesis doctoral.
En primer lugar agradezco a mis directoras, Dra. Ruth Yolanda Ruíz y Dra. Mercè Raventós Santamaria, por su acertada dirección, por su contribución, guía, disposición y apoyo constante durante toda la realización de la tesis. Gracias por la gestión de la cotutela que me ha permitido vivir la experiencia del desarrollo de la tesis en dos excelentes universidades.
Agradezco al Dr. Eduard Hernández por su apoyo desde el comité tutorial y su contribución en la discusión de aspectos fundamentales del proyecto. Gracias por su apoyo y amistad durante las estancias en la UPC
Al Dr. Josep Auleda, por su orientación en la fase inicial del proyecto y por su amistad. A la ingeniera Catalina Robles, por su apoyo en la realización de la fase experimental y su total disposición durante el proyecto.
Al Dr. Mauricio Pardo Benito, por la participación en el comité tutorial, por ser gestor del proyecto y por su constante contribución en el desarrollo del mismo.
A la Dra. Indira Sotelo por sus consejos y apoyo permanentes.
Al Ing. Carlos Eduardo Osorio, de la empresa Buencafé liofilizado de Colombia, por su apoyo en el proyecto, por la asesoría y por permitirme contrastar tecnologías de crioconcenrtación aplicadas a la industria de café.
A todas las personas que colaboraron en la fase experimental. Dr Sergio Cuervo por su ayuda en los ensayos de cromatografía, Dra Ximena Quintanilla por su ayuda en los ensayos de análisis de imágenes, Ing. Yomaira Uscategui por su ayuda en los ensayos de actividad antioxidante y al personal de los laboratorios de Procesos Agroindustriales de la Universidad de La Sabana y la planta pilot d`aliments de la Universidad Politécnica de Cataluña por su colaboración.
A los estudiantes de Ingeniería de Producción Agroindustrial de la Universidad de La Sabana que participaron en el proyecto global.
A mis compañeros del Doctorado en Biociencias, por su amistad y por su ejemplo. A mi familia, por ayudarme siempre a cumplir mis metas.
iv
ABSTRACT
Coffee is the most traded food in the world. The coffee industry has a great economic and social relevance worldwide. The sensory and functional properties of the product are highly important for the consumers, and therefore, technologies that promote quality preservation are highly valued in coffee processing. In the production of freeze-dried coffee, freeze concentration is used to remove water from the extract. Water removal in freeze concentration is achieved by cooling the solution until ice crystals form and separate. Freeze concentration is a technology known for its ability to preserve the quality of the product thanks to low processing temperatures.
Three techniques are used according to ice crystal growth: suspension, film (progressive or falling-film) and block (total or partial). Suspension freeze concentration is the most implemented technique at the industrial level. This is an efficient technique in terms of ice purity and increased concentration; however, it requires complex systems for ice separation and many moving parts, which increases the initial and operating costs. For this reason, other freeze concentration techniques have been studied. Different techniques, such as falling-film freeze concentration, and block freeze concentration are being developed seeking to reduce operational costs.
In the present work, block and falling-film freeze concentration techniques used to concentrate aqueous coffee extract were studied. Equipment to study those techniques was designed and implemented. The effect of the operational variables of block and falling-film freeze concentration on separation efficiency was established. Preservation of bioactive compounds, volatile compounds, antioxidant activity, and sensory quality of the coffee extract when using freeze concentration was demonstrated. Finally, an operational strategy was proposed to integrate the studied techniques. Separation efficiency obtained with this process was comparable to industrial standards.
v
RESUMEN
El café es el alimento más comercializado en el mundo y por esto es alta su importancia económica y social. En la industria del café, la calidad sensorial y funcional de la bebida es un parámetro de alta importancia, por lo cual se promueve el uso de tecnologías de proceso que permitan su preservación. En el proceso de obtención de café soluble liofilizado se utiliza la crioconcentración como una etapa para la eliminación parcial del agua del extracto.
La crioconcentración es una tecnología para la eliminación de agua de soluciones mediante su enfriamiento hasta la formación y separación de cristales de hielo. Es una técnica que puede preservar la calidad del producto debido a las bajas temperaturas que maneja.
Existen tres técnicas de crioconcentración: suspensión, película y bloque. La única técnica disponible comercialmente a nivel mundial es la crioconcentración en suspensión. Esta es una técnica que logra altas eficiencias de separación pero los equipos requieren gran número de partes móviles por lo cual es relativamente costosa. Debido a esto se busca el desarrollo de técnicas más simples que a la vez consigan una alta eficiencia en la separación. La crioconcentración en película descendente y en bloque son nuevas técnicas que se han propuesto como alternativas más simples que pueden reducir costos operacionales.
En el presente proyecto se estudió la crioconcentración en bloque total y en película descendente para la obtención de extractos concentrados de café. Se realizó el diseñó de una unidad de estudios para la crioconentración. Igualmente, se estableció el efecto de las variables operativas de la crioconcentración en bloque y en película sobre la eficiencia de la separación y se demostró la preservación de los componentes bioactivos, la preservación de los componentes volátiles y de la calidad sensorial del extracto de café. Se obtuvieron modelos matemáticos para la predicción del coeficiente de distribución en el hielo que permite predecir el comportamiento de la crioconcentración. Finalmente, se propuso una estrategia operativa para integración de las técnicas estudiadas que permite obtener eficiencias de separación acordes con los estándares industriales.
vi
RESUM
El cafè és l'aliment més comercialitzat del món i té una gran importància econòmica i social. En la indústria del cafè, la qualitat sensorial i funcional de la beguda és un paràmetre important la qual cosa incentiva l'ús de tecnologies de procés que permetin mantenir-ne la qualitat. Durant el procés d'obtenció de cafè liofilitzat s'utilitza la crioconcentració com etapa prèvia d'eliminació de part de l'aigua continguda en la solució.
La crioconcentració és una tecnologia que permet l'eliminació d'aigua d'una solució a través del seu refredament fins a la formació i la separació dels cristalls de gel. Es tracta d'una tècnica que pot preservar la qualitat del producte a causa de les baixes temperatures utilitzades.
Hi ha tres tècniques de crioconcentració: suspensió, pel·lícula i bloc. La única tècnica disponible comercialment arreu del món és la crioconcentració en suspensió. Aquesta és una tècnica que aconsegueix una gran eficiència en la separació, però és relativament cara per la qual cosa es busca el desenvolupament de tècniques més senzilles que al mateix temps aconsegueixin una alta eficiència de separació. La crioconcentració de pel·lícula descendent i en bloc es mostren com a alternatives. En aquest projecte hem estudiat la crioconcentració en bloc total i en pel·lícula descendent per a la producció d'extractes concentrats de cafè. S'ha dissenyat una unitat d'estudi per a la crioconcentracio. També s'ha establert l'efecte de les variables operatives de la crioconcentració en bloc i pel·lícula sobre l'eficàcia de la separació i s'ha demostrat la preservació de compostos bioactius, la preservació dels components volàtils i de la qualitat sensorial de l'extracte de cafè. S’han obtingut models matemàtics per a la predicció del coeficient de distribució en el gel que li permeten predir el comportament de la crioconcentració. Finalment, es proposa una estratègia operativa per a la integració de les tècniques estudiades permetent obtenir eficiències de separació coherents amb estàndards de la indústria.
vii
CONTENT
ABSTRACT ...iv
RESUMEN ... v
RESUM ...vi
CONTENT ... vii
LIST OF FIGURES ...xi
LIST OF TABLES ... xiii
1. INTRODUCTION ... 1
1.1. State of the art ... 1
1.1.1. Coffee ... 1
1.1.1. Freeze Concentration ... 2
1.1.1. Suspension Freeze Concentration ... 3
1.1.1. Film Freeze Concentration ... 4
1.1.1. Block Freeze Concentration ... 6
1.2. Research question ... 8
1.2. Objectives ... 9
1.2.1. General Objective ... 9
1.2.1.1. Specific Objectives ... 9
1.3. Structure of the document ... 10
1.4. Published papers ... 12
2. DESIGN OF AN EQUIPMENT FOR THE STUDY OF BLOCK AND FALLING-FILM FREEZE CONCENTRATION ... 13
2.1. Systems of the Test Unit ... 13
2.2. Structure of the Freeze Concentration Unit ... 14
2.3. Design Parameters and Operational Intervals. ... 16
3. RHEOLOGICAL BEHAVIOUR, FREEZING CURVE, AND DENSITY OF COFFEE SOLUTIONS AT TEMPERATURES CLOSE TO FREEZING ... 19
3.1. Abstract ... 19
3.2. Introduction ... 20
3.3. Materials and methods ... 21
3.4. Results and discussion ... 23
3.5. Conclusions ... 31
viii
4. BLOCK FREEZE-CONCENTRATION OF COFFEE EXTRACT: EFFECT OF FREEZING AND THAWING STAGES ON SOLUTE RECOVERY AND BIOACTIVE
COMPOUNDS ... 34
4.1. Abstract ... 34
4.2. Introduction ... 35
4.3. Materials and Methods ... 36
4.3.1. Materials ... 36
4.3.2. Methods ... 36
4.4. Results and discussion ... 42
4.4.1. Temperature profiles ... 42
4.4.2. Freeze-concentration tests ... 42
4.4.3. Effect of each operational factor on solute recovery ... 45
4.4.4. Bioactive compounds and the antioxidant activity of coffee ... 50
4.5. Conclusions ... 51
4.6. References ... 52
5. EFFECT OF SEPARATION AND THAWING MODE ON BLOCK FREEZE-CONCENTRATION OF COFFEE BREWS ... 55
5.1. Abstract ... 55
5.2. Introduction ... 55
5.3. Materials and methods ... 56
5.3.1. Materials ... 56
5.3.2. Methods ... 57
5.3.3. Data analysis and modeling ... 58
5.3.4. Mathematical model ... 59
5.3.5. Statistic analysis ... 60
5.4. Results and discussion ... 60
5.5. Conclusions ... 66
5.6. References ... 67
6. BEHAVIOUR OF FALLING-FILM FREEZE CONCENTRATION OF COFFEE EXTRACT ... 69
6.1. ABSTRACT ... 69
6.2. Introduction ... 70
6.3. Materials and Methods ... 71
6.3.1. Materials ... 71
6.3.2. Methods ... 71
ix
6.4.1. Effect of the average ice growth rate and the fluid velocity ... 74
6.4.2. Effect of solid concentration ... 76
6.4.3. Mathematical modelling ... 77
6.4.4. Model for solid concentration prediction in successive stages ... 79
6.5. Conclusions ... 80
6.6. References ... 81
7. VOLATILE COMPOUNDS PRESERVATION AND SOLUTES RETENTION OF BLOCK AND FALLING-FILM FREEZE CONCENTRATION OF COFFEE EXTRACT . 84 7.1. Abstract ... 84
7.2. Introduction ... 84
7.3. Materials and Methods ... 86
7.3.1. Materials ... 86
7.3.2. Methods ... 86
7.4. Results ... 90
7.4.1. Freeze Concentration Tests ... 90
7.4.2. Image Analysis of Morphological Structure of the Ice Crystals ... 91
7.4.3. Identification and Quantification of the Volatile Compounds ... 93
7.4.4. Sensory Evaluation ... 96
7.5. Conclusions ... 98
7.6. References ... 98
8. A PROCESS TO CONCENTRATE COFFEE EXTRACT BY THE INTEGRATION OF FALLING FILM AND BLOCK FREEZE-CONCENTRATION ... 103
8.1. Abstract ... 103
8.2. Introduction ... 103
8.3. Materials and Methods ... 104
8.3.1. Materials ... 104
8.3.2. Methods ... 105
8.4. Results and Discussion ... 108
8.4.1. Falling film freeze concentration ... 108
8.4.2. Coffee solids recovery by fractionated thawing ... 110
8.4.3. Block freeze-concentration ... 113
8.4.4. Integration of falling film freeze concentration, ice thawing and block freeze concentration ... 114
8.5. Conclusions ... 116
8.6. References ... 117
x
xi
LIST OF FIGURES
Figure 1.1. Process used to obtain soluble coffee ... 2
Figure 1.2. Freeze concentration techniques. Source: The author. ... 3
Figure 1.3. Structure of the document. ... 11
Figure 2.1. Piping and instrumentation diagram of block freeze concentrator. ... 14
Figure 2.2. Piping and instrumentation diagram of falling-film freeze concentrator. ... 14
Figure 2.3. Overall setup of the freeze concentration unit. ... 15
Figure 2.4. Mechanical planes of freeze concentrator. Isometric projection. ... 15
Figure 2.5. Mechanical planes of freeze concentrator. ... 16
Figure 2.6. Block freeze concentrator. ... 17
Figure 2.7. Cooling container ... 17
Figure 2.8. Falling film freeze concentrator. ... 18
Figure 2.9. Freezing chamber. ... 18
Figure 3.1 Cooling curves of coffee solutions. Xs=0.40 ... 25
Figure 3.2. Rheogram of coffee solutions ... 26
Figure 3.3. Coffee solutions viscosity as a function of temperature and coffee mass fraction. ... 30
Figure 4.1. Experimental set up for block freeze concentration ... 37
Figure 4.2. Solute yield during freeze concentration tests. ... 39
Figure 4.3. Temperature profile during freezing and thawing stages. ... 43
Figure 4.4. Effect of coffee mass fraction on solute yield and the concentration index. 46 Figure 4.5. Effect of freezing direction on solute yield and the concentration index. .... 47
Figure 4.6. Effect of cooling temperature on solute yield and the concentration index. 48 Figure 4.7. Effect of heating temperature on solute yield and the concentration index. 49 Figure 5.1. Experimental set up. ... 57
Figure 5.2. Parity plot: experimental Y values against predicted Ŷ values. ... 62
Figure 5.3. Effect of temperature on Solute Yield. ... 63
Figure 5.4. Effect of separation mode on Solute Yield ... 64
Figure 5.5. Effect of Thawing mode on Solute Yield ... 64
Figure 5.6. Effect of Thawing mode on Solute Yield ... 65
Figure 6.1. Experimental setup. ... 72
Figure 6.2. Effect of the ratio between average ice growth rate and fluid velocity on the average distribution coefficient. ... 75
Figure 6.3. Effect of coffee mass fraction on average distribution coefficient ... 76
Figure 6.4. Modelling of the partition coefficient as a function of Xs, V ice and Us. ... 78
Figure 6.5. Parity plot of the average distribution coefficient. ... 78
Figure 6.6. Predicted values of successive stages of falling film freeze concentration of coffee extract. ... 79
Figure 7.1 Experimental set up. (a) block freeze concentrator; (b) falling-film freeze concentrator ... 87
Figure 7.2. Microphotographs of ice crystals of block and falling film-freeze concentration at three positions from the cooling surface. 10X. ... 92
Figure 7.3. Chromatograms of coffee extract. ... 94
xii
Figure 8.1. Flowchart of freeze concentration tests ... 105 Figure 8.2. Experimental setup for freeze concentration tests. ... 106 Figure 8.3. Solid concentration in liquid (○) and ice (□) at each stage of falling film freeze concentration. ... 109 Figure 8.4. Concentration index as a function of the thawing fraction. ... 111 Figure 8.5. Concentration index (CI) at the recommended thawing fraction as a function of the initial solid concentration (C s0) of the ice. ... 112
xiii
LIST OF TABLES
Table 1.1. Main researches on falling-film freeze concentration ... 5
Table 1.2. Main researches on block freeze concentration ... 6
Table 2.1 Systems of the concentration unit. ... 13
Table 3.1 Xs and refractive index as a function of brix degrees for coffee solutions .... 24
Table 3.2. Freezing point of coffee solutions as a function of coffee mass fraction ... 25
Table 3.3. Parameters of power law (Eq. 1) for different coffee mass fractions and temperatures ... 27
Table 3.4. Viscosity of coffee solutions at different temperatures (T) and coffee mass fractions (Xs). (mPa·s) ... 28
Table 3.5. Parameters of Arrhenius equation (Eq. 2.) for coffee solutions at different Xs ... 28
Table 3.6. Parameters of mathematical models for prediction of coffee solution's viscosity. ... 29
Table 3.7. Density of coffee extract (kg·m-3) as a function of coffee mass fraction and temperature. ... 30
Table 4.1. Experimental design ... 37
Table 4.2. Freeze concentration tests in descending order of area under the curve .... 44
Table 4.3. Significance analysis for freeze concentration factors ... 45
Table 5.1. Experimental design ... 58
Table 5.2. Solute recovery ratio. ... 61
Table 5.3. Effect of TT, TM and SM on solute recovery ratio. ... 62
Table 6.1. Experimental design. ... 71
Table 6.2. Multiple regression analysis of Eq. (15) ... 76
Table 6.3. Parameters of Eq. (8) for several food fluids. ... 79
Table 7.1. Results of freeze concentration tests ... 91
Table 7.2. Morphometric parameters of ice crystals produced in block and falling-film freeze concentration ... 93
Table 7.3. Relative percent area of major volatile compounds in coffee extract before and after freeze concentration. ... 95
Table 7.4. Ice loss percentage of volatile compounds after freeze concentration ... 95
Table 7.5. Significance of differences of quantitative descriptive analysis among freeze concentration techniques ... 97
Table 8.1. Initial coffee solid concentration (C s0), concentration index (CI), solute yield at each stage (Y STAGE), ice fraction (f ice) and concentration efficiency (Eff) of falling film freeze concentration tests ... 110
Table 8.2. Concentration of the diluted (C s dil) and concentrated fractions (C s conc) of the recommended thawing fraction (f at CI=1). ... 112
Table 8.3. Results of block freeze concentration. ... 114
1
1. INTRODUCTION
This chapter offers a brief introduction of this thesis. The chapter describes the state of the art of freeze concentration research, the motivations of conducting this study and the research question. Then the objectives of the study are presented. Finally, the chapter introduces the overall structure of the document.
1.1. State of the art
1.1.1. Coffee
Coffee is the second most traded commodity in the world after petroleum and the most traded food worldwide (Esquivel and Jiménez, 2012; Vignoli et al., 2011). Current competition in the coffee industry focuses on product quality. Soluble coffee is a processed product created to facilitate beverage preparation, while preserving product quality (Cheong et al., 2013; Farah et al., 2006).
Two value parameters are recognized in soluble coffee: sensory quality and functional quality. Coffee has more than 800 compounds responsible for its aroma, but few impact compounds are particularly important (Franca et al., 2005; Sarrazin and Que, 2000). The sensory evaluation and volatile compounds determinations are parameters of sensory quality evaluation (Farah et al., 2006). On the other hand, several studies report the health benefits of consuming coffee beverages. Compounds with antioxidant activity have been identified in coffee extract, including those of the chlorogenic acid group: chlorogenic acid (CGA) (3-caffeoylquinic acid), crypto-chlorogenic acid (cCGA) (4-caffeoylquinic acid), neo chlorogenic acid (n-CGA) (5-caffeoylquinic acid), and caffeine (Fujioka and Shibamoto, 2008; Sopelana et al., 2013; Vignoli et al., 2011). Functional quality and organoleptic quality are common parameters used in the evaluation of soluble coffee production.
2
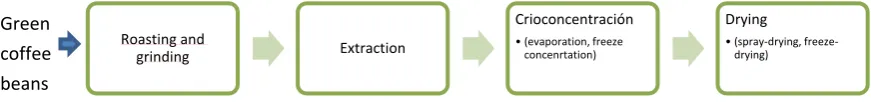
Figure 1.1. Process used to obtain soluble coffee
1.1.1. Freeze Concentration
Freeze Concentration (FC) is a technology used to remove water at low temperatures, preserving the quality of the original material. Water removal in FC is achieved by cooling the solution until ice crystals form and separate, producing a more concentrated fluid (Sánchez et al., 2009). Several industries use freeze concentration technology, including the food industry −fruit juices, dairy products, wine, and beer−, biotechnology and waste water treatment (Aider and de Halleux, 2009b; Sánchez et al., 2009).
Two phases are obtained when the temperature of an aqueous solution is decreased below the freezing point: a liquid phase with higher solute concentration than the initial solution, and a solid phase composed by pure ice in the ideal situation or ice with trapped solutes in the practical situation (Rahman, 2006). This phenomenon is known as solute occlusion (Aider and de Halleux, 2009b; Sánchez et al., 2009) and it implies heat and mass transfer (Petzold and Aguilera, 2009).
The freezing process involves the crystallization of water contained in the solution. Crystallization is the formation of solid particles from a homogenous phase (Chen et al., 1998). This process involves three steps. First, the solution must be subjected to supersaturation or supercooling. Second, a nucleation or production of the first stable particles is needed. Finally, crystal particles grow to their final size depending on temperature conditions (Sánchez et al., 2009). Primary heterogeneous nucleation occurs on surfaces different than the crystal itself, such as the container wall or impurities (Mullin, 2001). Once the ice seeds are produced, they grow through a process known as Ostwald ripening (Aider et al., 2009a). Crystallization plays an important role on the behaviour of freeze concentration technology. Separation is determined by freezing and thawing stages. Research usually focuses on these stages, as well as on the type of solution and the operational variables that have an effect on separation.
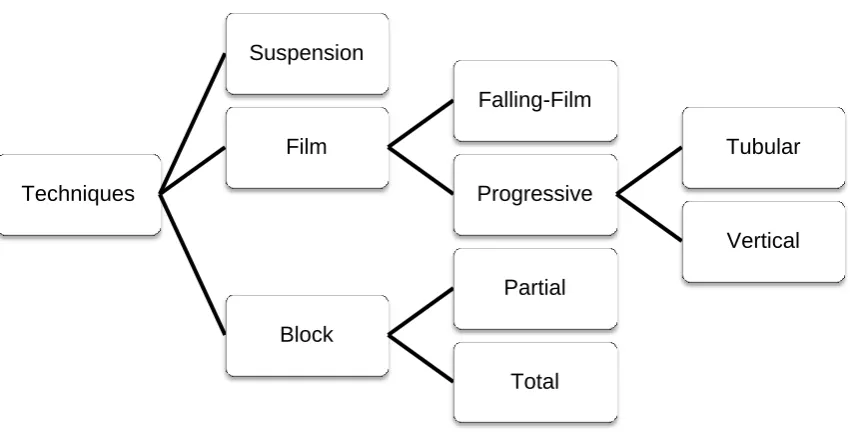
As shown in Fig. 1.2, there are three freeze concentration techniques according to ice crystal growth: suspension FC, film FC (progressive or falling-film FC) and block FC (total or partial) (Aider & de Halleux, 2009b; Sánchez et al., 2009). A brief description of each technique is presented in the following paragraphs.
Roasting and
grinding Extraction
Crioconcentración
• (evaporation, freeze concenrtation)
Drying
• (spray-drying, freeze-drying)
3
Figure 1.2. Freeze concentration techniques. Source: The author.
1.1.1. Suspension Freeze Concentration
Suspension FC is the most implemented technique at the industrial level. This technique was developed by Niro Process Technology B.V. It comprises three stages (Sánchez et al., 2009): crystallization, ripening, and separation of ice crystals. First, the solution enters into a scraped surface heat exchanger. Then, small crystals are used to form a suspension and these crystals grow in the ripening stage. Finally, ice crystals are separated through filtrating and washing columns.
This technique was first studied by Huige and Thijssen (1972). Production of ice crystals was studied and the freeze concentration technique was subsequently developed and patented. There has been extensive research on the nucleation mechanism (Shirai et al., 1987), washing columns (Quin et al, 2008), and the scraped heat exchanger (Habib and Farid, 2006).
Suspension freeze concentration is an efficient technique in terms of ice purity and increased concentration (Qin et al., 2007, 2006; van der Ham et al., 2004). This technique allows to concentrate coffee extract up to 32–35% solids and to obtain a high-purity effluent with 0.1% solids (Van Mil and Bouman, 1990; Van Pelt and Bassoli, 1990). However, this technique requires complex systems for ice separation and many moving parts, which increases the initial and operating costs (Aider and de Halleux, 2009b; Miyawaki et al., 2005; Sánchez et al., 2009). Recent developments have focused on minimizing moving parts, replacing the scrapped surface heat exchanger, and improving washing columns (Petzold and Aguilera, 2013; Sánchez et al., 2009; Van der Ham et al., 2004).
Techniques
Suspension
Film
Falling-Film
Progressive
Tubular
Vertical
Block
Partial
4
1.1.1. Film Freeze Concentration
Film freeze concentration consists in the formation of a single ice film on a cooling surface. Separation of the ice is easier than in the suspension technique as the film remains adhered to the surface. Ice growing and separation stages are carried out using the same equipment. Heat transfer is achieved across the ice layer. Two different options have been developed for film freeze concentration: falling-film freeze concentration and progressive freeze concentration.
Progressive Freeze Concentration
In progressive freeze concentration, an ice film is produced on a cooling surface while the fluid is moving on the growing ice layer (Miyawaki et al., 2005). Progressive freeze concentration can be performed in vertical or tubular equipment.
Tubular progressive freeze concentration was proposed by Shirai et al. (1998) and it consists of two concentric tubes that are connected. The solution to be concentrated and the refrigerant fluid circulate through the inner and the external tube, respectively. Ice is produced on the internal wall of the inner tube. The velocity of the fluid reduces solute occlusion on the ice layer. Relevant operational variables include initial concentration and type of solution, cooling temperature, and flow rate of the solution (Miyawaki et al., 2005; Shirai et al., 1998; Wakisaka et al., 2001).
On the other hand, the vertical system is composed by a cylindrical agitated tank equipped with a cooling jacket. Ice grows on the cooling wall. Agitation is applied to reduce solute occlusion. Operational variables in this technique are cooling rate, agitation rate, and type and initial concentration of the solution. (Liu et al., 1998)
Falling-Film Freeze Concentration
5
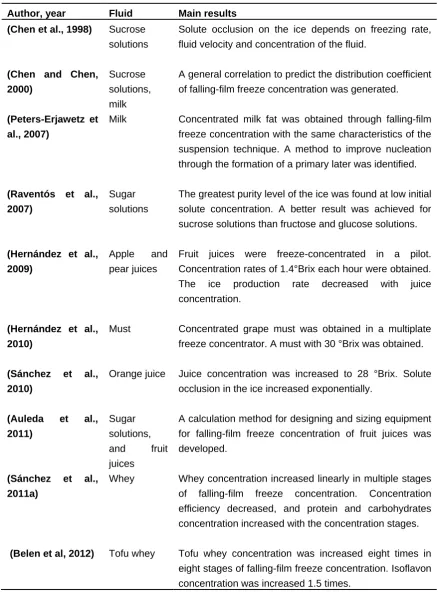
Table 1.1. Main researches on falling-film freeze concentration
Author, year Fluid Main results
(Chen et al., 1998) Sucrose
solutions
Solute occlusion on the ice depends on freezing rate, fluid velocity and concentration of the fluid.
(Chen and Chen, 2000)
Sucrose solutions, milk
A general correlation to predict the distribution coefficient of falling-film freeze concentration was generated.
(Peters-Erjawetz et al., 2007)
Milk Concentrated milk fat was obtained through falling-film freeze concentration with the same characteristics of the suspension technique. A method to improve nucleation through the formation of a primary later was identified.
(Raventós et al., 2007)
Sugar solutions
The greatest purity level of the ice was found at low initial solute concentration. A better result was achieved for sucrose solutions than fructose and glucose solutions.
(Hernández et al., 2009)
Apple and pear juices
Fruit juices were freeze-concentrated in a pilot. Concentration rates of 1.4°Brix each hour were obtained. The ice production rate decreased with juice concentration.
(Hernández et al., 2010)
Must Concentrated grape must was obtained in a multiplate freeze concentrator. A must with 30 °Brix was obtained.
(Sánchez et al.,
2010)
Orange juice Juice concentration was increased to 28 °Brix. Solute occlusion in the ice increased exponentially.
(Auleda et al.,
2011)
Sugar solutions, and fruit juices
A calculation method for designing and sizing equipment for falling-film freeze concentration of fruit juices was developed.
(Sánchez et al.,
2011a)
Whey Whey concentration increased linearly in multiple stages of falling-film freeze concentration. Concentration efficiency decreased, and protein and carbohydrates concentration increased with the concentration stages.
(Belen et al, 2012) Tofu whey Tofu whey concentration was increased eight times in
6
1.1.1. Block Freeze Concentration
The block freeze concentration method, also known as freeze-thaw concentration, can be performed through partial or total freezing. In the total block freeze concentration technique, the solution to be concentrated is completely frozen and then partially thawed to recover a fraction of liquid with a higher concentration (Aider & de Halleux, 2009; Nakagawa et al., 2010b). In the partial technique, ice grows partially and it is then separated from the remaining liquid. Block freeze concentration consists of three stages: freezing, thawing, and separation of the concentrated liquid fraction. These stages define separation efficiency (Nakagawa et al., 2009). Additionally, and the process can be repeated in successive cycles to increase the concentration index (Aider & Ounis, 2012).
[image:22.595.82.513.399.772.2]The advantage of this technique is that the fluid remains static, and consequently there is no need for complex equipment. In addition, the three stages can be performed in the same unit. However, it imposes research challenges associated to the ability to decrease solute occlusion and to achieve an industrial viable operation. The research on this technique has increased in recent years. Table 1.2 shows the main research on block freeze-concentration.
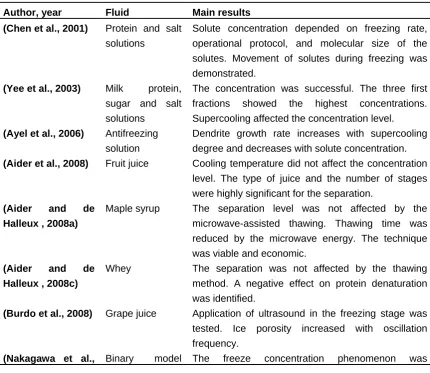
Table 1.2. Main researches on block freeze concentration
Author, year Fluid Main results
(Chen et al., 2001) Protein and salt
solutions
Solute concentration depended on freezing rate, operational protocol, and molecular size of the solutes. Movement of solutes during freezing was demonstrated.
(Yee et al., 2003) Milk protein,
sugar and salt solutions
The concentration was successful. The three first fractions showed the highest concentrations. Supercooling affected the concentration level.
(Ayel et al., 2006) Antifreezing
solution
Dendrite growth rate increases with supercooling degree and decreases with solute concentration.
(Aider et al., 2008) Fruit juice Cooling temperature did not affect the concentration
level. The type of juice and the number of stages were highly significant for the separation.
(Aider and de
Halleux , 2008a)
Maple syrup The separation level was not affected by the microwave-assisted thawing. Thawing time was reduced by the microwave energy. The technique was viable and economic.
(Aider and de
Halleux , 2008c)
Whey The separation was not affected by the thawing method. A negative effect on protein denaturation was identified.
(Burdo et al., 2008) Grape juice Application of ultrasound in the freezing stage was
tested. Ice porosity increased with oscillation frequency.
7
2009) solutions governed by the water drop thawing rate during the
thawing stage.
(Aider et al., 2009) Acidified milk
whey
A highly concentrated liquid was obtained. However, the level of solute occlusion was high. Foam capacity decreased and foam stability of the whey increased with freeze concentration.
(Gao et al., 2009) Waste water The partial block technique was tested. A good level
of impurity removal was achieved. Separation was increased by applying agitation. Freezing temperature did not have any effect on separation.
(Nakagawa et al., 2010a)
Apple juice The level of concentration was affected by the thawing temperature. Separation efficiency is determined by solute elution in the thawing stage. Solute concentration increased with time and low thawing temperatures.
(Nakagawa et al., 2010b)
Ternary model solutions
The separation was controlled by the thawing stage.
(Aider and Ounis, 2012)
Milk whey Successive stages were proposed for the block technique. The thawing method did not affect separation but decreased processing time.
(Petzold et al.,
2013)
Sucrose solution Separation efficiency was increased by vacuum separation of the liquid fraction. Processing time was also reduced through this technique.
(Petzold and
Aguilera, 2013)
Sucrose solution A centrifugal force is proposed to separate the concentrated fraction from the ice matrix. Solute recovery was increased through this technique.
The state of the art of freeze concentration was supplemented by five papers published as a result of the research herein. These publications will be presented in the following chapters.
8
1.2. Research question
Freeze concentration is a technology used to eliminate water from aqueous solutions, preserving quality through low processing temperatures. This technology is used in the food, pharmaceutical, and biotechnological industries. Freeze concentration is used in the process to obtain freeze-dried coffee. The most implemented technique is suspension freeze concentration, which is effective for separation; however, this technique requires systems of ice separation and many moving parts, which increases initial and operating costs. For this reason, other freeze concentration techniques have been studied. Different techniques, such as falling-film, and block freeze-concentration are being developed seeking to reduce operational costs. The operational conditions of these new techniques have not been defined, hindering their industrial implementation. The use of these techniques in coffee extraction through concentration has not been tested yet.
A key problem for researchers is to establish the relationship between the operational variables and the phenomena required to reduce solute occlusion and to increase separation efficiency of block and falling-film freeze concentration. In addition, the functional quality and sensory quality of the product are highly important in the coffee industry. For this reason, the effect of freeze concentration on the organoleptic quality and functional quality of coffee extract should be studied. From this context, the following research questions can be formulated:
9
1.2. Objectives
1.2.1. General Objective
The main objective of the present study was to establish the effect of the operational variables of block and falling-film freeze concentration on separation efficiency and quality of coffee extract.
1.2.1.1. Specific Objectives
1. Design and implement an equipment to study block and falling-film freeze concentration.
2. Determine the effect of operational variables of freeze concentration on separation efficiency.
3. Assess the effect of freeze concentration on volatile and bioactive compounds of coffee extract.
10
1.3. Structure of the document
The present thesis document is organized in ten chapters.
The first chapter offers a brief presentation of the state of the art, the research question, and the objectives of the study. The second chapter presents the design of a test unit for studying block and falling-film freeze concentration.
Chapter three presents the characterization of the main physical properties of coffee extract at temperatures close to freezing. The relations between coffee mass fraction and Brix degrees, freezing curve, rheological behaviour, and density of coffee solutions at temperatures close to the freezing point were measured and modelled mathematically.
Chapter four focuses on the study of the effect of the operational variables of block and falling-film freeze concentration on separation efficiency. This chapter presents the evaluation of the effect of the initial coffee mass fraction, the cooling temperature, the heating temperature, and the freezing direction on the solute yield and concentration index of block freeze-concentrated coffee extracts. In addition, it discusses the impact of the technique on the bioactive compound concentration and antioxidant activity of the coffee extract.
The effect of different separation and thawing methods in block freeze-concentration is provided in chapter five. The effect of gravitational and vacuum assisted separation, thawing temperature, and thawing method on solute yield is also studied.
The effect of the operational variables on solute occlusion in falling-film freeze concentration is studied in chapter six. The aim of this chapter is to evaluate the behaviour of coffee extract during falling-film freeze concentration at different coffee mass fractions, ice growth rates, and film velocities on the plate, and to obtain the parameters for average distribution coefficient modelling.
A comparative of solute retention, productivity, ice morphology, volatile compounds preservation and sensory quality between block and falling-film freeze concentration of coffee extract is presented in chapter seven.
Chapter eight proposes a process for integrating block and falling-film freeze concentration seeking to increase separation efficiency. The process presented in chapter eight includes recovery of coffee solids by fractionated thawing and block freeze-concentration techniques.
11
This document of doctoral thesis, the published papers derived from this work, and its relationship with the objectives of the thesis are presented according to the structure shown in Fig 1.3.
2. Design of an equipment for the study
of block and falling-film freeze concentration
3. Rheological behaviour, freezing curve and density of
coffee solutions at temperatures close to
freezing
4. Block freeze-concentration: effect of
freezing and thawing stages on solute recovery and bioactive
compounds of coffee extract
5. Effect of separation and thawing mode on
block freeze-concentration of coffee
brews
6. Behaviour of falling-film freeze concentration of coffee
extract
7. Volatile compounds preservation and solutes retention of block and falling-film freeze concentration of
coffee extract
8. A process to concentrate coffee
extract by the integration of falling film
and block freeze
concentration General Objective
3. Assess the effect of freeze concentration on
volatile and bioactive compounds of coffee
extract.
4. Propose operative strategies to integrate block
and falling-film freeze concentration of coffee extract in order to increase
solute recovery. 2. Determine the effect of
operational variables of freeze concentration on separation efficiency. 1. Design and implement an equipment to study block and
falling-film freeze concentration.
Journal of food Engineering (2014)
120, 158-166 International journal
of food properties. (2014). Doi: 10.108010942912.2 013.833221 Food and Bioproducts Processing (2013), 91(4), 396-402
Journal of Food Engineering (2014)
141, 20-26
Journal of Food Engineering (2014),
128, 88-95.
CHAPTER OBJECTIVE
[image:27.595.90.507.128.730.2]PUBLICATION
12
1.4. Published papers
The following research papers were published as a result of the present work:
1. Moreno F.L., Raventós M., Hernández E., Santamaría N., Acosta J., Pirachican O., Torres L. and Ruiz Y. (2014) Rheological behaviour, freezing curve and density of coffee solutions at temperatures close to freezing. International Journal of Food Properties. DOI: 10.1080/10942912.2013.833221
2. Moreno, F.L., Raventós, M., Hernández, E., & Ruiz, Y. (2014). Block freeze-concentration of coffee extract: effect of freezing and thawing stages on solute recovery and bioactive compounds. Journal of Food Engineering, 120, 158-166
3. Moreno, F.L., Robles, C. M., Sarmiento, Z., Ruiz, Y., & Pardo, J. M. (2013). Effect of separation and thawing mode on block freeze-concentration of coffee brews. Food and Bioproducts Processing, 91(4), 396-402
4. Moreno, F.L., Raventós, M., Hernández, E., Ruiz, Y. (2014). Behaviour of falling-film freeze concentration of coffee extract. Journal of Food Engineering 141, 20-26.
5. Moreno, F.L., Hernández, E., Raventós, M., Robles, C., & Ruiz, Y. (2014). A process to concentrate coffee extract by the integration of falling film and block freeze-concentration. Journal of Food Engineering, 128, 88-95.
In addition, the following works were presented in scientific congresses:
1. Moreno, F.L., Hernández, E., Raventós, M., Robles, C., & Ruiz, Y. (2012). Mathematical modelling of rheological behaviour of coffee extract at temperatures close to freezing. In: Congreso Español de Ingeniería de Alimentos CESIA VII. Ciudad Real, España.
2. Ramírez, A. Moreno, F.L. Ruiz, Y. Block freeze concentration of coffee extract. (2012). Revista Vitae 19, (1). In: I Congreso Internacional de investigación e innovación en ciencia y tecnología de alimentos IICTA. Bogotá, Colombia.
3. Moreno, F. L., Raventós, M., Hernández E., Gulfo R., Ruiz, Y. (2014) Technical, energetic and economic comparative of three concentration systems in a fruit juice industry: Case of study. In: Congreso Iberoamericano de Ingeniería de Alimentos CIBIA 9. Valencia, España.
4. Moreno, F. L., Raventós, M., Hernández E., Gulfo R., Robles, C., Ruiz, Y. (2014) Integration of block and falling-film freeze concentration applied to concentrate sucrose solutions. In: Congreso Iberoamericano de Ingeniería de Alimentos CIBIA 9. Valencia, España.
13
2. DESIGN OF AN EQUIPMENT FOR THE STUDY OF BLOCK AND FALLING-FILM FREEZE CONCENTRATION
A unit for the study of block and falling-film freeze concentration was designed in order to develop the present research. The main results of the design process are presented in this chapter.
2.1. Systems of the Test Unit
The unit for the study of freeze concentration must control the main operational variables of freeze concentration required to develop the tests. Firstly, the unit should provide cooling and heating fluids with the possibility of temperature and freezing direction controlling. Secondly, the temperature and concentration of the solution should be measured during the tests. In addition, the equipment should be able to couple a block or a falling-film freeze concentration device. For these reasons, the freeze concentration unit is composed by the systems shown in Table 2.1.
Table 2.1 Systems of the concentration unit.
SYSTEM DESCRIPTION
Cooling system Thermostatic bath to provide a cooling fluid (ethylene glycol-water 50%
m/m). The fluid is pumped to the freeze concentration device.
Heating system
In block freeze concentration a thawing stage is needed. For this reason a thermostatic bath to provide a heating fluid (ethylene glycol-water 50% m/m) was used. The fluid is pumped to the block freeze-concentration device during the thawing stage.
Block freeze-concentration
device
The block freeze-concentration device is a cylindrical container. The container consists in a double jacket device for the circulation of cooling and heating fluids. The device has thermal insulation and exit valves to collect the thawing fraction.
Falling-film freeze concentration
device
The falling-film freeze concentration device is a chamber with an internal cooling plate to freeze the solution. The cooling fluid circulates inside the plate. The fluid flows through a descending film over the cooling plate, and it is collected in a tank and re-circulated by peristaltic pump. Ice grows on the surface of the plate.
Valves and connexions
It consists in a system of flexible hosepipe that conducts cooling and heating fluids to the block device and the plate of the falling-film chamber. A set of valves is provided to control freezing and thawing direction according to experimental requirements.
Support structure
14
2.2. Structure of the Freeze Concentration Unit
The structure of the equipment is represented by the piping and instrumentation diagram (P&ID) shown in Fig 2.2 and 2.3. Freezing devices, connexions, valves, sensors, and control systems are also shown in these figures. The P&ID of the block freeze concentrator is shown in Fig 2.2.The P&ID of the falling-film freeze concentrator is shown in Fig 2.3.
Figure 2.1. Piping and instrumentation diagram of block freeze concentrator.
PUMP-101 INT-102
V-301
V-303 V-302
V-201 V-204
V-203 TC
V-205 V-202
[image:30.595.126.498.221.459.2]PUMP 301
15
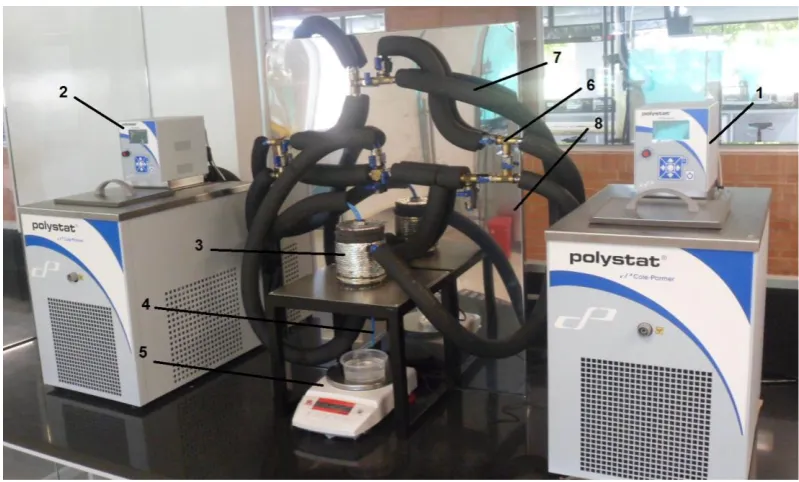
Fig. 2.3 shows the overall setup of the freeze concentration unit. It includes the cooling system, the heating system, the block freeze-concentration device, the falling-film freeze concentration device, valves, and connexions.
a)
b)
Figure 2.3. Overall setup of the freeze concentration unit.
a) Block freeze concentrator. b) Falling-film freeze concentrator.
The mechanical drawings of the equipment were generated using the Autodesk-Inventor software. A sample of the planes shows the isometric projection, the overall scheme and the exploded view are shown in Figures 2.4 and 2.5.
[image:31.595.194.389.562.732.2]16
Figure 2.5. Mechanical planes of freeze concentrator.
a) Explosion drawing of block freeze concentrator; b) Explosion drawing of falling-film chamber
2.3. Design Parameters and Operational Intervals.
The following design parameters were established according to the identified functions:
- Heating and cooling system: Thermostatic baths CP12122-58 (Cole Parmer, USA);
temperature interval: -35°C to 150°C +/- 0.01°C; dimensions: W 14.6" H 27.8" L 20.8"; temperature sensor stability: ±0.025°C; cooling power: 800W; pumping head at zero pressure 10.8 psi (750mbar); heating power: 2 kW; maximum flow rate: 21 L/min.
- Block freeze concentrator: Cylindrical container made of stainless steel 304, with
double jacket for the circulation of refrigerant fluids. It has a capacity of 160 mL, 52.5 mm in diameter, and 85 mm in height. Insulation is provided at the bottom, the top, and the external side of the container to ensure unidirectional freezing. Two valves are located at the bottom, near the internal and external walls, to separate the A digital scale PA3102 (Ohaus, USA) of 3100 g * 0.01 g is concentrated liquid fraction.
located behind the valves to collect and weight the samples.
- Falling film freeze concentrator: Chamber made of stainless steel 304. A
rectangular cooling plate can be located inside the chamber. A dispersion tube is located in front of the plate to disperse the solution to be concentrated. A storage tank is located at the bottom of the chamber. The plate has dimensions of 25-cm width and 20-cm height. Cooling fluid from the cooling bath flows inside the plate.
17
polyethylene flexible hosepipe is used to conduct cooling and heating fluids. A set of 12 ball valves, 8 mm in diameter, is provided to control freezing and thawing direction.
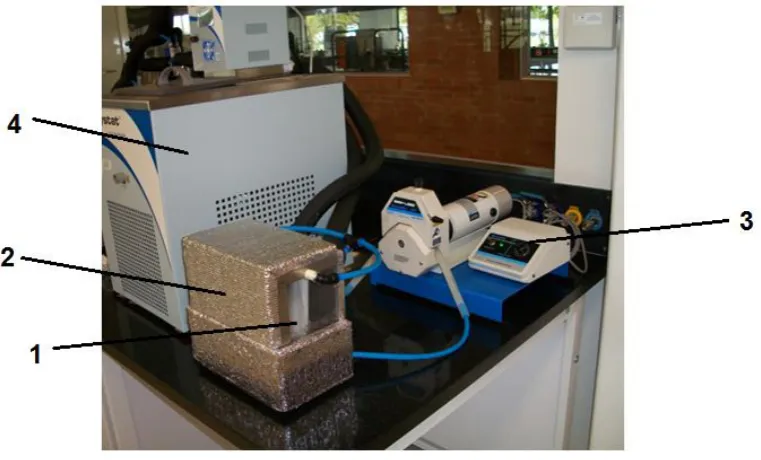
Figure 2.6. Block freeze concentrator.
[image:33.595.97.497.113.354.2]1) Heating thermostatic bath; 2) Cooling thermostatic bath; 3) Block freeze concentrator container; 4) Thawed sample collecting system; 5) Scale; 6) Valves to control freezing and cooling direction; 7) Hosepipe for heat transfer fluid flow.; 8) Support structure.
18
Figure 2.8. Falling film freeze concentrator.
[image:34.595.109.490.71.301.2]1) Freezing chamber; 2) Cooling plate; 3) Peristaltic pump; 4) Thermostatic bath.
19
3. RHEOLOGICAL BEHAVIOUR, FREEZING CURVE, AND DENSITY OF COFFEE SOLUTIONS AT TEMPERATURES CLOSE TO FREEZING
3.1. Abstract
The physical properties of coffee solutions were determined for temperatures close to the freezing point. Rheological behaviour, freezing curve, density and their relationship between coffee mass fraction and brix degrees were determined for coffee mass fractions between 5 and 50% (wet basis) in the -6°C to 20°C temperature interval. Values of viscosity varied from 1.99 to 1037 mPa·s and values of density from 1000 to 1236 kg·m-3. The freezing curve was generated using the undercooling method, giving values within freezing curves for food fluids. The results were used to generate mathematical models to predict viscosity, freezing point depression, and density as a function of coffee mass fraction and temperature.
Keywords: Coffee; Properties; Rheology; Freezing; Modelling; Freeze-Concentration Nomenclature
°Brix Brix degrees
a, b, c, d parameters of Eq. 3 and Eq. 4
a
1, a
2, b
1, b
2, c
1 parameters of Eq. 5a
3, a
4, a
5, a
6a
7 parameters of Eq. 7Ea Activation energy (kJ•mol-1) FPD Freezing point depression γ Shear rate (s-1)
K Consistency coefficient (Pa•sn) k0 Frequency factor (mPa•s) n Flow behaviour index nD Refractive index
R \ Universal gas constant (8.314 kJ•mol-1•K-1) R2 Coefficient of determination
T Temperature (°C)
Xs Coffee mass fraction (g coffee/ g solution)
ρ Density
ρc Density of coffee solids ρw Density of water
σ Shear stress (Pa) Φ Temperature correction ω Rotational speed (rpm)
𝜼 Viscosity (mPa•s)
20
3.2. Introduction
Coffee is the second traded commodity in the world after petroleum and one of the most consumed food beverage worldwide (Cheong et al., 2013; Esquivel y Jiménez, 2012). In the coffee industry, preservation of quality is highly important; for this reason, low temperature technologies are commonly implemented. Technologies such as freeze-concentration and freeze-drying are used to produce soluble coffee thanks to the flavour preservation promoted for the low temperatures using (McLeod et al., 2016; Miyawaki et al., 2005; Sánchez et al., 2009).
The measurement of physical properties of food fluids at low temperatures is relevant in the designing of processes and equipment for freezing technologies. The freezing curve of food fluids represents the state of food as a function of solid concentration and temperature. The state diagram is useful for process conditions selection in freezing technologies (Rahman, 2006). Flux behaviour comprehension at temperatures just above the freezing point of fluids is required for sizing freeze-concentration equipment, such as falling film or tubular systems. In a similar way, determining of the viscosity and density is important to establish the power requirements for pumping during fluid processing (Chin et al., 2009). Determining of mathematical models for physical properties and rheological behaviour at low temperatures and at different mass fractions allows applying calculation methods for designing and sizing equipment for freeze concentration (Auleda et al., 2011).
The coffee mass fraction or solid content can be measured by gravimetric techniques; however, Brix degrees determination can be a faster technique. There is no coincidence between Brix degrees and solid content because the darker colour of coffee solutions and the minimum fraction of sediments of coffee extract can affect the diffraction of light. A relationship between Brix degree and coffee mass fraction has not been described.
21
concentration, freeze drying, and coffee extract handling in the coffee industry. The aim of the present work was to measure and model the relation of coffee mass fraction and Brix degrees, freezing curve, rheological behaviour, and density of coffee solutions at temperatures close to the freezing point.
3.3. Materials and methods
Materials
Colombian freeze-dried coffee (Buencafé, Buencafé Liofilizado de Colombia) provided by the Colombian Coffee Growers Federation was used to prepare aqueous solutions at different coffee mass fraction. Soluble coffee granules were dissolved in distilled water at 30°C to obtain samples at different concentrations.
Relationship between Coffee Mass Fraction and Brix Degrees
Coffee solutions were prepared at different coffee mass fraction: Xs= 0.10, 0.20, 0.30, 0.40, and 0.50. The solutions were stored at 20°C. Brix degrees and index refraction were measured by refractometry (Atago Pal 100, Japan) at 20°C ±1°C. The total dry matter was measured by weight-loss after oven drying at 103 °C +/- 1°C for four hours according to technical standards (Icontec, 2009). Measurements were performed in quadruplicate.
Freezing Curve
The method of undercooling reported by (Auleda et al, 2011; Ayel et al., 2005; Jie et al., 2003) was used to determine the freezing point of coffee solutions. Coffee solutions at Xs= 0.10, 0.20, 0.30, 0.40 and 0.50 were tested. The method consisted of cooling the sample by immersion in a cooling bath. Four test tubes with 10 mL of the sample were immersed in a cooling bath (Polystat, Cole Parmer, USA). The cooling fluid was a mixture of ethylene glycol and water (53% w/w). The bath was temperature controlled at an interval from -35 °C to 150 °C +/- 0.01 °C. The temperature of the bath was settled at -13°C +/- 0.01 °C. The test tubes were immersed after the bath reached the temperature. The test tubes contained inside a PT100-IP65 temperature sensor (Testo, Germany) located in the centre of the sample. The sensor had a 2 mm diameter and a precision of ±0.01 °C, and it was connected to a 176 T2 datalogger (Testo, Germany). The temperature profile was stored in a PC. The freezing points were determined based on the cooling curves. The highest temperature reached after the undercooling due to nucleation corresponded to the freezing point. All the experiments were performed in quadruplicate.
22
solutions were stored and then freezing points were determined. The technique was accepted when the difference between experimental and theoretical data was within 5%. This difference may be attributed to the solute inclusion in ice (Chen and Chen, 1996).
Rheological Measurements
Coffee solutions were prepared at Xs= 0.05, 0.20, 0.35 and 0.50. The solid content was verified by refractometry (Atago Pal 100, Japan) at 20°C+/-0.05°C using the equation obtained in the Brix degrees and coffee mass fraction measurements. The rheological behaviour of the samples was determined using a viscometer of coaxial cylinders (FungiLab Viscostar L, Barcelona) equipped with a device for low viscosity measurements, which is able to measure viscosities from 0 to 2000 mPa•s. The sample of 18 mL of coffee solution was placed on the device with a concentric inside spindle. The device was immersed in a cryostat (Polysience Model 9505, USA, temperature range: -30 to 150°C; temperature stability 0.5°C; readout accuracy: +/-0.5°C). The viscometer was connected to a PC for data storing. The sample temperature was verified using a thermocouple type K (Precision +/-0.5°C; measurement range: -50 to 1000°C) connected to a Datalogger (Testo 174 T4, Spain). Viscosity was measured after the sample reached the desired temperature.
The measurements were performed varying shear rate, sample temperature, and coffee mass fraction. Four shear rates were adjusted for each sample, from 5 to 120 s-1, depending on the solution’s viscosity. The limit was established by the maximum torque of the viscometer. Shear rates were calculated using an equation given by the viscometer to convert rotational speed into shear rate, ɣ=1.2236*ω. Different temperatures above freezing point were tested (-6, -4, -2, 0, 2, and 4°C) depending on Xs, such that the solution remained in liquid state. Four different coffee mass fractions (0.05, 0.20, 0.35, and 0.50) were tested. Experiments were performed in triplicate. The rheological behaviour of coffee solutions was modelled using the power law shown in Eq. 1.
(1)
An Arrhenius type equation (Eq. 2) was used to describe the effect of temperature on the viscosity of coffee solutions (Ibarz et al., 2009).
(
)
(2)
Activation energy and frequency factor were fitted to the Xs dependent model (Ibarz et al., 1992) shown in Eq. 3 and Eq. 4.
(3)
(4)
23
cited by Longinotti and Corti, 2008) proposed a general model for sucrose solutions shown in Eq. 5.
( ) (5) Where:
φ=(30-T)/(91+T) (6)
Moreover, Sobolik et al. (2002) proposed a model applied to coffee solutions at room temperatures and higher, shown in Eq. 7.
(
) (7)
Density
The density of coffee solutions at Xs= 0.10, 0.20, 0.30, 0.40, and 0.50 was determined by using a pycnometer at temperatures of 0, 5, 10, 15, 20 and 25 °C ± 0.01°C. The pycnometers with the samples were immersed in a cooling bath at the settled temperature (Polystat Cole Parmer, USA). One blank sample had a PT100-IP65 temperature sensor (Testo, Germany) immersed to check temperature. After the sample reached the temperature, the pycnometers were closed and weighed in an analytical scale (Mettler Toledo, USA). The measures were performed in triplicate.
Statistical Analysis
The average and the standard deviation of all data were calculated by SPSS 20.0 software. The unknown parameters of the models showed in Eq. 1 to 10 were adjusted from experimental results using a linear regression fitting procedure with SPSS 20.0 for Eq. 2 to 4 and a non-linear regression procedure for the other intrinsically non-linear models. The goodness of model fit was based on coefficient of determination (R2), defined by the ratio between the regression sum of square and the total sum of squares. For the best fit, the R2 value should be high.
3.4. Results and discussion
Relationship between Coffee Mass Fraction and Brix Degrees
24 Xs= 0.0087·°Brix (8); R2=0.991
[image:40.595.205.386.160.491.2]nD = 1.334 +0.155Xs + 0.092Xs2 (9); R2=0.984
Table 3.1 Xs and refractive index as a function of brix degrees for coffee solutions
Brix degrees
Xs Refractive index
11.3 0.094 1.3500
10.7 0.095 1.3488
11.4 0.103 1.3499
11.4 0.100 1.3499
22.8 0.183 1.3685
23.0 0.204 1.3661
21.3 0.191 1.3674
22.0 0.154 1.3680
33.2 0.305 1.3870
33.7 0.308 1.3890
34.3 0.297 1.3864
32.9 0.303 1.3870
41.3 0.381 1.4024
45.3 0.396 1.4087
44.5 0.393 1.4112
45.7 0.396 1.4080
55.4 0.494 1.4317
56.2 0.496 1.4428
60.3 0.493 1.4241
51.9 0.459 1.4290
Freezing Curve
The cooling curves of coffee solutions were determined in quadruplicate as shown in Fig. 3.1. The super-cooling can be observed by the temperature decrease until the nucleation process begins. Subsequently, a temperature increase was produced due to the latent heat of the phase change. The highest temperature reached corresponded to the freezing point of the sample (Auleda et al., 2011). From the cooling curves at different Xs, an average freezing point was calculated and the freezing curve for coffee solutions was obtained (Table 3.2.). Data correspond to average and standard deviation. The values are comparable to those reported by Thijsenn (1969) and Thaler (1978) for different types of coffee. The difference with the freezing point of water (0°C) corresponded to the freezing point depression. Data were fitted to Eq. 10 for freezing point depression prediction as a function of coffee mass fraction. The regression coefficient obtained was 0.998, showing a good fitness.
25
Figure 3.1
Cooling curves of coffee solutions. Xs=0.40
Table 3.2.
Freezing point of coffee solutions as a function of coffee mass
fraction
Xs Freezing point (°C)
0.1 -0.76 ± 0.04 0.2 -1.92 ± 0.08 0.3 -3.45 ± 0.06 0.4 -6.54 ± 0.19 0.5 -9.79 ± 0.24
The freezing curve of coffee is between the freezing curves of glucose and sucrose, within the typical region of food fluids proposed by Auleda et al. (2011). This can be attributed to the polysaccharides content of coffee extract, which varies from 20 to 75% dry basis (Thaler, 1978; Franca et al., 2005; De Maria et al., 2006), depending on coffee variety, roasting and extracting processes.
Rheological Measurements
Rheological Behaviour
The rheograms of coffee solutions at Xs 5, 20, 35, and 50% and temperatures between -6 and 4°C are presented in Fig. 3.2, where shear stress (σ) as a function of shear rate (γ) is plotted. The dots correspond to experimental data and the lines were generated from parameters of Eq. 1, shown in Table 3.3. For this regression, coefficients of determination between 0.95 and 1.00 were obtained, suggesting good fitness of the models. A Newtonian behaviour was obtained with a flow index close to 1. Exponents of power law were less than 1 for high Xs and low temperatures, showing a slightly pseudoplastic behaviour. However, this result is not significant according to standard deviation.
-20 -15 -10 -5 0 5 10 15 20 25 30
0 200 400 600 800
Tem
perature
(°
C)
time (s)
Freezing point Super
coolin
26
Figure 3.2. Rheogram of coffee solutions
4°C (
□
), 2°C (∆), 0°C(◊), -2°C (○
), -4°C(x) and -6°C(─). (a) Xs=0.05, (b) Xs= 0.20, (c)Xs=0.35 y (d) Xs=0.50. Lines are calculated values using parameters given in Table 3.3.
The Newtonian behaviour was reported by Sobolik et al. (2002) for concentrated coffee solutions at higher temperatures in the interval from 0 to 1574 s-1. Moreover, the consistency coefficient of Eq. 1 was increased with Xs and decreased with temperature, as is indicated by several researchers (Chine et al.,2009; Magerramov et al.,2007). Assuming a Newtonian behaviour, the values of viscosity of coffee solutions at the tested shear rates are presented in Table 3.4. As expected, the viscosity increased with increasing Xs and decreasing temperature. It was observed that influence of Xs on viscosity is greater than influence of temperature. These results are
b a 0 0.05 0.1 0.15 0.2 0.25 0.3
0 50 100 150
σ
(Pa)
γ (s-1)
d c 0 0.1 0.2 0.3 0.4 0.5 0.6 0.7
0 5 10 15 20
σ
(Pa)
γ (s-1)
0 5 10 15 20 25 30 35 40 45
0 20 40 60 80
σ
(Pa)
γ (s-1)
0 0.1 0.2 0.3 0.4 0.5 0.6 0.7
0 20 40 60 80
σ
(Pa)