Effects of a low-fat diet on the hepatic expression
of adiponectin and its receptors in rats with NAFLD
Hong Ma,*,§ Guo-Ping You,§,|| Fan Cui,* Lu-Fang Chen,*,§ Xiang-Jiu Yang,* Li-Gang Chen,† Hua-Dong Lu,‡ Wen-Qiang Zhang*
Departments of * Endocrinology, † Gastroenterology and ‡ Pathology, Zhongshan Hospital Xiamen University, Fujian, China. § Department of Endocrinology, Xiamen Zhongshan Teaching Hospital of Fujian Medical University, Fujian, China.
|| Department of Emergency, Fujian Provincial Hospital, Fujian Medical University, China.
ABSTRACT
Background. Non-alcoholic fatty liver disease (NAFLD) is correlated with obesity, but specific therapeutic interventions are lacking. Adiponectin is an adipokine with anti-inflammatory activity and is considered a hepatic protector. We aimed to investigate effects of a low-fat diet on the hepatic expression of
adi-ponectin and its receptors in rats with NAFLD. Materials and methods. Sixteen male SD rats were fed a
high-fat diet for 8 weeks (HFD1 group) or 16 weeks (HFD2 group) to induce NAFLD, and these rats were compared with rats on a normal diet for 8 weeks (NC1 group) or 16 weeks (NC2 group). Another group of 8 rats was fed an HFD for 8 weeks and then switched to a low-fat diet (DIET group) until the 16th week. The expression of hepatic adiponectin and its receptors was detected by western blotting,
immunohistochem-istry and RT-qPCR. Results. The NAFLD activity score (NAS) in the HFD groups increased from 3.2 ± 0.45 (8th
week) to 6.2 ± 0.84 (16th week) (P < 0.001), reflecting the progression in the NAFLD histology. In contrast to the HFD2 group, the low-fat diet ameliorated the steatosis, ballooning degeneration and inflammation. Dietary intervention augmented the expression of adiponectin and its receptors, which was
down-regulat-ed in the HFD2 group. Conclusions. The NAFLD rat model was successfully developed by feeding the
ani-mals a high-fat diet. Adiponectin may play a role in the pathogenesis of NAFLD, especially in the progression from steatosis to NASH. The low-fat diet alleviated the histological lesions associated with NAFLD by up-regulating the expression of adiponectin and its receptors.
Key words. Dietary intervention. Adipokine. Fatty liver. Pathology. Pathogenesis.
Correspondence and reprint request: Associate Professor Hong Ma, M.D., Ph.D.
Department of Endocrinology, Zhongshan Hospital Xiamen University, Xiamen Zhongshan Teaching Hospital of Fujian Medical University, Xiamen, 361004, Fujian, China.
Tel.: +86-592-2590251. Fax: +86-592-2212328 E-mail: mah-169@163.com
Manuscript received: June 14, 2014. Manuscript accepted: August 14, 2014. INTRODUCTION
Nonalcoholic fatty liver disease (NAFLD) is the most common cause of chronic liver disease, and NAFLD occurs in 10-24% of the general popula-tion.1,2 Nonalcoholic steatohepatitis (NASH) refers
to a stage within the spectrum of NAFLD that is characterized by hepatic steatosis, inflammation
(which can progress to cirrhosis), liver dysfunction, and even hepatocellular carcinoma.3,4
NAFLD treatment is currently based on lifestyle intervention (diet and exercise). Insulin resistance (IR) and obesity-related inflammation are two of the possible dietary- and lifestyle-related factors that are considered to play a dominant role in the pathogene-sis of this disease.5 NAFLD represents the hepatic
component of metabolic syndrome, for which life-style modifications are definitely effective and possi-bly more useful than pharmacologic interventions at avoiding progression.6 An important aspect of
life-style is diet. A cornerstone of the management strat-egy in such patients is initiating a diet to decrease body weight and to improve glycemic control, dyslip-idemia and cardiovascular risk as well as to treat the fatty liver.7 Despite the fact that dietary change
NAFLD, no specific guidelines exist pertaining to diet. There is no consensus as to what dietary ap-proach is appropriate for NAFLD, largely because scientific evidence is lacking. Some reviews have summarized the recent findings from human studies on the dietary effects on NAFLD. The number of randomized intervention studies examining the rela-tionships between NAFLD and dietary macronutri-ent composition is limited. Both of the randomized studies advised patients with NAFLD to reduce their caloric intake with either a low-fat or a low-carbo-hydrate diet and to limit their intake of fructose, trans-fatty acids and saturated fat.8-10 Nevertheless,
the above tests focused on clinical patient research, and the long-term low-fat or low-carbohydrate diets were limited by patient compliance. Due to their in-vasive nature, liver biopsies are used sparingly to assess treatment efficacy.
Adiponectin is the most abundant adipose-specific hormone. It has anti-inflammatory, anti-diabetic and anti-atherogenic properties.11 Its expression and
plasma concentration are inversely related to IR and metabolic syndrome12,13, including T2DM14 and
obes-ity.15 Adiponectin functions via its specific
recep-tors, adipoR1 and adipoR2. AdipoR1/adipoR2 are ubiquitously expressed in many tissues. In mice, ad-ipoR1 is most abundantly expressed in skeletal mus-cle, whereas adipoR2 is most abundantly expressed in the liver.16 The activation of adipoR1 and adipoR2
can increase hepatic and skeletal muscle fatty acid oxidation and cellular glucose uptake and inhibit in-flammation and oxidative stress.17,18 Therefore,
adi-ponectin and its receptors are inversely related to the degree of IR and obesity and have been identified as potential therapeutic targets for the treatment of NAFLD.
Several recent studies have demonstrated that low-calorie dietary intervention elicits weight loss and up-regulates serum adiponectin levels.19,20 There
have been various studies on the relationship between adiponectin receptors and NAFLD, and these studies demonstrated that adiponectin recep-tors may be involved in the progression of NAFLD.21,22 However, whether dietary intervention
has a favorable effect on hepatic pathology and affects adiponectin and its receptors in the liver remains unknown.
Therefore, we used a high-fat diet (HFD) to cre-ate an NAFLD rat model and then studied the ef-fects of a low-fat diet intervention. We analyzed biochemical assays, hepatic pathology and the ex-pression of adiponectin and its receptors in the liv-er. We aimed to further understand the therapeutic
effect and the mechanism of action of a low-fat diet intervention on NAFLD.
MATERIAL AND METHODS
Experimental model and drug treatment
Forty male SD rats (6 weeks old, 190-210 g) sup-plied by Hayes Lake experimental animals company (Shanghai, China) were acclimatized in communal cages at 22 °C with a 12 h light, 12 h dark cycle for 1 week with a normal diet. The rats were then randomly divided into two groups that were fed a normal con-trol diet (16 rats) or an HFD (24 rats) (10% lard, 20% sucrose, 2% cholesterol, 0.3% cholate, and 67.7% con-ventional feed by mass). Their body weight and food intake were measured weekly. Sixteen male SD rats were fed an HFD for 8 weeks (HFD1 group) or 16 weeks (HFD2 group) to induce NAFLD and were com-pared with 16 rats on a normal diet for 8 weeks (NC1 group, 8 rats) or 16 weeks (NC2 group, 8 rats). Anoth-er group of 8 rats was fed an HFD for 8 weeks and then switched to a low-fat diet (4% crude fat, DIET group) until sacrifice at the end of the 16th week. The body weights of the rats were measured after anesthe-sia with diethyl ether. Blood samples were collected via the heart and were centrifuged at 3,000 g for 10 min; the plasma was collected and stored at -80 °C un-til analysis. Liver tissues were quickly excised, washed with ice-cold PBS, and weighed. A small portion of each liver specimen was cut and fixed in formalin solu-tion. The remaining liver tissue samples were rapidly frozen in liquid nitrogen and then stored at -80 °C for subsequent molecular assays. All of the experiments were approved by the Laboratory Animal Care and Use Committee of Xiamen University.
Biochemical assays
assessment of insulin resistance (HOMA-IR) was calculated based on the formula:
Where FPG is fasting plasma glucose and FINS is fasting insulin.
Liver histopathology
The liver tissues in formalin solution were fixed overnight in 10% buffered formalin and embedded in paraffin. Sections (5 μm) of liver tissue were stained with hematoxylin and eosin (HE) for microscopic ex-amination of hepatic structures and to ascertain the presence of lipid droplets. Two experienced patholo-gists blinded to the experimental data scored the liv-er specimens according to guidelines for the management of NAFLD.23 The NAFLD activity
score (NAS) includes the following:
• Steatosis was scored from 0 to 3 based on a four-grade scoring system from S0 to S3, where S0 in-dicates no to less than 5% steatosis, S1 inin-dicates 5-33% steatosis, S2 indicates 33-66% steatosis, and S3 indicates >66% steatosis.
• Lobular inflammation was graded as:
° Stage 0: no foci.
° Stage 1: < 2 foci per 200 x field. ° Stage 2: 2-4 foci per 200 x field. ° Stage 3: > 4 foci per 200 x field.
• Ballooning degeneration of liver cells was evalu-ated as:
° Grade 0: absent. ° Grade 1: a few cells. ° Grade 2: many cells.
The histological NAS score was defined as the un-weighted sum of the scores for steatosis (0-3), lobu-lar inflammation (0-3), and ballooning degeneration (0-2); therefore, the scores ranged from 0 to 8. The diagnostic criteria for simple steatosis, borderline NASH, and NASH were scores of 0-2, 3-4, and 5 or greater, respectively.
Liver immunohistochemical analysis
Immunohistochemistry for adiponectin, adipoR1 and adipoR2 was performed on additional histologi-cal liver tissue sections. The unstained 5 μm
sec-tions were dried overnight at 60 °C. The secsec-tions were then deparaffinized with xylene and rehydrated in a graded series of ethanol. The sections were in-cubated in a citric acid antigen retrieval solution (Maxim Corp, Fuzhou, China) at 100 °C for 4 min (adiponectin protein expression) or 20 min (adipoR1 and adipoR2 protein expression). After cooling, en-dogenous peroxidase activity was inhibited by incu-bation with 3% H2O2 for 20 min at room temperature, and then the sections were washed with PBS (3 min x 3) and blocked with 10% rabbit serum in PBS for 20 min at room temperature to avoid non-specific reactivity. The sections were then incubated at 4 °C overnight with one of the follow-ing primary antibodies: goat anti-rat adiponectin polyclonal antibody (1:20; R&D Systems, Minneapo-lis, MN, USA), goat anti-rat adipoR1 polyclonal an-tibody (1:50; Novus Biologicals, Littleton, CO, USA) or goat anti-rat adipoR2 polyclonal antibody (1:50; Proteintech, Chicago, USA). The sections were washed with PBS (5 min x 3) and incubated for 30 min with secondary antibody (polymerized horserad-ish peroxidase-conjugated rabbit anti-goat IgG, Max-im Corp, Fuzhou, China) at 37°C. Immunoreactivity was visualized after reacting with diaminobenzidine (Maxim Corp, Fuzhou, China) for 2 min. The sec-tions were then counterstained with Mayer’s hema-toxylin for 2 min. Sections incubated without primary antibody were used as negative controls.
Western blotting
Total protein was extracted from liver tissues us-ing a Protein Extraction Kit (Applygen Technologies Inc., Beijing, China) according to the manufactur-er’s protocol. Total protein levels were determined by the bicinchoninic acid (BCA) method (Applygen Technologies Inc., Beijing, China). An equal amount of each protein sample was separated by sodium do-decyl sulfate polyacrylamide gel electrophoresis (SDS-PAGE) and electro-transferred to 0.45 μm PVDF membranes. The membranes were blocked with 5% skim milk in TBS with 0.1% Tween 20 and then incubated at 4 °C overnight with one of the fol-lowing primary antibodies: goat anti-rat adiponectin polyclonal antibody (diluted 1:1000 in TBS with 0.1% Tween 20; R&D Systems, Minneapolis, MN, USA) goat anti-rat adipoR1 polyclonal antibody (di-luted 1:1000 in TBS with 0.1% Tween 20; Novus Bi-ologicals, Littleton, CO, USA) or rabbit anti-rat adipoR2 polyclonal antibody (diluted 1:500 in TBS with 0.1% Tween 20; Proteintech, Chicago, USA). After three washes with TBS-Tween, the membranes FPG (mmol/L) x FINS (mU/L)
were incubated with HRP-conjugated anti-goat sec-ondary antibody (1:5,000; Multi Sciences Biotech Co., Hangzhou, China) or HRP-conjugated anti-rab-bit secondary antibody (1:5,000; Multi Sciences Bio-tech Co., Hangzhou, China) at room temperature for 1 h. The membranes were exposed using the ECL system (Applygen Technologies Inc., Beijing, China), and the bands were quantified using Adobe Photoshop CS5.0 (Adobe Company, USA).
RT-qPCR analysis
Total RNA was extracted using TRIzol reagent (Invitrogen, USA) according to the manufacturer’s instructions. After determining the RNA concentra-tions by measuring the absorbance at 260 nm and 280 nm, 4 μL of RNA was reverse transcribed to cDNA using a RevertAid™ First Strand cDNA Syn-thesis Kit (Fermentas, USA). Quantitative real-time PCR (RT-qPCR) was performed on a 7500 Real-time PCR machine (ABI Applied Biosystems) using Power SYBR Green PCR Master Mix. The following primer sequences were utilized:
• Adiponectin, forward 5’- GACTGCCACTAAT-TCAGAGC-3' and reverse 5'-CTCATGGGGA-TAACACTCAG-3'.
• AdipoR1, forward 5'-GCTGGCCTTTATGCT-GCTCG-3' and reverse 5'-TCTAGGCCGTAACG-GAATTC-3'.
• AdipoR2, forward 5'-CCACAACCTTGCTTCATCTA-3' and reverse 5'-GATACTGAGGGGTGGCAAAC-5'-CCACAACCTTGCTTCATCTA-3'. • β-actin, forward
5'-GTAGCCATCCAGGCTGT-GTT-3' and reverse 5'-AACACAGCCTGGAT-GGCTAC-3'.
The cycling conditions were as follows: 10 min at 95 °C followed by 40 (adipoR1/R2) or 45 (adiponectin) cy-cles of 15 seconds at 95 °C and 1 min at 60 °C (adi-poR1/R2) or 57 °C (adiponectin). A melting curve analysis was used to confirm the specificity of the PCR products, which was demonstrated as a single peak (data not shown). The expression of β-actin served as the internal control. Each sample was analyzed in triplicate. The previously reported comparative Ct method was used to analyze the real-time PCR data.
Statistical analysis
The data are presented as the mean ± standard deviation. The significance of the differences was de-termined by one-way ANOVA. The differences be-tween the two groups were analyzed by Student’s
t-test. To test the associations between different var-iables, Spearman’s correlation analysis was per-formed. A two-tailed P-value of < 0.05 was considered statistically significant. SPSS 13.0 for Windows (SPSS Software, Chicago, IL, USA) was used to perform the statistical analysis.
RESULTS
Animal characteristics
Throughout the experimental period, the weight, hepatic wet weight and liver coefficient were higher in the rats fed an HFD than in the control rats, al-though there was no significant difference between the HDF1 and NC1 groups (P = 0.067). The body weight (P < 0.01), hepatic wet weight (P < 0.001) and liver coefficient (P < 0.001) were markedly in-creased in the HFD2 group compared with the NC2 group. In addition, the body weight (P < 0.001), he-patic wet weight (P < 0.01) and liver coefficient (P < 0.05) were significantly higher in the HFD2 group than in the HFD1 group. The body weight in the DIET group tended to be lower than that in the HFD2 group, but the difference was not significant (P > 0.05). Nevertheless, the hepatic wet weight (P < 0.001) and liver coefficient (P < 0.001) were sig-nificantly lower in the DIET group compared with the HFD2 group (Table 1).
Biochemistry assays
levels decreased after dietary intervention. Certain lipid metabolism markers, including TG, TC and LDL-C, were up-regulated, but HDL-C was down-regulated in the HFD groups compared with the NC groups. After dietary intervention, all of the lipid metabolism parameters improved significantly in comparison with the HFD2 group (Table 1).
Liver pathology
HE staining of liver specimens from HFD rats suggested that the rat model of NAFLD had been successfully established. In liver samples from the HFD1 group, steatosis lesions were observed in hepatocytes, which showed a speckled distribution with more serious lesions around the central vein and mild lesions in the portal vein area. In the liver samples from the HFD2 group, steatosis was
present along with liver lobule destruction, lobular inflammation and ballooning degeneration of hepa-tocytes, but fibrosis lesions were not apparent. The NAFLD activity score (NAS) for the HFD1 group was 3.7 ± 0.52, which was higher than that for the NC1 group (0.5 ± 0.55; P < 0.001); the NAS for the HFD2 group was 6.57 ± 0.79, which was higher than that for the NC2 group (0.5 ± 0.54; P < 0.001) (Figure 1B). In contrast to the HFD2 group, the liv-er samples from the DIET group showed improve-ment in steatosis, ballooning degeneration and inflammation (Figure 1 and Table 2).
Adiponectin and adipoR1/R2 protein expression in liver tissue
Immunohistochemical staining of rat liver speci-mens showed that adiponectin was primarily Table 1. Comparison of the animal characteristics and biochemical parameters.
NC1 (n = 8) HFD1 (n = 8) NC2 (n = 8) HFD2 (n = 8) DIET (n = 8)
Body weight (g) 520.57 ± 29.43 559.77 ± 36.26 658.13 ± 40.83 745.33 ± 63.63d 701.07 ± 31.73
Hepatic wet weight (g) 14.59 ± 1.28 25.58 ± 1.83a 15.91 ± 1.31 39.66 ± 6.58e 20.84 ± 3.87i
Liver coefficient (%) 2.80 ± 0.19 4.58 ± 0.38a 2.42 ± 0.14 5.29 ± 0.46e 2.96 ± 0.45i
Adiponectin (μg/mL) 4.05 ± 1.19 3.37 ± 0.63 5.03 ± 1.16 3.27 ± 0.41d 4.21 ± 0.59g
FPG (mmol/L) 8.83 ± 1.08 9.70 ± 0.25 9.32 ± 1.23 9.29 ± 0.94 10.20 ± 0.94
FINS (mIU/L) 42.98 ± 10.55 100.12 ± 72.43a 47.45 ± 14.55 107.66 ± 48.93e 66.15 ± 34.69
HOMA-IR 16.76 ± 3.99 43.21 ± 31.46a 19.60 ± 6.54 44.83 ± 20.99e 29.78 ± 14.77
AST (U/g prot) 19.87 ± 14.12 32.60 ± 11.09 27.12 ± 9.07 43.18 ± 20.56d 14.53 ± 12.93g
ALT (U/g prot) 8.56 ± 2.34 16.07 ± 4.71a 15.45 ± 9.58 29.86 ± 7.79e 22.15 ± 14.21
TG (mmol/L) 0.71 ± 0.14 1.02 ± 0.50 0.70 ± 0.18 1.11 ± 0.39e 0.76 ± 0.17g
TC (mmol/L) 2.59 ± 0.45 4.63 ± 1.29b 3.53 ± 1.2 4.86 ± 0.88d 2.96 ± 0.31h
HDL-C (mmol/L) 2.23 ± 0.22 1.00 ± 0.09c 1.73 ± 0.34 0.74 ± 0.12f 1.86 ± 0.32 h
LDL-C (mmol/L) 1.17 ± 0.21 2.23 ± 1.04a 1.55 ± 1.31 3.65 ± 0.81e 1.43 ± 0.28h
a P < 0.05, b P < 0.01, and c P < 0.001 compared with the NC1 group; d P < 0.05, e P < 0.01, and f P<0.001 compared with the NC2 group; g P < 0.05, h P < 0.01, and i P < 0.001 compared with the HFD2 group. Liver coefficient (%) = [hepatic wet weight (g) x 100]/[body weight (g)].
Figure 1. HE staining of liver specimens. A. HE staining of liver specimens in the NC1 (a), HFD1 (b), NC2 (c), HFD2 (d), and DIET (e) groups (x 200). B. NAFLD activity scores in the liver specimens. * P < 0.001 compared with the NC1 group. ** P < 0.001 compa-red with the NC2 group; and *** P < 0.001 compacompa-red with the HFD2 group.
A B
*
**
***
8
6
4
2
0
NC1 HFD1 NC2 HFD2 DIET
Hepatic steatosis grade
a b c
Table 2. Histological parameters of the liver specimens.
NC1 (n = 8) HFD1 (n = 8) NC2 (n = 8) HFD2 (n = 8) DIET (n = 8)
Inflammation grade (0-3) 0.33 ± 0.52 1.33 ± 0.5a 0.17 ± 0.42 2.14 ± 0.38d 0.86 ± 0.38g
Fat (%) 0.83 ± 2.04 64.17 ± 5.85c 2.5 ± 4.2 82.14 ± 6.98d 39.17 ± 9.17g
Ballooning degeneration (0-2) 0 0 0 1.83 ± 0.4d 0.67 ± 0.5g
a P < 0.05, and c P < 0.001 compared with the NC1 group; d P < 0.001 compared with the NC2 group. g P < 0.001 compared with the HFD2 group.
Figure 2. Immunohistochemical staining for hepatic adiponectin (A), adipoR1 (C) and adipoR2 (E). The sections labeled ‘a’ were from the NC1 group, and those labeled ‘b’, ‘c’, ‘d’, and ‘e’ were from the HFD1, NC2, HFD2, and HFD+D groups, respective-ly. ‘f’ represents the negative control sections (x 200). (B, D, F) Relative adiponectin (B), adipoR1 (D) and adipioR2 (F) immuno-histochemical scores in liver tissue from the five groups. * P < 0.001 compared with the NC1 group. † P < 0.001 compared with the NC2 group; and ‡ P<0.05, § P < 0.01, and || P < 0.001 compared with the HFD2 group.
A
a b c
d e f
a b c
d e f
a b c
d e f
CC
EE
B
D
FF
†
‡
*
†
§
*
†
| | 15
10
5
0
Adiponectin
immunohistochemical score
NC1 HFD1 NC2 HFD2 DIET
15
10
5
0
AdipoR1
immunohistochemical score
NC1 HFD1 NC2 HFD2 DIET
15
10
5
0
AdipoR2
immunohistochemical score
expressed in vascular endothelial cells and that its receptors were predominantly expressed in the cyto-plasm of hepatocytes. The results suggested that ad-iponectin expression tended to be lower in the HFD1 group compared with the NC1 group, but the differ-ence was not significant. The expression of adipoR1 and adipoR2 was down-regulated in the HFD1 group compared with the NC1 group. The expres-sion of adiponectin and its receptors decreased after 16 weeks on an HFD compared with the NC2 group.
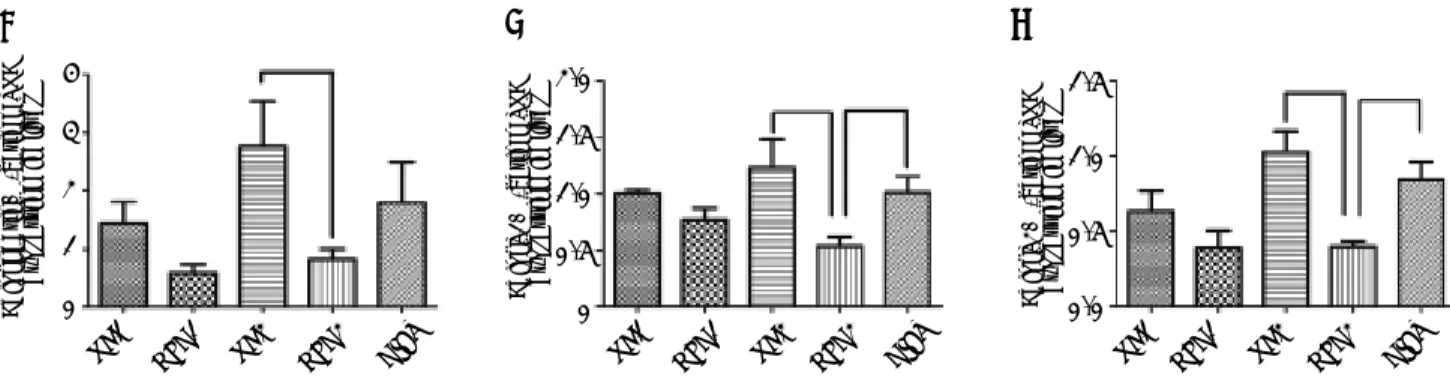
Figure 3. Relative adiponectin protein expression in liver as determined by western blotting using GAPDH as a reference protein (A, B). Relative adipoR1 protein expression in the liver as determined by western blotting using GAPDH as a reference protein (C, D). Relative adipoR2 protein expression as determined by western blotting using GAPDH as a reference protein (E, F). * P < 0.05 and † P < 0.01 compared with the NC1 group; ‡ P < 0.05 and § P < 0.01 compared with the NC2 group; and ||P < 0.05 and¶ P < 0.01 compared with the HFD2 group.
The protein expression of adiponectin and its recep-tors increased in the DIET group compared with the HFD2 group (Figure 2). Western blotting confirmed that adipoR1/adipoR2 expression decreased in the HFD1 group compared with the NC1 group. The protein expression of adiponectin, adipoR1 and adi-poR2 was decreased in the HFD2 group compared with the NC2 group. Markedly higher expression of adiponectin and adipoR1/adipoR2 was observed after dietary intervention (Figure 3).
AA
C
E
B
D DDD
FFFF
‡
||*
‡
||†
§ ¶
0.5 0.4 0.3 0.2 0.1 0.0
Adiponectin/GAPDH
protein expression in liver
NC1 HFD1 NC2 HFD2 DIET
1.5
1.0
0.5
0.0
AdipoR1/GAPDH
protein expression in liver
NC1 HFD1 NC2 HFD2 DIET
NC1 HFD1 NC2 HFD2 DIET
1.5
1.0
0.5
0.0
AdipoR2/GAPDH
protein expression in liver
NC1 HFD1 NC2 HFD2 DIET
Adiponectin
GAPDH
NC1 HFD1 NC2 HFD2 DIET
AdipoR1
GAPDH
NC1 HFD1 NC2 HFD2 DIET
AdipoR2
The mRNA expression of
adiponectin and adipoR1/R2 in liver tissue
Our quantitative real-time PCR data indicated that the mRNA expression of adiponectin was lower in the HFD1 group than in the NC1 group, but the difference was not significant (P > 0.05); however, adiponectin mRNA expression was significantly de-creased in the HFD2 group compared with the NC2 group (P < 0.05). The mRNA expression of the adi-ponectin receptors (adipoR1/adipoR2) was signifi-cantly down-regulated (P < 0.05) in the livers from the HFD groups compared with those from the NC groups. The data also showed that the DIET group exhibited an increasing trend in adiponectin recep-tor expression, but the data were not significant. The expression of the adiponectin receptors was sig-nificantly increased in the DIET group compared with the HDF2 group (Figure 4).
Correlation analysis of adiponectin and liver histological alterations
The immunohistochemistry scores of the expres-sion of adiponectin and its receptors were negatively correlated with the inflammation grade, percent fat, and ballooning degeneration (P < 0.001). Plasma adiponectin levels were negatively correlated with the inflammation grade (P = 0.003) and percent fat (P = 0.002) but were not correlated with ballooning degeneration (P = 0.092) (Table 3).
DISCUSSION
NAFLD has a high incidence and is closely relat-ed to obesity. The histology of NAFLD ranges from simple steatosis to severe steatohepatitis and can de-velop into NASH, which can progress to cirrhosis and liver failure. The diagnostic procedure for con-firming NAFLD involves a liver biopsy. Liver tissue with NASH contains fatty deposits, inflammation and damaged hepatic cells.23 In our study, HFD
in-duced NAFLD in rats, and longer exposure to an HFD led to more severe histological lesions, which was supported by the NAS for the HFD group. HE staining of rat liver specimens showed steatosis le-sions in hepatocytes from the HFD1 group and more severe steatosis with destruction of the liver lobules and lobular inflammation in the HFD2 group. The NAS for the HFD1 group was 3.67 ± 0.55, which in-dicates probable NASH, and the NAS for the HFD2 rats was 6.57 ± 0.79, which corresponds with a di-agnosis of NASH.23 A NAFLD rat model was
suc-cessfully created by feeding the animals a high-fat diet.
Adiponectin, an adipokine secreted by adipose tis-sue, plays an important role in regulating glucose and lipid metabolism and controlling energy home-ostasis in insulin-sensitive tissue.24 Adiponectin
sig-nals through specific receptors (adipoR1/adipoR2), but its role and that of its receptors in the progres-sion of NAFLD are unclear. There is evidence that both adiponectin receptor agonists and up-regulated
Figure 4. Adiponectin (A), adipoR1 (B) and adipoR2 (C) mRNA expression in rat liver tissue. *P < 0.05 compared with the HFD2 group.
Table 3. Correlations between serum adiponectin levels and the immunohistochemical scores for adiponectin and its receptors and inflammation grade, fat (%), and ballooning degeneration in the rat liver.
Variable Inflammation grade (0-3) Fat (%) Ballooning degeneration (0-2)
Hepatic adiponectin r = -0.749, P < 0.001 r = -0.750, P < 0.001 r = -0.847, P < 0.001
Hepatic adipoR1 r = -0.740, P < 0.001 r = -0.802, P < 0.001 r = -0.705, P < 0.001
Hepatic adipoR2 r = -0.787, P < 0.001 r = -0.874, P < 0.001 r = -0.589, P < 0.001
Plasma adiponectin r = -0.550, P = 0.003 r = -0.562, P = 0.002 r = -0.806, P = 0.092
AA BB CCCC
NC1 HFD1 NC2 HFD2 DIET
4
3
2
1
0
Adiponectin/
β
-actin mRNA
expression in liver
NC1 HFD1 NC2 HFD2 DIET NC1 HFD1 NC2 HFD2 DIET
2.0
1.5
1.0
0.5
0
AdipoR1/
β
-actin mRNA
expression in liver
1.5
1.0
0.5
0.0
AdipoR2/
β
-actin mRNA
adiponectin receptor expression alleviate insulin re-sistance.25 Insulin resistance is commonly
consid-ered a pivotal feature of NAFLD.5 Hence, there is a
hypothesis that adiponectin and its receptors may be promising therapeutic targets for the treatment of NAFLD. Our study found that the expression of adi-poR1 and adipoR2 in liver tissue decreased signifi-cantly and that this was accompanied by insulin resistance and hyperlipidemia in the HFD1 group (rats fed a high-fat diet for 8 weeks); in this group, adiponectin expression exhibited a decreas-ing trend that was not significant. After bedecreas-ing on an HFD for 16 weeks, rats in the HFD2 group present-ed with more severe glucose and lipid metabolic dis-turbances as well as with hepatic lesions with decreased expression of adiponectin and its recep-tors (adipoR1/adipoR2). To further explore the rela-tionship between the expression of the adiponectin pathway and the extent of hepatic pathology, we used Spearman’s rank correlation coefficient to ana-lyze the selected variables. The staining intensity of adiponectin and its receptors negatively correlated with the percent fat, ballooning degeneration and the inflammation grade. Plasma adiponectin levels were negatively correlated with the percent fat and the inflammation grade. The data indicated that adi-ponectin and its receptors potentially play a role in the pathogenesis of NAFLD.
Currently, lifestyle (including diet and exercise) intervention is the fundamental strategy for treat-ing NAFLD, as there is no consensus on effective pharmacological treatment. An important aspect of lifestyle is diet. Although dietary intervention is rec-ommended as a primary treatment for NAFLD, there is little scientific data on diet and NAFLD. The effects of dietary intervention on the expression of adiponectin and its receptors in liver tissue require confirmation. Some recent articles have suggested that decreasing total fat intake may be beneficial for treating nonalcoholic steatohepatitis, but these con-clusions were based on a limited number of clinical human studies, some of which lacked a proper con-trol group and were limited by the disinclination to undergo an invasive liver biopsy.7,8,26,27 It is
neces-sary to perform adequately stringent trials of die-tary therapy in NAFLD with histologic analysis as the final outcome. Due to the constraints on per-forming liver biopsies in patients with NAFLD, our study induced NAFLD in rats with a high-fat diet and then treated these animals with a low-fat diet. The NAFLD rats on a low-fat diet exhibited approxi-mately 6% body weight loss, a lower liver coefficient, improved dyslipidemia and increased adiponectin
levels. Some studies have reported that diet-induced weight loss increases adiponectin levels.19,28-30
Cer-tainly, low-fat diet-induced weight loss is closely re-lated to circulating adiponectin levels. Torres, et al.29 summarized the data, which suggest that a
moderate weight loss of approximately 6% via calor-ic restrcalor-iction improved the intrahepatcalor-ic lipid con-tent, serum aminotransferase levels and hepatic histology. However, the mechanism by which die-tary intervention alters hepatic histology in NAFLD remains incompletely understood. In our study, the NAFLD rats on a low-fat diet experienced an allevia-tion of hepatic steatosis, ballooning degeneraallevia-tion and inflammation, and the expression of adiponectin and its receptors (adipoR1/adipoR2) was up-regulat-ed. Buechler, et al.31 summarized recent original
ar-ticles and proposed that increasing adiponectin levels may be beneficial in the treatment of liver dis-ease and may exert protective effects against hepatic steatosis. In our previous study, globular adiponec-tin ameliorated hepatic steatosis and was suggested as a potential therapy for diabetic rats with NAFLD.32 Therefore, we posited that dietary
inter-vention could ameliorate the hepatic histological le-sions associated with NAFLD by up-regulating the expression of adiponectin and its receptors in liver tissue.
CONCLUSION
In conclusion, an NAFLD rat model was success-fully created by feeding rats an HFD. Adiponectin may play a role in the pathogenesis of NAFLD, espe-cially during the progression from steatosis to NASH. Dietary intervention improved the hepatic histological lesions associated with NAFLD by up-regulating the expression of adiponectin and its re-ceptors in liver tissue.
REFERENCES
1. Mazza A, Fruci B, Garinis GA, Giuliano S, Malaguarnera R, Belfiore A. The role of metformin in the management of
NA-FLD. Exp Diabetes Res 2012; 2012: 716404.
2. de Alwis NM, Day CP. Non-alcoholic fatty liver disease: the
mist gradually clears. J Hepatol 2008; 48(Suppl. 1):
s104-112.
3. Farrell GC, Larter CZ. Nonalcoholic fatty liver disease:
from steatosis to cirrhosis. Hepatology 2006; 43(2, Suppl.
1): S99-S112.
4. Hajiaghamohammadi AA, Ziaee A, Oveisi S, Masroor H. Effects of Metformin, Pioglitazone, and Silymarin Treat-ment on Non- Alcoholic Fatty Liver Disease: A Randomized
Controlled Pilot Study. Hepat Mon 2012; 12(8): e6099.
5. Marchesini G. Nonalcoholic fatty liver, steatohepatitis, and
6. Bellentani S, Dalle Grave R, Suppini A, Marchesini G. Beha-vior therapy for nonalcoholic fatty liver disease: The need
for a multidisciplinary approach. Hepatology 2007; 47:
746-54.
7. Angela M, Zivkovic, J Bruce German, Sanyal AJ. Compara-tive review of diets for the metabolic syndrome:
implica-tions for nonalcoholic fatty liver disease. AM J Clin Nutr
2007; 86: 285-300.
8. Mensink RP, Plat J, Schrauwen P. Diet and nonalcoholic
fatty liver disease. Curr Opin Lipidol 2008; 19: 25-9.
9. Asrih M, Jornayvaz FR. Diets and nonalcoholic fatty liver
disease: The good and the bad. Clinical Nutrition 2014;
33: 186-90.
10. Sullivan S. Implications of diet on nonalcoholic fatty liver
disease. Curr Opin Gastroenterol 2010; 26: 160-4.
11. Kadowaki T, Yamauchi T, Kubota N, Hara K, Ueki K, Tobe K. Adiponectin and adiponectin receptors in insulin
resis-tance, diabetes, and the metabolic syndrome. J Clin
In-vest 2006; 116: 1784-92.
12. Cnop M, Havel PJ, Utzschneider KM, Carr DB, Sinha MK, Boyko EJ, Retzlaff BM, et al. Relationship of adiponectin to body fat distribution, insulin sensitivity and plasma lipo-proteins: evidence for independent roles of age and sex.
Diabetologia 2003; 46: 459-69.
13. Hivert MF, Sullivan LM, Fox CS, Nathan DM, D’Agostino RB, Sr., Wilson PW, Meigs JB. Associations of adiponectin, re-sistin, and tumor necrosis factor-alpha with insulin
resis-tance. J Clin Endocrinol Metab 2008; 93: 3165-72.
14. Li SS, Shin HJ, Ding EL, van Dam RM. Adiponectin Levels
and Risk of Type 2 Diabetes. Clinical Review 2009; 302:
179-88.
15. Arita Y, Kihara S, Ouchi N, Takahashi M, Maeda K, Miya-gawa J, Hotta K, et al. Paradoxical decrease of an
adipo-se-specific protein, adiponectin, in obesity. 1999. Biochem
Biophys Res Commun 2012; 425: 560-4.
16. Yamauchi T, Kamon J, lto Y, Tsuchida A, Yokomizo T. Clo-ning of adiponectin receptors that mediate antidiabetic
metabolic effects. Nature 2003; 423: 762-9.
17. Yoon MJ, Lee GY, Chung JJ, Ahn YH, Hong SH, Kim JB. Adi-ponectin increases fatty acid oxidation in skeletal muscle cells by sequential activation of AMP-activated protein kinase, p38 mitogen-activated protein kinase, and
pe-roxisome proliferator-activated receptor alpha. Diabetes
2006; 55: 2562-70.
18. Yamauchi T, Kamon J, Minokoshi Y, Ito Y, Waki H, Uchida S, Yamashita S, et al. Adiponectin stimulates glucose utili-zation and fatty-acid oxidation by activating
AMP-activa-ted protein kinase. Nat Med 2002; 8: 1288-95.
19. Polak J, Kovacova Z, Jacek M, Klimcakova E, Kovacikova M, Vitkova M, Kuda O, et al. An increase in plasma
adipo-nectin multimeric complexes follows hypocaloric diet-indu-ced weight loss in obese and overweight pre-menopausal
women. Clin Sci (Lond) 2007; 112: 557-65.
20. Engl J, Bobbert T, Ciardi C, Laimer M, Tatarczyk T, Kaser S, Weiss H. Effects of Pronounced Weight Loss on Adipo-nectin Oligomer Composition and Metabolic Parameters.
Obesity 2007; 15: 1172-8.
21. Kaser S, Moschen A, Cayon A, Kaser A, Crespo J, Pons-Ro-mero F, Ebenbichler CF, et al. Adiponectin and its
recep-tors in non-alcoholic steatohepatitis. Gut 2005; 54:
117-21.
22. Shimizu A, Takamura T, Matsuzawa N, Nakamura S, Nabe-moto S, Takeshita Y, Misu H, et al. Regulation of adiponec-tin receptor expression in human liver and a hepatocyte
cell line. Metabolism 2007; 56: 1478-85.
23. Fan JG, Jia JD, Li YM, Wang BY, Lu LG, Shi JP, Chan LY. Guidelines for the diagnosis and management of
nonalco-holic fatty liver disease: update 2010: (published in
Chine-se on ChineChine-se Journal of Hepatology 2010; 18: 163-166). J Dig Dis 2011; 12: 38-44.
24 Deepa SS, Dong LQ. APPL1: role in adiponectin signaling
and beyond. Am J Physiol Endocrinol Metab 2009; 296(1):
E22-E36.
25. Kadowaki T, Yamauchi T. Adiponectin and Adiponectin
Re-ceptors. Endocr Rev 2005; 26: 439-51.
26. Fock KM, Khoo J. Diet and exercise in management of
obe-sity and overweight. J Gastroenterol Hepatol 2013; 28:
59-63.
27. Clark JM. Weight loss as a treatment for nonalcoholic
fatty liver disease. J Clin Gastroenterol 2006; 40:
s39-s43.
28. Madsen EL, Rissanen A, Bruun JM, Skogstrand K, Tonstad S, Hougaard DM, Richelsen B. Weight loss larger than 10% is needed for general improvement of levels of circulating adiponectin and markers of inflammation in obese
sub-jects: a 3-year weight loss study. Eur J Endocrinol 2008;
158: 179-87.
29. Torres DM, Harrison SA. Diagnosis and therapy of
nonal-coholic steatohepatitis. Gastroenterology 2008; 134:
1682-98.
30. Perito ER, Rodriguez LA, Lustig RH. Dietary treatment of
nonalcoholic steatohepatitis. Curr Opin Gastroenterol
2013; 29: 170-6.
31. Buechler C, Wanninger J, Neumeier M. Adiponectin, a key
adipokine in obesity related liver diseases. World J
Gas-troenterol 2011; 17: 2801-11.
32. Ma H, You GP, Zhang XP, Yang XJ, Lu HD, Huang YL, Zhang WQ. A novel role of globular adiponectin in treat-ment with HFD/STZ induced T2DM combined with NAFLD