Long-term comparative study of columnar and surface mass concentration
1
aerosol properties in a background environment
2
3
Y. S. Bennouna, V. E. Cachorro, D. Mateos, M. A. Burgos, C. Toledano, B. Torres
4
and A. M. de Frutos
5
Atmospheric Optics Group (GOA), University of Valladolid (UVA), Valladolid, Spain 6
7
Correspondence to: V. Cachorro ([email protected]) 8
Abstract
9
The relationship between columnar and surface aerosol properties is not a straightforward problem. 10
The Aerosol Optical Depth (AOD), Ångström exponent (AE), and ground-level Particulate Matter 11
(PMX, x=10 or 2.5 µm) data have been studied from a climatological point of view. Despite the 12
different meanings of AOD and PMx both are key and complementary quantities that quantify 13
aerosol load in the atmosphere and many studies intend to find specific relationships between them. 14
Related parameters such as AE and PM ratio (PR=PM2.5/ PM10), giving information about the 15
predominant particle size, are included in this study on the relationships between columnar and 16
surface aerosol parameters. This study is based on long measurement records (2003–2014) obtained 17
at two nearby background sites from the AERONET and EMEP networks in the north-central area 18
of Spain. The climatological annual cycle of PMx shows two maxima along the year (one in late-19
winter/early-spring and another in summer), but this cycle is not followed by the AOD which shows 20
only a summer maximum and a nearly bell shape. However, the annual means of both data sets 21
show strong correlation (R=0.89) and similar decreasing trends of 40% (PM10) and 38% (AOD) for 22
the 12-year record. PM10 and AOD daily data are moderately correlated (R=0.58), whereas 23
correlation increases for monthly (R=0.74) and yearly (R=0.89) means. Scatter plots of AE vs. 24
AOD and PR vs. PM10 have been used to characterize aerosols over the region. The PR vs. AE 25
scatterplot of daily data shows no correlation due to the prevalence of intermediate-sized particles. 26
As day-to-day correlation is low (especially for high turbidity events), a binned analysis was also 27
carried out to establish consistent relationships between columnar and surface quantities, which is 28
considered to be an appropriate approach for environmental and climate studies. In this way the link 29
between surface concentrations and columnar remote sensing data is shown to provide useful 30
information for aerosol characterization from a climatological context, despite some limitations. 31
Capsule
34
The relationships between surface and columnar aerosol properties are strongly impacted by high 35
turbidity events. The best correlations are obtained for the annual scale. 36
37
1. Introduction
38
A common reference indicator for particulate air quality is the concentration of particulate 39
matter (PM) at ground level, which is given in units of mass per unit volume of air (μg m-3). The 40
PM size fraction represented by PM10 and PM2.5 are the most available and commonly used metrics. 41
The PM10, often called “inhalable particles” (EMEP, 1996; Brown et al., 2013), refers to particle 42
fraction with aerodynamic diameters less than 10 μm. In the same way, PM2.5 or “fine particles” 43
(diameters below 2.5 μm) is another measure of particulate matter. The latter is associated to 44
hazardous effects, having far greater efficiency than “coarse particles” (2.5–10 μm) to penetrate the 45
respiratory system and reach the alveolar regions. Consequently, PM10 is usually used as a standard 46
for measuring aerosol loading, while PM2.5 is linked to health and visibility impacts (Pope III, 2000; 47
Pope III and Dockeri, 2006). 48
In the last decades national and international institutions have set limits and guide values for 49
the concentration of various PM size fractions with the aim to protect public health and 50
environment (Delucchi et al., 2002; WHO 2006; EC, 1999, 2008). Although so far this objective 51
has not been universally achieved (Füssel and Jol, 2012), decreasing trends in yearly average have 52
been observed in many European countries (EMEP, 2011,2014; Tørseth et al., 2012; Cusack et al., 53
2012; Boucher et al., 2013; Querol et al., 2014). These reductions are certainly attributed in a great 54
part to the application of these abatement strategies of air pollution (EMEP, 2014). A significant 55
effort has been dedicated to the implementation of continuous ground-based “in-situ” monitoring 56
networks. The European Monitoring and Evaluation Programme (EMEP) established these 57
networks with the goal of studying Long-Distance Atmospheric Pollution. This network provides to 58
scientific community and governments quantitative information on the transport of air pollutants 59
across national boundaries, associated deposition and concentration levels (Tørseth et al., 2012; 60
EMEP, 2011; 2014). However the EMEP PMx observations are too sparse to resolve the large 61
spatial and temporal aerosol variability and thus other measurement techniques, such as remote 62
sensing at ground-based or satellite platform, may also be used. 63
Other networks for aerosol studies are based on powerful remote sensing techniques, like 64
AERONET (Aerosol Robotic Network), which was created in the 1990’s as a federation of national 65
and regional networks managed by NASA. It is a dense network of ground-based sun photometers 66
around the globe (Holben et al., 1998). Such networks constitute a valuable source of information 68
for the establishment of local and regional aerosol characterization and climatology (Holben et al., 69
2001; Dubovik et al., 2002; Toledano et al., 2007a; Bennouna et al., 2011; 2013; Mateos et al., 70
2015). 71
The primary aerosol parameter provided by remote sensing is the Aerosol Optical Depth 72
(AOD), describing the extinction of the electromagnetic radiation in a given atmospheric column 73
attributed to aerosols at a given wavelength. This is the key parameter for measuring the columnar 74
aerosol load. The advantage of this methodology using radiation-particle interaction is the 75
complementary information provided by AOD wavelength dependence, related to the size of 76
particles. The Ångström exponent (AE) derived from AOD wavelength dependence is the 77
parameter supporting this kind of information being the smallest this parameter the largest the 78
particles. However, the AOD is a complex function of the aerosol mass concentration, mass 79
extinction efficiency, relative humidity, and vertical distribution of aerosols, and hence several 80
authors have investigated the relationships between AOD and columnar aerosol volume/mass 81
concentration, surface PMx, mass deposition, or other quantities (Cachorro and Tanré, 1997; 82
Kacenelenbogen et al., 1996; Pelletier et al., 2007; Kokhanovsky et al., 2009; Rohen et al., 2011; 83
Toledano et al., 2012, among others). 84
The AOD, as a parameter representing the extinction over the whole atmospheric column, has 85
a theoretical link with columnar particle volume concentration or columnar mass concentration 86
through the definition of volume/mass efficiency factor (Cachorro and Tanré, 1997; Kokhanovsky 87
et al., 2009; Toledano et al., 2012), but the link of these columnar properties with surface 88
concentration given by PM10 (or PM2.5) measurements is not a straightforward problem and hence 89
empirical relationships are usually established (e.g., Estellés et al., 2012 and references herein; 90
Rohen et al., 2011). 91
In this context and restricting the study to AOD data given by ground-based observations we 92
are interested in the relationships AOD-PM10 including derived quantities such as Ångström 93
exponent (AE) and ratio of PMx fractions (PM2.5/PM10), related with particle size, which also need 94
to be involved in the study of these relations. Thus, the objective of this work is to investigate in 95
detail the relations between these four complementary parameters from a climatological point of 96
view relying on 12 years of overlapping AOD and PMX data (2003-2014) over two background 97
stations of the large region of “Castilla y Leon” in the North-central Iberian Peninsula. This plateau 98
presents a clean continental background aerosol without local pollution and it is adequate for this 99
kind of study. The sites belong to EMEP and AERONET-Europe networks respectively, which 100
carried out taking an area with these characteristics and lengthy records, emphasizing the 102
climatological aspect. 103
It is relevant to note here that in the study area the highest levels of PMx are attributed to 104
desert dust intrusions (Rodríguez et al., 2001; Escudero et al., 2005, 2007; Toledano et al., 2007a; 105
Cachorro et al., 2008), because events of high AOD can also be due to external anthropogenic 106
pollution (showing less influence on PMx values). Impact of desert dust aerosols on AOD 107
(Toledano et al., 2007b; Cachorro et al., 2013) and PMx (Querol et al., 2009; Cachorro et al., 2014; 108
Pey et al., 2013) are of particular interest for the Mediterranean Basin because they have a strong 109
influence on the relationships established hereafter which opens new perspective on their potential 110
use in aerosol studies. 111
The paper begins by introducing the region of study (section 1) and the description of the 112
datasets (section 2). The results are presented in several sections. Section 3.1 gives a brief analysis 113
of the annual cycle, interannual variability and temporal trends. In section 3.2, columnar scatter 114
plots of AOD-AE and surface scatter plots PM10-PR are examined in order to address general 115
findings in terms of general aerosol characterization. Section 3.3 establishes and analyses the 116
relationship PM10-AOD and section 3.4 the PR-AE one. Section 3.5 gives the latter relationships 117
under the analysis of binned data. 118
119
2. Measurement sites and data
120
The locations of the two sites used in this study are presented in Figure 1: the rural village of 121
Peñausende (41.24N, 5.90W, 985m. a.s.l.) and Palencia City (41.99N, 4.52W, 750 m. a.s.l.), both 122
belonging to the autonomous community of “Castilla y León” (CyL). This region located in the 123
North Central part of the Iberian Peninsula lies on the northern plateau of Spain (Castilian Plateau), 124
which has an average altitude of ~800 m, and is crossed by the Duero River, forming a narrow 125
valley. The Castilian Plateau is surrounded by mountains (about 2000-2500 m) that reduce Atlantic 126
and Mediterranean influences, thus leading to the continental climate characterizing this region. The 127
CyL region spans a territory of 94193 km2 with 27 inhabitants per km2, making it the most sparsely 128
populated region of Spain. The biggest metropolitan center of the region is Valladolid City 129
(~400,000 habitants). The small city of Palencia (~100,000 inhabitants) is located about 50 km to 130
the northeast of Valladolid. The little village of Peñausende (~500 habitants) is located in the 131
province of Zamora, about 100 km to the east of Valladolid. Both Palencia and Peñausende sites, 132
are relatively well isolated from big urban and industrial centers, and can therefore be classified as 133
At Peñausende, PMxmeasurements have been carried out continuously since 2001 by means 135
of gravimetric methods, however we only used data from 2003 onward for the overlapping period 136
with AOD data. The samples are collected on quartz fiber filters using MCV-PM1025 high-volume 137
samplers operating at an average flow rate of 30 m3 h-1 with 10μm/2.5μm cut-off inlets. Sample 138
treatment, analytical procedures and quality assurance were performed according to the details 139
described in the EMEP Manual for Sampling and Chemical Analysis (EMEP, 1996). The PM10 and 140
PM2.5 samplings were carried out on a daily basis. Table 1 sums up the number of EMEP PMx 141
measurements available by year. On average, 90% of yearly data are usable. The PR values are 142
derived from the two independent PMx measurements when both are available. 143
Columnar aerosol properties, here aerosol optical depth and Ångström exponent, are derived 144
by direct sun and sky radiation sunphotometer measurements. The AOD gives the total load of 145
aerosol over the vertical column and it is generally measured at various wavelengths. This spectral 146
wavelength dependence defines the AE parameter related to particle size (Cachorro et al., 2000; 147
Vergaz et al., 2005; Toledano et al., 2007a), and thus gives information about the prevalence of fine 148
or coarse fractions. The AERONET AOD at 440nm and the AERONET derived value for AE, 149
using wavelengths in the range 440-870nm, are used in this study. 150
A Cimel sunphotometer belonging to RIMA (Iberian Network for Aerosol Measurements) 151
located at the outskirts of Palencia (University Campus, Superior Technical School of Forestry and 152
Agricultural Engineering) and operating in the frame of AERONET-EUROPE (Holben et al., 1998; 153
Goloub et al., 2012), provided continuous aerosol measurements from 2003 to 2014 with the 154
exception of a long period between 2009 and 2010. This gap in Palencia data was completed by 155
values from Autilla station, another nearby RIMA-AERONET site (3 km apart from Palencia city; 156
Bennouna et al., 2013). Raw AOD data provided every 15 minutes by direct sun radiation 157
measurements are cloud-contaminated (level 1.0), thus an automatic cloud screening algorithm 158
(Smirnov et al., 2000) is applied to obtain level 1.5. The final data level named “quality assured” 159
level 2 is the one used in this study, where pre- and post-calibration are accounted for with a final 160
manual inspection according to AERONET protocols. The AOD accuracy for level 2 AERONET is 161
about 0.01 in the visible and near infrared spectral regions (Eck et al., 1999). 162
We must emphasize that the distance between both monitoring sites (~100 km) is not an 163
obstacle to link the aerosol properties in this representative area of the North-central Spain, because 164
the plateau between them with no relevant local aerosol sources and where external events of high 165
turbidity are clearly identified at both sites at the same time. Otherwise, the different intrinsic 166
measure while daily sun-photometer data are based on nearly instantaneous, every 15-minutes, 168
values) seem to play a major role on the AOD-PMx differences.
169 170
3. Results
171
3.1. Climatological annual cycle, variability and trends of AOD, PMx, AE and PR.
172
A quick description of the annual cycle from 2003 to 2014 is shown for AOD, AE, PM10 and 173
PR quantities in Figure 2, and Figure 3 presents their respective interannual variability; associated 174
statistical values are reported in Tables 2-5. At Peñausende the mean value and standard deviation 175
of PM10 is 10.6 ± 9.0 μg m-3 and the AOD at Palencia is 0.13±0.09, given a ratio of 81.5 μg m-3 per 176
unit of AOD (near 100). What stands out is the high standard deviations of 85% and 69% 177
respectively, indicating high variability (also shown by Tables 2-3). The most important feature is 178
the low level of aerosol load in the study area representative of a rural regional background. 179
180
3.1.1 Climatological annual cycle 181
The climatological annual cycle of PM10 (see Figure 2a) is characterized by high values in 182
late-winter/early-spring and summer, and low values in winter and fall, with two maxima, one in 183
March (11.4 μg m-3) and the other in August (14.7 μg m-3), with a pronounced minimum between 184
them. Like for PM10, the lowest values of the AOD are found in winter (~ 0.09) and the highest 185
values in summer (~ 0.15) with increasing (decreasing) values in spring (fall) resulting in a nearly 186
bell shaped annual cycle. However, no relevant minimum in spring appears for the AOD,although a 187
slight minimum can be observed in May. Therefore, the most obvious difference between the mean 188
annual cycles of AOD and PM10 is the presence of these two clear seasonal maxima for PM10. 189
Although it is not shown here, the climatological curve of PM2.5 presents the same variations 190
and shape as that of PM10. The PM10 and PM2.5 data are strongly correlated with a Pearson 191
coefficient of R=0.89 and a slope of 0.58, which corresponds to the mean value of PR. Thus the 192
annual cycle of PR (Figure 2b) shows very little variation in the monthly means with slightly higher 193
values in winter, being nearly constant around the average value of 0.58 ± 0.15 (Table 3). The 194
Ångström exponent is also rather constant throughout the year, with an average value of 1.28 ± 195
0.37, but with lower values in winter-spring than during summer-early fall. Therefore, there is a 196
discrepancy between PR and AE annual cycles during summer months. For both PR and AE 197
parameters, day-to-day variations within a month are generally large for all months as indicated by 198
the great variability associated to the means (Tables 2-3 and Figure 2), but they present monthly 199
means around their total average and hence these two parameters correlate poorly, as discussed 200
variations as compared to AE. This may be also noted when analysing in detail major desert dust 202
events that lead to an important decrease of the AE parameter while PR values remain little affected 203
in these cases (Cachorro et al., 2013, 2014). These results show that on average aerosol particles of 204
intermediate size are representative of the north central area of the Iberian Peninsula. 205
As mentioned, the area of “Castilla y León” is characterized by prevalent clean atmospheric 206
conditions with the occurrence of moderate-to-strong desert dust intrusions or long-range 207
transported pollutants of anthropogenic origin (see P95 percentiles in Tables 2-3). We must bear in 208
mind that in this area only desert dust (DD) outbreaks contribute substantially to the values of PMx, 209
whereas fine particles which characterize anthropogenic pollution aerosols events, have relatively 210
less influence over mass concentration. On the contrary, AOD is impacted in a similar way by both 211
types of events. This fact partly explains the differences between both annual cycles, one of the 212
most important causes being the vertical distribution of aerosols and the complex deposition 213
processes introducing different time delay between surface and columnar detections. Another 214
reason is the intrinsic differences in measurement techniques of both quantities, as already 215
mentioned. 216
217
3.1.2 Interannual variability and trends 218
A moderate year-to-year variability of both PM10 and AOD data is observed in Figure 3a with 219
a similar decreasing trend during the period 2003-2014. Using the Mann-Kendall Trend Test with 220
the Sen’s Slope method (e.g., Mateos et al., 2015), PM10 gives a trend of -0.42 μg m-3 per year with 221
a 95% confidence interval of [-0.55,-0.3], thus resulting in a reduction of 40% during the period 222
2003-2014. The AOD trend is -0.005 (-38%) with a confidence interval of [-0.007,-0.004]. Hence, 223
both parameters show similar reduction, which suggests that the evolution of one of these 224
parameters can be inferred from the other. These decreasing trends and possible causes have been 225
analysed recently by various authors for PMx data (Barmpadimos et al., 2012; Cusack et al., 2012; 226
Querol et al., 2014; Mateos et al., 2015) and for AOD (Mateos et al., 2014, 2015) over the Iberian 227
Peninsula. Although not relevant, the differences between the results of these authors can be 228
attributed to the use of different mean values (yearly or monthly), periods and methods. 229
Figure 3b presents the inter-annual variability for the PM ratio and AE parameters, where AE 230
appears to be more variable than PR (also at monthly level, not shown here). Though weak as 231
compared to that of AOD/PM10, there is also a decreasing trend which is more pronounced in PR 232
and less obvious in AE. For each year PM ratio remains relatively constant throughout the seasons 233
with some slight differences between one year and the other during summer (not shown). On the 234
thus on a monthly level AE parameter is more variable than PR. In order to properly interpret these 236
results, we must bear in mind that AE can vary from 0 to 2.5 while PR range is between 0 and 1. 237
The PR exhibits a reduction trend over the 12 analysed years of 22% (due to the fact that PM2.5 238
presents a reduction of ~60%) whereas AE only shows 8% reduction (value within the range of 239
annual variability), which highlights the fact that each quantity is related to particle size in a 240
different way: PR linked with the strong reduction of particle concentration and AE more linked 241
with the AOD spectral dependence (remember that the effectivity of particle-radiation interaction is 242
related to the size of particles and the range of wavelength). 243
It is important to note here that the observed differences between these surface and columnar 244
properties cannot be attributed to different samplings (i.e. total number daily data around 70% for 245
AOD against 90% for “in-situ” data), since the climatological analysis using only PM10-AOD 246
coincident pairs yields to similar results. Bear in mind that PMx measurements are made under all 247
weather conditions including overcast and/or partially cloudy conditions where there are no or few 248
available data for the AOD. Cloud screening in AOD measurements under highly variable turbidity 249
episodes (such as relatively strong desert dust intrusions) affected by clouds is extremely difficult. 250
Therefore, specific cases such as a desert dust episodes clearly detected by PMx data, may not be 251
visible in AOD, leading to discrepancies in monthly means which in turn affect yearly means. In the 252
present data set yearly means are not affected by these sampling issues and correlate strongly as 253
shown later on (section 3.2.2). However, if a high discrepancy in PMx-AOD yearly mean is 254
observed, it is reasonable to suspect possible problems in the database. 255
256
257
3.2. Relationships between AOD-AE, PM10 -PR 258
259
In order to better understand the relationship between columnar-surface quantities it is 260
relevant to know previously the distinct behaviour of each pair: AE-AOD on one hand and PR-261
PM10 on the other. 262
3.2.1. AE-AOD columnar relationship 263
Figure 4 is a plot of the AE parameter versus AOD for daily (figure 4a-b) and instantaneous 264
databases (Figures 4 c-d) with values of PM10 (a, c) and PR (b, d) represented by a colour scale. For 265
shake of clarity, Figures S1 and S2 (supplementary material) separately show each category of 266
PM10 or PR and a 3D plot of the AE vs. AOD. These AE-AOD scatterplots of intensive-extensive 267
quantities are part of the general site aerosol characterization and hence frequently used in columnar 268
discriminate aerosol types according to defined aerosol climatological models, such as continental, 270
maritime, desert dust, biomass burning, etc. (Hess et al., 1998; Eck et al., 1999; Vergaz et al., 2005; 271
Toledano et al., 2007a) and to quantify their respective contribution. The PM10 and PR range values 272
in the graphs of Figure 4 allow a comprehensive analysis of these four quantities, and together with 273
Figure 5 are necessary for a deeper interpretation of the relationship between them. 274
As it can be seen in Figure 4a, most AOD-AE daily averages (about 80%) are in the range of 275
0.0-0.2 and 1.0–2.0 respectively, which are typical of a clean continental area (e.g., Toledano et al., 276
2009; Bennouna et al., 2013). PM10 values from 0-10 μg m-3 (50% of total) extend over the whole 277
range of AOD with 47% corresponding to AOD ≤0.10 (inset in Figure 4a). For these data sets AE 278
parameter also cover all range of sizes from 0 to 2. These values of PM10 below 10 μg m-3 together 279
with those between 10-20 μg m3 (38% of data) are the most frequent and extend over all the ranges 280
of the plot (dark and light blue points), considerably surpassing the AOD value of 0.2 and even 281
reaching the highest AOD values. Bearing in mind that the average of AOD is 0.13±0.9, mean value 282
plus the standard deviation is 0.22, therefore values higher than this threshold may be considered 283
events of high turbidity in this area, being considered as high-to-moderate between 0.2-0.3 and 284
higher than 0.3 as strong-extreme cases. These cases of high turbidity represent 18% of the total 285
AOD database. On the other hand, PM10 values larger than 20 μg m-3 only represent 12% of total 286
data which are represented by green points in Figure 4a (PM10 between 20 to 40 μg m-3 with AOD 287
from 0.1 to 0.6) and red-brown points (PM10 greater than 40 μg m-3 are only 2.6% of the total 288
values, thus few days correspond to strong-extreme events of high turbidity) in Figure 4a. 289
The same can be observed in Figure 4c corresponding to instantaneous values, which 290
illustrates a more detailed information and provides a better view of the results. For example, the 291
particularly strong extreme events in AOD correspond to intense desert dust intrusions of very low 292
AE values (bottom branches of brown colour with PM10 values higher than 50 μg m-3) or to 293
anthropogenic pollution events coming from far off areas of our region with high values of AE (top 294
branches of green colour). Furthermore, mixed aerosol type (blue light colour) with values of AE in 295
1-1.5 but moderate PM10 values (10-20 μg m-3 interval) are clearly visible in the centre of Figure 4c. 296
Although these two figures (4a, c) allow a good characterization of aerosols, we must note that in 297
general there is a great mixing between the different range of values of both PM10 and AOD data. 298
This behaviour means a weak connection between AOD and PM10 under certain conditions when 299
taking daily data, as discussed later on. 300
With respect to particle size Figures 4b,d illustrate the behaviour of daily and instantaneous 301
AE-AOD values but now with the colour scale representing PR values. Values of PR below 0.3 are 302
represent very pure desert dust aerosols (or weakly mixed with other aerosol types during transport) 304
with values of AOD beyond 0.2. The PR values between 0.3-0.5 (green points, 19%) are largely 305
missing from the figure but they span the whole range of AE (between low values up to ~2) and 306
AOD. The majority of PR daily data (purple points, 50%) range from 0.5 to 0.7 and cover all the 307
ranges on the AE-AOD plot with the exception of extreme desert dust (bottom-right area). These 308
PR values represent medium particle size, also corroborated by AE values (observe the branches at 309
AE ~1.3 and that at 1.8), and include pollution episodes with the highest AOD (right-top branches) 310
which is not the case for PM10. The PR values larger than 0.7 (orange, red and brown colours 311
points, ~23%) point out particles of medium-to-fine size and hence have values of AE greater than 312
1 and with AOD values up to 0.4. The region around AE ~1.2-1.5 and AOD ~ 0.1 corresponds to 313
the highest density of data points. 314
315
3.2.2 Surface PR-PM10 Relationship
316
Figures 5a-b presents the scatterplots of daily data of PR versus PM10 (equivalent to Figures 317
4a-b for AE-AOD) with values of AOD and AE represented by a color scale. For shake of clarity, 318
Figures S3 and S4 (supplementary material) separately show each category of AOD or AE and a 3D 319
plot of the PR vs. PM10. These scatterplots are not usually analysed in air quality studies based on 320
PMx data. As only daily values are available for these quantities, there is a certain limitation in the 321
information compared to the combination of AOD-AE data (Figure 4 c-d), especially when events 322
must be analysed in detail. The most curious is the shape the data points take in the figure, curves 323
resembling those of “the wings of a butterfly”, which are due to the low values of PMx where the 324
points are discretized (integer values for PM10 and PM2.5) and superimposed. As it can be seen, only 325
for very low PR values (less than 0.4) or larger PM10 values (about 20 μg m-3) the points appear as 326
scattered points in the figure. This discretized behaviour makes that important information is 327
missing in the figure. Blue points are masked in Figure 5a (this information can be seen in 328
supplementary material), and they correspond to AOD from 0 to 0.2 and account for the majority of 329
all points. 330
In Figure 5b (with AE in the colour scale) only the range of light-green points for AE between 331
1-1.5 are masked by superimposed dark-green points of AE values between 1.5 and 2. Both ranges, 332
representing medium and fine particles, are the most abundant. Obviously, most of the behaviour 333
shown by Figure 5 is already described in Figure 4. However, it is relevant to conclude that AOD-334
AE scatterplot for daily data contain more useful information than that of PM10-PR. The reason 335
behind this behaviour is that AE has more valuable information about particle size than PR, as 336
AOD dependence, which according to the Mie Theory carries useful information about particle size 338
because of the complex interaction of particle and radiation. 339
340
3.3 Relationships between columnar and surface load of aerosols, PM10-AOD. 341
The useful information given by the above plots will help us to better interpret the PM10-AOD 342
relationship. Figure 6a-b shows this relationship using the 2622 coincident days where AE and PR 343
values are represented by a colour scale, respectively. The moderated-to-low correlation of PM10-344
AOD is due to the bulk of points covering the different ranges of values as analysed before. For 345
instance, calues of PM10 below 20 μg m-3 contain most of the AOD values up to 0.3. There are very 346
few points beyond AOD=0.4 and PM10=40 μg m-3
which are well observed in the graph, most of 347
them corresponding to desert dust intrusions (e.g., Cachorro et al., 2008; 2013; 2014) as it is 348
indicated by the blue colour of AE and PR. Days of anthropogenic pollution are also detected with 349
moderated-to-high values of AE and PR (purple and orange colours). As expected, in general PM10 350
values increase with AOD but with a wide range of variation. For episodes of high–to-extreme 351
intensity, both AOD and PM10 present high values and their correlation is very dependent on the 352
type of episode (anthropogenic pollution or desert dust) and on atmospheric conditions. For 353
example, in the case of desert dust episodes there are important day-delays between the detection by 354
PM10 and by AOD, which cannot be explained easily due to the complex deposition processes. 355
The correlation established in Figure 7a for daily data presents a slope of 62.7 and an intercept 356
of 3.5 (a slope of 80.0 is obtained when the line is constrained to pass through the origin). As 357
expected, and considering other works (e.g., Kacenelenbogen et al., 2006; Estellés et al., 2012), 358
these two parameters are moderately correlated with a correlation coefficient of 0.61 (p-value less 359
than 0.001), lying between the 95% confidence interval (0.54-1). The PM10-AOD correlation is 360
improved when considering monthly means (Figure 7b) increasing the correlation coefficient to 361
0.74 (p-value less than 0.001), with a slope of 69.4 and an intercept of 2.3. Finally the correlation 362
for yearly data (Figure 7c) has a similar slope to monthly data and an intercept of 1.4, with a very 363
high correlation coefficient R=0.9. Indeed, a likely primary reason for this overall moderate 364
correlation is the high variability of aerosols in a short range of AOD and PM10 due to the clean 365
conditions of the area where the prevailing particles (about 85%) are medium-to-fine size with AE 366
between 0.8-1.7 and PR between 0.5-0.8. These aerosol particles have a large influence on AOD but 367
contribute much less to mass of PM10 in comparison to larger particles. 368
3.4 Relationships between columnar and surface particle size parameters: PR-AE.
372
Finally, Figure 8 plots PR versus AE with values of AOD and PM10 represented by a colour 373
scale. For shake of clarity, Figures S5 and S6 (supplementary material) separately show each 374
category of AOD or PM10 and a 3D plot of the PR vs. AE. As can be seen, a very low correlation 375
exists between daily values of both parameters because dark and light blue colours extend 376
everywhere covering all the AE-PR ranges. Green points that represent high turbidity events of 377
moderate-to-high intensity, i.e. AOD in the range (0.2, 0.4) and PM10 in (20, 40 μg m-3), are mainly 378
positioned over the range of fine particles (towards the right-top about PR=0.7 and AE=1.5) but 379
also extend everywhere. Finally red-brown points of very high and extreme turbidity episodes 380
appear defined by two clusters (although with some sparse points) for AOD (Figure 8a) but not for 381
PM10 (Figure 8b). One cluster given by desert dust type (bottom-left) appears in both Figures 8a-b 382
but the cluster representing anthropogenic aerosols (industrial, urban, or biomass burning, right-top) 383
is not well defined for PM10 values in Figure 8b. One possible reason may be that mineral dust 384
particles have a larger density as compared to anthropogenic aerosols for the same AOD value 385
because the former have a larger impact on the mass concentration over the PMx filters. 386
These established correlations are highly site-dependent and this limits its possible application 387
to other areas but they may be useful when there is a lack of PM10 or AOD data over long time 388
periods. Furthermore, we have observed that the non-correspondence between both quantities for 389
yearly data (for example AOD increase with a PM10 decrease) allows the detection of possible 390
problems in the data series. 391
392
3.5. PM10-AOD and PR-AE relationship using binned data. 393
Finally, because of the low correlation in the day-by-day data between the four quantities as 394
described above, in Figure 9 we have examined using binned data fundamental PM10-AOD and PR-395
AE relationships but also the complementary relationships PM10-AE and PR-AOD. In Figure 9a, 396
PM10 is represented as a function of the binned AOD, in the interval 0–1 by steps of 0.05. Each 397
point of the curve corresponds to PM10 average for a given bin of AOD, and the associated standard 398
deviation is represented by vertical bars. As shown, PM10 increases slowly and regularly as the 399
AOD reaches about 0.25, but beyond this value the increasing slope is more irregular until PM10 400
reaches a maximum of about 47 μg m-3
(at AOD~0.55). For AOD > 0.55 there are only few data 401
(see histogram) with irregular increasing or decreasing behaviour of PM10 values, which correspond 402
to exceptionally strong events of high atmospheric turbidity. These highest AOD with the highest 403
intrusions (as the study case of July 2004 described in Cachorro et al., 2008), while other are due to 405
episodes of anthropogenic pollution or biomass burning. 406
In these cases both types of data, PM10 and/or AOD data detect the existence of a strong event 407
but do not always correspond in time. In the case of desert dust outbreaks for example, the 408
maximum of AOD is not always coincident with the maximum of PM10 on a daily basis. This is 409
because of the sedimentation process, as it is the case for the episode of low AOD and high PM10 410
observed in Figure 7a (dark green point corresponding to the month of May). In the case of strong 411
anthropogenic pollution episodes the high AOD is generally accompanied by lower PM10 values as 412
compared with desert dust intrusions. 413
These results are corroborated by Figure 9b, which is analogous to Figure 9a but this time 414
with PR instead of PM10. The slight increase in PM10-AOD observed in the previous graph for low 415
AOD is reflected here in the nearly constant behaviour of PR around 0.6, being practically 416
independent of the AOD. For the last points with AOD higher than 0.5 (a very irregular zone), PR 417
presents minima in the same AOD bins where the maxima are observed for the PM10 and vice versa, 418
indicating a high correlation between bin-averaged data of PR-PM10. This explains the fact that high 419
episodes are well detected by the two data series of PM10 and AOD, but not necessarily with a 420
systematic day-to-day correlation. 421
Figures 9c-d present analogous plots where the same data are binned according to AE values. 422
As expected and observed in Figure 9c, PM10 bin-averaged and associated standard deviation are 423
the highest for the lowest AE values, which correspond to the occurrence of desert dust intrusions. 424
The highest PM10 values decrease sharply until AE=0.6, followed by a nearly stable behaviour for 425
AE values above 0.7. This result for PM10-AE highlights the well-known inverse correlation AOD-426
AE for desert dust episodes. In Figure 9d, PM ratio increases monotonically and smoothly with the 427
increase of AE in all AE ranges, just breaking at both extremes where irregularities occur under 428
desert dust (left) or high-pollution (right) episodes. This figure emphasizes the existence of a low 429
correlation between these two parameters as illustrated also by Figure 8. It is only under very high 430
or extreme episodes with very low or very high AE or PR values, when both quantities present a 431
clear correspondence. 432
433
5. Conclusions
434
In this study long-term data (2003-2014) of two nearby background sites in the North-central 435
Iberian Peninsula were used to analyse the relationship between surface and columnar aerosol loads 436
considering PM10, AOD, AE and PR data, where PM10 and AOD indicate the aerosol load, and AE 437
investigated from a climatological point of view which also provides a general characterization of 439
these key aerosol properties in a regional background environment. 440
This perspective is different of that presented in previous studies, mainly focused on 441
establishing empirical relations between PMx (x=10 µm or 2.5 µm) and AOD in order to estimate 442
or predict PMx, as a parameter that addresses air quality over big cities or large polluted areas. In 443
most of these cases the AOD is provided by satellite sensors, which indeed presents the great 444
advantage of large spatial coverage, but also carries much larger uncertainty as compared to 445
ground-based measurements. Here, the study is carried out over a clean environment where the 446
synergies between surface and columnar aerosol properties are long-term established. 447
The different relationships between these surface-columnar quantities are analysed by means 448
of scatterplots because of their ability to show nonlinear relationships between the different 449
parameters. In this study, not only the correlation between the aerosol load represented by PM10 and 450
AOD is thoroughly analysed, but also their relations with AE and PR. Although there is, to a greater 451
or lesser extent, a physical-theoretical basis to support the existent relationships between them, the 452
complex physical processes and the dependences on other involved factors give rise to 453
consideration of these relations from an empirical point of view. As a consequence, the 454
mathematical expressions sometimes established (e.g., simple linear equation), are not always 455
recommended. 456
Although the encountered correlations are generally low for daily data, they improve 457
considerably for monthly or yearly means, and give very consistent relationships for binned data. 458
As already mentioned these relationships depend on the aerosol characteristics of the site, and 459
because of the clean and background conditions of our study area, they present a short range of 460
AOD and PM10 values compared to other more polluted areas. 461
Despite the limitations mentioned throughout the paper, it is shown that for long-term series 462
the synergy between surface and columnar remotely sensed data can still be quantitatively explored 463
to provide useful information for aerosol characterization and general trends from a climatological 464
point of view. 465
466
Acknowledgements. The authors are grateful to EMEP and MAGRAMA (“Ministerio de 467
Agricultura, Alimentación y Medio Ambiente” of Spain) for providing PMx observations. Special 468
thanks also go to NASA/GSFC, PHOTONS/LOA and RIMA/GOA people for their longstanding 469
collaboration and for operating and maintaining the AERONET network. Thanks to MINECO for 470
the financial support of the FPI grant BES-2012-051868; “Juan de la Cierva - Incorporación” grant 471
the CyL Regional Government (“Consejería de Medio Ambiente, Junta de Castilla y León”) for 473
supporting this research about atmospheric aerosols as well as Consejería de Educación for 474
supporting the project VA100U14. Furthermore, the research leading to these results has received 475
funding from the European Union Seventh Framework Programme (FP7/2007-2013) under grant 476
agreement Nr. 654109 [ACTRIS 2]. 477
478
References
479 480
Barmpadimos, I., Keller, J., Oderbolz, D., Hueglin, C., Prévôt, A.S.H., 2012. One decade of 481
parallel fine (PM2.5) and coarse (PM10–PM2.5) particulate matter measurements in Europe: trends 482
and variability. Atmos. Chem. Phys. 12, 3189–3203. DOI:10.5194/acp-12-3189-2012. 483
Bennouna, Y., Cachorro, V. E., Toledano, C., Berjón, A., Prats, N., Fuertes, D., González R., 484
Rodrigo, R., Torres, B., de Frutos, A., 2011. Comparison of atmospheric aerosol climatologies over 485
southwestern Spain derived from AERONET and MODIS. Remote Sens. Environ. 115, 1272–1284. 486
DOI:10.1016/j.rse.2011.01.011. 487
Bennouna, Y., Cachorro V.E., Torres, B., Toledano, C., Berjón, A., de Frutos, A., Alonso 488
Fernández-Coppel, I., 2013. Atmospheric turbidity and the annual cycle of aerosol optical depth 489
over north-center Spain with ground (AERONET) and satellite (MODIS) remotely sensed data. 490
Atmos. Environ. 67, 352–364. 491
Boucher, O., Randall, D., Artaxo, P., Bretherton, C., Feingold, G., Forster, P., Kerminen, 492
V.M., Kondo, Y., Liao, H., Lohmann, U., Rasch, P., Satheesh, S.K., Sherwood, S., Stevens, B., 493
Zhang, X.Y., 2013. Clouds and Aerosols, In: Climate Change 2013: The Physical Science Basis. 494
Contribution of Working Group I to the Fifth Assessment Report of the Intergovernmental Panel on 495
Climate Change 2013 [Stocker, T.F., Qin, D., Plattner, G.K., Tignor, M., Allen, S.K., Boschung, J., 496
Nauels, A., Xia, Y., Bex, V., Midgley, P.M. (des)]. Cambridge University Press Cambridge, United 497
Kingdom and New York, NY, USA. 498
Brown, J.S., Gordon, T., Price, O., Asgharian, B., 2013. Thoracic and respirable particle 499
definitions for human health risk assessment. Part. Fibre Toxicol. 10, 10–12. DOI:10.1186/1743- 500
8977-10-12. 501
Cachorro, V.E., Tanré, D., 1997. The correlation between particle mass loading and 502
extinction: application to desert dust aerosol content estimation. Remote Sens. Environ. 60, 187– 503
194. 504
Cachorro, V.E., Duran, P., De Frutos, A.M., Vergaz, R., 2000. Measurements of the 505
atmospheric turbidity of the north-center continental area in Spain: spectral aerosol optical thickness 506
and Angstrom turbidity parameters. J. Aerosol. Sci. 31, 687-702. 507
Cachorro, V.E., Toledano, C., Prats N., Sorribas, M., Mogo, S., Berjón, A., Torres, B., 508
Rodrigo, R., de la Rosa, J., De Frutos, A.M., 2008. The strongest desert dust intrusion mixed with 509
smoke over the Iberian Peninsula registered with Sun photometry. J. Geophys. Res. 113, D14S04. 510
DOI:10.1029/2007JD009582. 511
Cachorro, V.E., Burgos, M.A., Bennouna, Y., Toledano, C., Herguedas, A., González Orcajo, 512
J., de Frutos, A.M., 2013. Inventario del Aerosol Desértico en la Región de Castilla y León (2003– 513
2012). In Proceedings Book of the 1st Iberian Meeting Aerosol Science and Technology RICTA 514
2013, Evora, Portugal. Edited by Maria João Costa, Ana Maria Silva, Juan Luis Guerrero Rascado, 515
Sérgio Pereira, Daniele Bortoli and Rui Salgado. (ISBN: 978-989-20-3962-6). Available at 516
http://www.ricta2013.cge.uevora.pt/wp-content/uploads/2013/10/E-ProcBook-RICTA2013.pdf 517
Cachorro, V.E, Burgos, M.A., Bennouna, Y., Toledano, C., Torres, B., Mateos, D., Marcos, 518
A., de Frutos, A.M., 2014. Characterization of PMx data belonging to the desert-dust-inventory 519
the 2st Iberian Meeting Aerosol Science and Technology RICTA 2014, Tarragona, Spain. Edited by 521
Joan Rosell-Llompart, Jordi Grifoll. Available at http://digital.publicacionsurv.cat/index.php/purv/ 522
catalog/book/65. 523
Cusack, M., Alastuey, A., Pérez, N., Pey, J., Querol, X., 2012. Trends of particulate matter 524
(PM2.5) and chemical composition at a regional background site in the Western Mediterranean over 525
the last nine years (2002–2010). Atmos. Chem. Phys. 12, 8341–8357. DOI:10.5194/acp-12-8341-526
2012. 527
Delucchi, M.A., Murphy, J.J., McCubbin, D.R., 2002. The health and visibility cost of air 528
pollution: a comparison of estimation methods. J. Environ. Manage. 64, 139–152. 529
DOI:10.1006/jema.2001.0515. 530
Dubovik, O., Holben, B., Eck, T.F., Smirnov, A., Kaufman, Y.J., King, M.D., Tanré, D., 531
Slutsker, I., 2002. Variability of absorption and optical properties of key aerosol types observed in 532
worldwide locations. J. Atmos. Sci. 59, 590–608. 533
EC. Directive 1999/30/EC of the European Parliament and of the Council (22 April 1999) 534
relating to limit values for sulphur dioxide and oxides of nitrogen, PM and lead in ambient air. 535
Official Journal of the European Communities 1999; L 163: 41–60. 536
EC. Directive 2008/50/EC of the European Parliament and of the Council (21 May 2008) on 537
Ambient Air Quality and Cleaner Air for Europe. Official Journal of the European Communities 538
2008; L 151: 1–44. 539
Eck, T., Holben, B., Reid, J., Dubovik, O., Smirnov, A., O’Neill, N., Slutsker, I., Kinne, S., 540
1999. Wavelength dependence of the optical depth of biomass burning, urban, and desert dust 541
aerosols. J. Geophys. Res. 104, 31333–31349. 542
EMEP. EMEP/CCC-Report 1/95, EMEP Manual for Sampling and Chemical Analysis, rev 543
2002. Norwegian Institute for Air Research 1996; available at: 544
http://www.nilu.no/projects/ccc/manual/index.html (last access: 10 March 2014). 545
EMEP. EMEP/CCC-Report 4/11, EMEP Transboundary Particulate Matter in Europe 546
Status report 2011. Norwegian Institute for Air Research 2011; available at: 547
http://www.nilu.no/projects/ccc/reports/emep4-2011.pdf (last access: 10 March 2014). 548
EMEP. EMEP/CCC-Report 3/2014, Data Report 2012 Acidifying and eutrophying 549
compounds and particulate matter. Norwegian Institute for Air Research 2014; available at: 550
http://www.nilu.no/projects/ccc/reports/cccr3-2014.pdf (last access: 1 October 2015). 551
Escudero, M., Castillo, S., Querol, X., Avila, A., Alarcón, M., Viana, M., Alastuey, A., 552
Cuevas, E., Rodríguez, S., 2005. Wet and dry African dust episodes over eastern Spain. J. Geophys. 553
Res. 110, D18208. DOI:10.1029/2004JD004731. 554
Escudero, M., Querol, X., Ávila, A., Cuevas, E., 2007. Origin of the exceedances of the 555
European daily PM limit value in regional background areas of Spain. Atmos. Environ. 41, 730– 556
744. 557
Estellés, V., Martínez-Lozano, J.A., Pey, J., Sicard, M., Querol, X., Esteve, A.R., Utrillas, 558
M.P., Sorribas, M., Gangoiti, G., Alastuey, A., Rocadenbosch, F., 2012. Study of the correlation 559
between columnar aerosol burden, suspended matter at ground and chemical components in a 560
background European environment. J. Geophys. Res. 117, D04201. DOI:10.1029/2011JD016356. 561
Füssel, H.M., Jol, A., 2012. Climate Change, Impacts and Vulnerability in Europe 2012 an 562
Indicator-based Report. Publications Office of the European Union 2012; Luxembourg. 563
Hess, M., Koepke, P., Schult, I., 1998 Optical properties of aerosols and clouds: the software 564
package OPAC. B. Am. Meteorol. Soc. 79, 831–844. 565
Holben, B.N., Eck, T.F., Slutsker, I., Tanré, D., Buis, J.P., Setzer, A., Vermote, E., Reagan, 566
J.A., Kaufman, Y.J., Nakajima, T., Lavenu, F., Jankowiak, I., Smirnov, A., 1998. AERONET – a 567
federated instrument network and data archive for aerosol characterization. Remote Sens. Environ. 568
Holben, B., Tanré, D., Smirnov, A., Eck, T., Slutsker, I., Abuhassan, N., Newcomb, W., 570
Schafer, J., Chatenet, B., Lavenu, F., Kaufman, Y.J., Vande Castle, J., Setzer, A., Markham, B., 571
Clark, D., Frouin, R., Halthore, R., Karneli, A., O’Neill, N.T., Pietras, C., Pinker, R.T., Voss, K., 572
Zibordi, G., 2001. An emerging ground-based aerosol climatology: aerosol optical depth from 573
AERONET. J. Geophys. Res. 106, 12067–12097. 574
Kacenelenbogen, M,, Léon, J.F., Chiapello, I., Tanré, D., 2006 Characterization of aerosol 575
pollution events in France using ground-based and POLDER-2 satellite data. Atmos. Chem. Phys. 576
6, 4843 – 4849. 577
Kaskaoutis, D.G., Badarinath, K.V.S., Kharol, S.K., Sharma, A.R., Kambezidis, H.D., 2009. 578
Variations in the Aerosol optical properties and Types over the tropical urban site of Hyderabad, 579
India. J. Geophys., Res. 114, D22204, DOI: 10.1029/2009JD012423. 580
Kim, D.H., Sohn, B.J., Nakajima, T., Takamura, T., Choi, B.C., Yoon, S.C., 2004. Aerosol 581
optical properties over east Asia determined from ground-based sky radiation measurements. J. 582
Geophys. Res. 109, D02209. DOI:10.1029/2003JD003387. 583
Kokhanovsky, A.A., Prikhach, A.S., Katsev, I.L., Zege, E.P.n 2009. Determination of 584
particulate matter vertical columns using satellite observations. Atmos. Meas. Tech. 2, 327–335. 585
DOI:10.5194/amt-2-327-2009. 586
Kumar, K.R., Sivakumar, V., Reddy, R.R., Gopal, K.R., Adesina, A.J., 2014. Identification 587
and classification of different aerosol types over a subtropical rural site in Mpumalanka, South 588
Africa: Seasonal variations retrieved from the AERONET sunphotometer. Aerosol Air Qual. Res. 589
14, 108-123. 590
Mateos, D., Sanchez-Lorenzo, A., Antón, M., Cachorro, V.E., Calbó, J., Costa, M.J., Torres, 591
B., Wild, M., 2014. Quantifying the respective roles of aerosols and clouds in the strong brightening 592
since the early 2000s over the Iberian Peninsula. J. Geophys. Res. (Atmos) 119, 10382–10393. 593
DOI:10.1002/2014JD022076. 594
Mateos, D., Cachorro, V.E., Toledano, C., Burgos, M.A., Bennouna, Y., Torres, B., Fuertes, 595
D., González, R., Guirado, C., Calle, A., de Frutos, A.M., 2015. Columnar and surface aerosol load 596
over the Iberian Peninsula establishing annual cycles, trends, and relationships in five geographical 597
sectors. Sci. Total Environ. 518-519, 378-392. DOI:10.1016/j.scitotenv.2015.03.002. 598
Pey, J., Querol, X., Alastuey, A., Forastiere, F., Stafoggia, M., 2013. African dust outbreaks 599
over the Mediterranean Basin during 2001–2011: PM10 concentrations, phenomenology and trends, 600
and its relation with synoptic and mesoscale meteorology. Atmos. Chem. Phys. 13, 1395–1410, 601
DOI:10.5194/acp-13-1395-2013. 602
Pope III, C.A., 2000. Review: epidemiological basis for particulate air pollution health 603
standards. Aerosol Sci. Tech. 32, 4–14. 604
Pope III, C.A., Dockeri, D.W., 2006. Health effects of fine particulate air pollution: lines that 605
connect. J. Air & Waste Manage. Assoc. 56, 709-742. 606
Pelletier, B., Santer, R., Vidot, J., 2007. Retrieving of particulate matter from optical 607
measurements: A semiparametric approach. J. Geophys. Res. 112, D06208. DOI: 608
10.1029/2005JD006737. 609
Querol X, Pey J, Pandolfi M, Alastuey A, Cusack M, Pérez N, Moreno T, Viana M, 610
Mihalopoulos N, Kallos G, Kleanthous S. African dust contributions to mean ambient PM10 mass-611
levels across the Mediterranean Basin. Atmos Environ 2009; 43 : 4266–4277. 612
Querol X, et al. 2001-2012 trends on air quality in Spain. Sci Tot Env 2014; 490: 957-969. 613
Rodríguez S, Querol X, Alastuey A, Kallos G, Kakaliagou O. Saharan dust contributions to 614
PM10 and TSP levels in southern and eastern Spain. Atmos Environ 2001; 35: 2433–2447. 615
Rohen, G.J., von Hoyningen-Huene, W., Kokhanovsky, A., Dinter, T., Vountas, M., Burrows, 616
J.P., 2011. Retrieval of aerosol mass load (PM10) from MERIS/Envisat top of atmosphere spectral 617
Smirnov, A., Holben, B.N., Eck, T.F., Dubovik, O., Slutsker, I., 2000. Cloud-screening and 619
quality control algorithms for the AERONET database. Remote Sens. Environ. 73, 337–349. 620
Toledano, C., Cachorro, V.E., Berjón, A., De Frutos, A., Sorribas, M., De la Morena B., 621
Goloub, P., 2007a. Aerosol optical depth and Ångström exponent climatology at El Arenosillo 622
AERONET site (Huelva, Spain). Q. J. Roy. Meteor. Soc. 133, 795–807. 623
Toledano, C., Cachorro, V.E., De Frutos, A., Sorribas, M., Prats, N., De la Morena, B., 2007b. 624
Inventory of African desert dust events over the southwestern Iberian Peninsula in 2000–2005 with 625
an AERONET Cimel Sun photometer. J. Geophys. Res. 112, D21201. 626
DOI:10.1029/2006JD008307. 627
Toledano. C., Cachorro, V.E., de Frutos, A.M., Torres, B., Berjón, A., Sorribas, M., Stone, 628
R.S., 2009. Airmass classification and analysis of aerosol types at El Arenosillo (Spain). J. Appl. 629
Meteorol. Clim. 48, 962–981. DOI:10.1175/2008JAMC2006.1. 630
Toledano, C., Bennouna, Y., Cachorro, V., Ortiz de Galisteo, P., Stohl, A., Stebel, K., 631
Kristiansen, N.I., Olmo. F.J., Lyamani, H., Obregón, M.A., Estelles, V., Wagner, F., Baldasano, 632
J.M., González-Castanedo, Y., Clarisse, L., de Frutos, A., 2012. Aerosol properties of the 633
Eyjafjallajökull ash derived from Sun photometer and satellite observations over the Iberian 634
Peninsula. Atmos. Environ. 48, 22-32. 635
Tørseth, K., Aas, W., Breivik, K., Fjæraa, A.M., Fiebig, M., Hjellbrekke, A.G., Lund Myhre, 636
C., Solberg, S., Yttri, K.E., 2012. Introduction to the European Monitoring and Evaluation 637
Programme (EMEP) and observed atmospheric composition change during 1972–2009. Atmos. 638
Chem. Phys. 12, 5447–5481. DOI:10.5194/acp-12-5447-2012. 639
Vergaz, R., Cachorro, V.E., De Frutos, A.M., Vilaplana, J.M., De La Morena, B.A., 2005. 640
Columnar characteristics of aerosols by spectroradiometer measurements in the maritime area of the 641
Cadiz Gulf (Spain). Int. J. Climatol. 25, 1781–1804. 642
WHO. Air Quality Guidelines: Global Update 2005: Particulate Matter, Ozone, Nitrogen 643
Dioxide and Sulphur Dioxide. World Health Organization 2006. WHO Regional Office for Europe. 644
ISBN 9289021926. 645
Tables
654 655 656
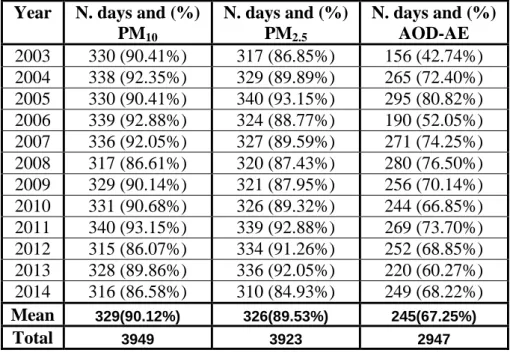
Table 1. Yearly statistics of EMEP PM10, PM 2.5, and AERONET AOD data counts in the region of 657
study for the period 2003-2014. 658
659
Year N. days and (%) PM10
N. days and (%) PM2.5
N. days and (%) AOD-AE
2003 330 (90.41%) 317 (86.85%) 156 (42.74%) 2004 338 (92.35%) 329 (89.89%) 265 (72.40%) 2005 330 (90.41%) 340 (93.15%) 295 (80.82%) 2006 339 (92.88%) 324 (88.77%) 190 (52.05%) 2007 336 (92.05%) 327 (89.59%) 271 (74.25%) 2008 317 (86.61%) 320 (87.43%) 280 (76.50%) 2009 329 (90.14%) 321 (87.95%) 256 (70.14%) 2010 331 (90.68%) 326 (89.32%) 244 (66.85%) 2011 340 (93.15%) 339 (92.88%) 269 (73.70%) 2012 315 (86.07%) 334 (91.26%) 252 (68.85%) 2013 328 (89.86%) 336 (92.05%) 220 (60.27%) 2014 316 (86.58%) 310 (84.93%) 249 (68.22%)
Mean 329(90.12%) 326(89.53%) 245(67.25%)
Total 3949 3923 2947
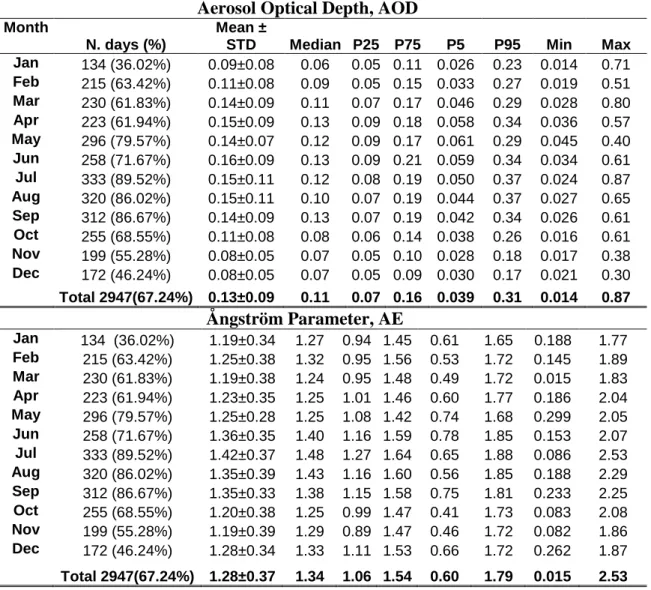
Table 2. Monthly statistics of the AOD(440 nm) and AE parameters for the period 2003-2014 based 686
on daily values, with the number of days (with percentage in parentheses), mean, median, 687
percentiles (P25, P75, P5, P95), minimum (Min) and maximum (Max) values. 688
689
Aerosol Optical Depth, AOD
690
Month
N. days (%)
Mean ±
STD Median P25 P75 P5 P95 Min Max
Jan 134 (36.02%) 0.09±0.08 0.06 0.05 0.11 0.026 0.23 0.014 0.71
Feb 215 (63.42%) 0.11±0.08 0.09 0.05 0.15 0.033 0.27 0.019 0.51
Mar 230 (61.83%) 0.14±0.09 0.11 0.07 0.17 0.046 0.29 0.028 0.80
Apr 223 (61.94%) 0.15±0.09 0.13 0.09 0.18 0.058 0.34 0.036 0.57
May 296 (79.57%) 0.14±0.07 0.12 0.09 0.17 0.061 0.29 0.045 0.40
Jun 258 (71.67%) 0.16±0.09 0.13 0.09 0.21 0.059 0.34 0.034 0.61
Jul 333 (89.52%) 0.15±0.11 0.12 0.08 0.19 0.050 0.37 0.024 0.87
Aug 320 (86.02%) 0.15±0.11 0.10 0.07 0.19 0.044 0.37 0.027 0.65
Sep 312 (86.67%) 0.14±0.09 0.13 0.07 0.19 0.042 0.34 0.026 0.61
Oct 255 (68.55%) 0.11±0.08 0.08 0.06 0.14 0.038 0.26 0.016 0.61
Nov 199 (55.28%) 0.08±0.05 0.07 0.05 0.10 0.028 0.18 0.017 0.38
Dec 172 (46.24%) 0.08±0.05 0.07 0.05 0.09 0.030 0.17 0.021 0.30
Total 2947(67.24%) 0.13±0.09 0.11 0.07 0.16 0.039 0.31 0.014 0.87
Ångström Parameter, AE
691
Jan 134 (36.02%) 1.19±0.34 1.27 0.94 1.45 0.61 1.65 0 0.188 1.77
Feb 215 (63.42%) 1.25±0.38 1.32 0.95 1.56 0.53 1.72 0.145 1.89
Mar 230 (61.83%) 1.19±0.38 1.24 0.95 1.48 0.49 1.72 0.015 1.83
Apr 223 (61.94%) 1.23±0.35 1.25 1.01 1.46 0.60 1.77 0.186 2.04
May 296 (79.57%) 1.25±0.28 1.25 1.08 1.42 0.74 1.68 0.299 2.05
Jun 258 (71.67%) 1.36±0.35 1.40 1.16 1.59 0.78 1.85 0.153 2.07
Jul 333 (89.52%) 1.42±0.37 1.48 1.27 1.64 0.65 1.88 0.086 2.53
Aug 320 (86.02%) 1.35±0.39 1.43 1.16 1.60 0.56 1.85 0.188 2.29
Sep 312 (86.67%) 1.35±0.33 1.38 1.15 1.58 0.75 1.81 0.233 2.25
Oct 255 (68.55%) 1.20±0.38 1.25 0.99 1.47 0.41 1.73 0.083 2.08
Nov 199 (55.28%) 1.19±0.39 1.29 0.89 1.47 0.46 1.72 0.082 1.86
Dec 172 (46.24%) 1.28±0.34 1.33 1.11 1.53 0.66 1.72 0.262 1.87
Total 2947(67.24%) 1.28±0.37 1.34 1.06 1.54 0.60 1.79 0.015 2.53
692 693 694
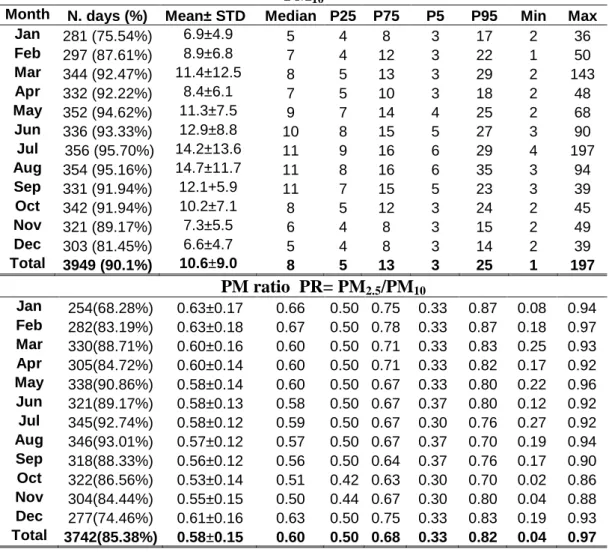
Table 3. Monthly statistics of the PM10 and PM ratio for the period 2003-2014 based on daily 705
values, with the number of days (with percentage in parentheses), mean, median, percentiles (P25, 706
P75, P5, P95), minimum (Min) and maximum (Max) values. 707
PM10
708
Month N. days (%) Mean± STD Median P25 P75 P5 P95 Min Max
Jan 281 (75.54%) 6.9±4.9 5 4 8 3 17 2 36
Feb 297 (87.61%) 8.9±6.8 7 4 12 3 22 1 50
Mar 344 (92.47%) 11.4±12.5 8 5 13 3 29 2 143
Apr 332 (92.22%) 8.4±6.1 7 5 10 3 18 2 48
May 352 (94.62%) 11.3±7.5 9 7 14 4 25 2 68
Jun 336 (93.33%) 12.9±8.8 10 8 15 5 27 3 90
Jul 356 (95.70%) 14.2±13.6 11 9 16 6 29 4 197
Aug 354 (95.16%) 14.7±11.7 11 8 16 6 35 3 94
Sep 331 (91.94%) 12.1+5.9 11 7 15 5 23 3 39
Oct 342 (91.94%) 10.2±7.1 8 5 12 3 24 2 45
Nov 321 (89.17%) 7.3±5.5 6 4 8 3 15 2 49
Dec 303 (81.45%) 6.6±4.7 5 4 8 3 14 2 39
Total 3949 (90.1%) 10.6±9.0 8 5 13 3 25 1 197
PM ratio PR= PM2.5/PM10
709
Jan 254(68.28%) 0.63±0.17 0.66 0.50 0.75 0.33 0.87 0.08 0.94
Feb 282(83.19%) 0.63±0.18 0.67 0.50 0.78 0.33 0.87 0.18 0.97
Mar 330(88.71%) 0.60±0.16 0.60 0.50 0.71 0.33 0.83 0.25 0.93
Apr 305(84.72%) 0.60±0.14 0.60 0.50 0.71 0.33 0.82 0.17 0.92
May 338(90.86%) 0.58±0.14 0.60 0.50 0.67 0.33 0.80 0.22 0.96
Jun 321(89.17%) 0.58±0.13 0.58 0.50 0.67 0.37 0.80 0.12 0.92
Jul 345(92.74%) 0.58±0.12 0.59 0.50 0.67 0.30 0.76 0.27 0.92
Aug 346(93.01%) 0.57±0.12 0.57 0.50 0.67 0.37 0.70 0.19 0.94
Sep 318(88.33%) 0.56±0.12 0.56 0.50 0.64 0.37 0.76 0.17 0.90
Oct 322(86.56%) 0.53±0.14 0.51 0.42 0.63 0.30 0.70 0.02 0.86
Nov 304(84.44%) 0.55±0.15 0.50 0.44 0.67 0.30 0.80 0.04 0.88
Dec 277(74.46%) 0.61±0.16 0.63 0.50 0.75 0.33 0.83 0.19 0.93
Total 3742(85.38%) 0.58±0.15 0.60 0.50 0.68 0.33 0.82 0.04 0.97
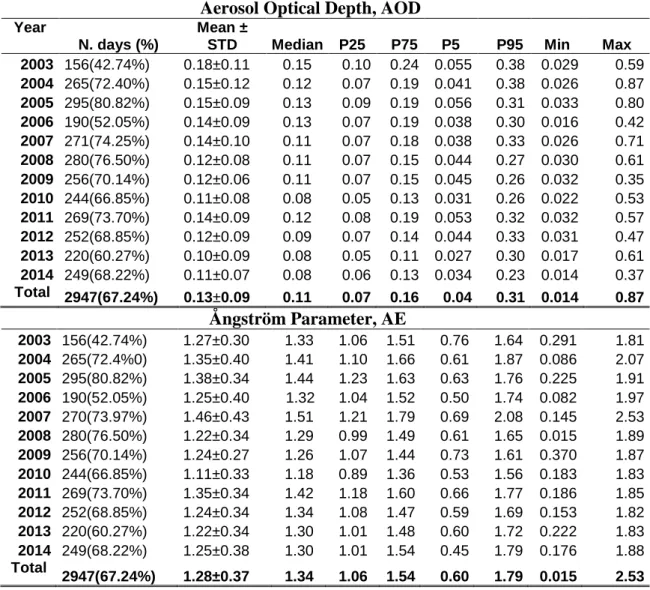
Table 4. Yearly statistics of the AOD(440 nm) and AE parameters for the period 2003-2014 based 729
on daily values, with the number of days (with percentage in parentheses), mean, median, 730
percentiles (P25, P75, P5, P95), minimum (Min) and maximum (Max) values. 731
732
Aerosol Optical Depth, AOD
733
Year
N. days (%)
Mean ±
STD Median P25 P75 P5 P95 Min Max
2003 156(42.74%) 0.18±0.11 0.15 0.10 0.24 0.055 0.38 0.029 0.59
2004 265(72.40%) 0.15±0.12 0.12 0.07 0.19 0.041 0.38 0.026 0.87
2005 295(80.82%) 0.15±0.09 0.13 0.09 0.19 0.056 0.31 0.033 0.80
2006 190(52.05%) 0.14±0.09 0.13 0.07 0.19 0.038 0.30 0.016 0.42
2007 271(74.25%) 0.14±0.10 0.11 0.07 0.18 0.038 0.33 0.026 0.71
2008 280(76.50%) 0.12±0.08 0.11 0.07 0.15 0.044 0.27 0.030 0.61
2009 256(70.14%) 0.12±0.06 0.11 0.07 0.15 0.045 0.26 0.032 0.35
2010 244(66.85%) 0.11±0.08 0.08 0.05 0.13 0.031 0.26 0.022 0.53
2011 269(73.70%) 0.14±0.09 0.12 0.08 0.19 0.053 0.32 0.032 0.57
2012 252(68.85%) 0.12±0.09 0.09 0.07 0.14 0.044 0.33 0.031 0.47
2013 220(60.27%) 0.10±0.09 0.08 0.05 0.11 0.027 0.30 0.017 0.61
2014 249(68.22%) 0.11±0.07 0.08 0.06 0.13 0.034 0.23 0.014 0.37
Total 2947(67.24%) 0.13±0.09 0.11 0.07 0.16 0.04 0.31 0.014 0.87 Ångström Parameter, AE
734
2003 156(42.74%) 1.27±0.30 1.33 1.06 1.51 0.76 1.64 0.291 1.81
2004 265(72.4%0) 1.35±0.40 1.41 1.10 1.66 0.61 1.87 0.086 2.07
2005 295(80.82%) 1.38±0.34 1.44 1.23 1.63 0.63 1.76 0.225 1.91
2006 190(52.05%) 1.25±0.40 1.32 1.04 1.52 0.50 1.74 0.082 1.97
2007 270(73.97%) 1.46±0.43 1.51 1.21 1.79 0.69 2.08 0.145 2.53
2008 280(76.50%) 1.22±0.34 1.29 0.99 1.49 0.61 1.65 0.015 1.89
2009 256(70.14%) 1.24±0.27 1.26 1.07 1.44 0.73 1.61 0.370 1.87
2010 244(66.85%) 1.11±0.33 1.18 0.89 1.36 0.53 1.56 0.183 1.83
2011 269(73.70%) 1.35±0.34 1.42 1.18 1.60 0.66 1.77 0.186 1.85
2012 252(68.85%) 1.24±0.34 1.34 1.08 1.47 0.59 1.69 0.153 1.82
2013 220(60.27%) 1.22±0.34 1.30 1.01 1.48 0.60 1.72 0.222 1.83
2014 249(68.22%) 1.25±0.38 1.30 1.01 1.54 0.45 1.79 0.176 1.88
Total
2947(67.24%) 1.28±0.37 1.34 1.06 1.54 0.60 1.79 0.015 2.53