PERMANYER
ORIGINAL ARTICLE Rev Invest Clin. 2019;71:195-203
Evaluation of the Royal Free
Hospital Cirrhosis Glomerular
Filtration Rate Formula in Hispanic
Patients with Cirrhosis:
An External Validation
Javier Tejeda-Maldonado
1, José A. Niño-Cruz
1, Cristino Cruz-Rivera
1, Aldo Torre
2and Jonathan Aguirre-Valadez
2*
Departments of 1Nephrology and Mineral Metabolism and 2Gastroenterology, Instituto Nacional de Ciencias Médicas y Nutrición Salvador Zubirán, Mexico City, Mexico.
Received for publication: 13-09-2018 Approved for publication: 11-12-2018 DOI: 10.24875/RIC.18002795
ABSTRACT
Background and Aims: Glomerular filtration rate (GFR) measurement in patients with liver cirrhosis (LC) is the ideal method for adequate evaluation of kidney function. However, it is invasive, costly, and not widely accessible. Moreover, GFR estimation in patients with cirrhosis has been inaccurate. The aim of the present study was to evaluate and validate the recently described Royal Free Hospital (RFH) formula in a Hispanic cohort of patients with LC and compare it with other formulas, including the CKD-EPI cystatin C equation. Methods: GFR was measured through the renal clearance of Tc-99m DTPA; it was cross-sectionally evaluated and compared with GFRs that were estimated utilizing the following formulas: RFH, Cockcroft-Gault, 6-variable Modification of Diet in Renal Disease-6, CKD-EPI cystatin C, CKD-EPI Creatinine, and CKD-EPI Cystatin C-Creatinine. Results: We included 76 patients (53% women). The mean measured GFR in the entire cohort was 64 ml/min/1.73m2; 54% of the patients had a GFR < 60 ml/min/1.73 m2 at the time of evaluation. The RFH formula and
the CKD-EPI cystatin C formula showed the best performance, with a p30 of 62% and 59%, respectively. All formulas per-formed poorly when GFR was < 60 ml/min/1.73 m2. Conclusions: The RFH formula showed a better performance than the
other formulas based on serum creatinine in a Hispanic population with LC. There was no difference in performance between the RFH formula and the CKD-EPI cystatin C formula. (REV INVEST CLIN. 2019;71:195-203)
Key words: Cirrhosis. Glomerular filtration rate. Creatinine. Cystatin C.
Corresponding author: *Jonathan Aguirre-Valadez Department of Gastroenterology Instituto Nacional de Ciencias Médicas y Nutrición Salvador Zubirán
Col. Belisario Domínguez Sección XVI, Del. Tlalpan C.P. 14080, Mexico City, México
INTRODUCTION
Kidney dysfunction is a risk factor for morbidity and mortality in patients with liver cirrhosis (LC)1. The
importance of kidney function in the prognosis of patients with LC was established with its inclusion in the model for end-stage liver disease (MELD), which is currently utilized to determine the inclusion and prioritization of patients on a transplantation waiting list2.
Kidney function in the patient with LC is difficult to establish, given that the glomerular filtration rate (GFR) is largely estimated with the use of formulas based on serum creatinine (SCr). Those formulas overestimate kidney function because the LC popula-tion has a high frequency of low creatinine levels due to conditions that do not depend on kidney function, such as malnutrition, edema (hemodilution), muscle atrophy, hyperbilirubinemia, and protein-restrictive diets3,4. Several studies have evaluated formulas
based on cystatin C for estimating the GFR in patients with LC. The advantages of using cystatin C, a non-glycosylated protein produced in all nucleated cells, lies in the fact that it has a better theoretic profile than creatinine because it is not significantly modified by factors such as poor muscle mass, malnutrition, or hyperbilirubinemia. Its performance, when compared with creatinine-based estimates, has been better and more accurate in different populations. Although the cystatin C-based formulas have shown a superior per-formance and accuracy than the SCr-based formulas in the LC population, their performance has been poor in subjects with kidney function < 45 ml/min/1.73 m2.3-5 Other groups have evaluated formulas that use
both biomarkers (SCr and cystatin C), finding their results to be better than those of the formulas based only on creatinine or on cystatin C. However, perfor-mance in subjects with LC and a measurement of GFR (mGFR) < 60 ml/min was poor, agreeing with previ-ously reported results6,7.
Recently, a group of researchers at the Royal Free Hospital (RFH) in England developed and validated a new formula for estimating GFR in patients with cir-rhosis of the liver8, which was also validated by a
group from Denmark9. The novelty of this formula lies
in that, apart from being created in a population with LC, it includes the variables of ascites, INR, and serum sodium, in addition to those of creatinine, age, and
sex. Its results showed good performance, higher ac-curacy, and less bias, compared with other estimation formulas based on creatinine and/or cystatin C.
Due to the scarcity of methods for estimating kidney function in subjects with LC, the aim of this study was to conduct an external validation of the RFH formula in a cohort of Hispanic patients with LC and compare its performance with formulas based on creatinine and cystatin C.
METHODS
Patients
The study is a retrospective and cross-sectional anal-ysis that includes a cohort of Hispanic subjects with LC who participated in a previous study, conducted at an academic medical center in Mexico City4. The
study was designed in compliance with the Declara-tion of Helsinki and submitted to and approved by the Ethics Committee of the Instituto Nacional de Cien-cias Médicas y Nutrición Salvador Zubirán, in Mexico City. All the patients signed written statements of informed consent. The inclusion criteria were: (1) age above 18 years; (2) diagnosis of LC made by a hepa-tologist and according to biochemical, endoscopic, imaging, and histologic assessment; (3) stable SCr (values maintained with a variation under 0.3 mg/dl over a 3-month period); and (4) subjects should have had the required measurements for estimating GFR with the new formula. The exclusion criteria were: pregnancy, hyperthyroidism, active hepatocellular carcinoma, end-stage renal disease or dialysis, inabil-ity to adequately measure glomerular filtration due to technical problems, and lack of informed consent.
was recorded within 1 month before or after the evaluation. MELD and Child-Pugh scores were calcu-lated for all patients.
GFR determination
mGFR determination with Tc-99m DTPA
The administration of Tc-99m DTPA was initiated af-ter a period of hydration (10-20 mL/kg) with a bolus of 150 µCi and a subsequent continuous infusion of 300 µCi for 240 minutes (75 µCi/h). After a 60-min period of distribution, urine and blood samples were obtained every half-hour for four periods (when cal-culating the GFR, only the past three periods, at 120, 150, and 180 minutes, were considered). Samples were analyzed in duplicate in a gamma counter (Packard® COBRA II, USA) and the activity of 1 mL of each vial was registered for 1 min (counts/ml/ min). Urine samples were obtained through sponta-neous voiding, and blood samples were collected by venipuncture in the arm contralateral to the infusion. Clearance was calculated with the following formula: U×V/P [(P1+P2+P3)/3], where U = counts in 1 ml of urine, V = urinary volume per minute (ml/min), and P1, P2, and P3 = counts in plasma at 120, 150, and 180 minutes. The GFR was adjusted to a total-body surface area of 1.73 m2.
Determination of estimated GFR (eGFR)
SCr measurement was standardized in accordance with international guidelines10 (the Jaffe kinetic
method, also known as alkaline picrate, Syncron Sys-tem, Beckman Coulter, Ireland). Cystatin C was mea-sured by ELISA and was also standardized according to the international guidelines11. GFR estimation
for-mulas were calculated with the variables and recom-mendations applicable to each (Cockcroft-Gault [CG], 6-variable Modification of Diet in Renal Disease for-mula [MDRD-6], CKD-EPI Creatinine [CKD-EPI Cr], CKD-EPI cystatin C [CKD-EPI CystC]10, and CKD-EPI
cystatin C-Creatinine [CKD-EPI CystC-Cr])12.
GFR was estimated with the RFH formula established by Kalafateli et al.:8 eGFR=45.9×(creatinine−0.836[µm
olL])×(urea−0.229[mmolL])×INR−0.113×(age−0.129[years
])×(sodium0.972[mmolL])×1.236(if male)×0.92(if
mod-erate/severe ascites).
Statistical analysis
Results were expressed according to the type of vari-able, and the results are presented in measures of central tendency (mean and median) and their re-spective measures of dispersion (standard deviation and interquartile intervals [IQR 25-75]). The differ-ences between means and medians were evaluated using Student’s t-test for related samples and the Wilcoxon singed-rank test for the non-parametric variables. Following the 2002 K/DOQI13 clinical
prac-tice guidelines for the performance validation of for-mulas estimating GFR, we used the following statisti-cal method:
a. Bias = mGFR - eGFR
b. Bias (%) = (Measured GFR – estimated GFR) ÷ measured GFR
c. Accuracy p (30) = Percentage of estimated GFR close to 30% of the measured GFR
d. Precision = Amplitude of the interquartile interval (IQI)
Subgroups were analyzed to evaluate the formulas’ performance between different mGFR groups (<60 ml/min/1.73 m2), the presence of ascites, and the
Child-Pugh stage. Results for continuous variables were analyzed by one-way variance analysis and 95% confidence intervals (95% CI). The Bonferroni method was used for between-group comparisons. For cate-gorical variables, the Chi-square test was applied. p value < 0.05 was considered significant. The SPSS version 21 statistical package and Microsoft Excel 2013 were used for data analysis.
RESULTS
levels of SCr and cystatin C were 0.72 mg/dl (0.59-0.9) and 1.23 mg/l (0.93-1.59), respectively. The rest of the variables is shown in Table 1.
The mean GFR of the cohort by Tc-99m DTPA was 64 ml/min/1.73 m2. More than half of the patients
(54%) had a GFR < 60 ml/min/1.73 m2 at the time
of the evaluation, and 34% of the patients had a GFR < 45 ml/min/1.73 m2. Patients with ascites had a
mean mGFR of 43.45 ± 22.95 ml/min/1.73 m2,
com-pared with mGFR of 72.48 ± 29.42 ml/min/1.73 m2
in patients with no ascites (p < 0.000).
There was a significant difference between the means of the eGFRs obtained through the classic formulas
based on SCr (CG, MDRD-6, CKD-EPI Cr, and CKD-EPI CystC-Cr), compared with the GFR measured using Tc-99m DTPA. The RFH formula and the CKD-EPI CystC formula showed no significant differences when compared with the mGFR (measured through Tc-99m DTPA clearance). However, when only patients with a mGFR <60 ml/min/1.73m2 were analyzed, all the
for-mulas overestimated kidney function, with a statisti-cally significant difference when compared with the gold standard (Table 2).
Formula performance
with respect to subgroups
Overall, the RFH formula and the CKD-EPI CystC for-mula had the best performance for accuracy, p30: 62% and 59%, respectively, and best bias, −0.22 ± 26.96 ml/min/1.73 m2 and −1.71 ± 24 ml/min/1.73
m2, respectively (p>0.05). The rest of the formulas
showed statistically significant differences when com-pared with the measured filtration (Tc-99m) (Table 2). The RFH and the CKD-EPI CystC formulas showed the best performance for the subgroups of sex, grade of advanced liver damage, and decreased kidney func-tion (GFR <60 ml/min/1.73 m2, p30: 46 and 54%,
and bias −15.49 ± 25.21 and −11.12 ± 16.01).
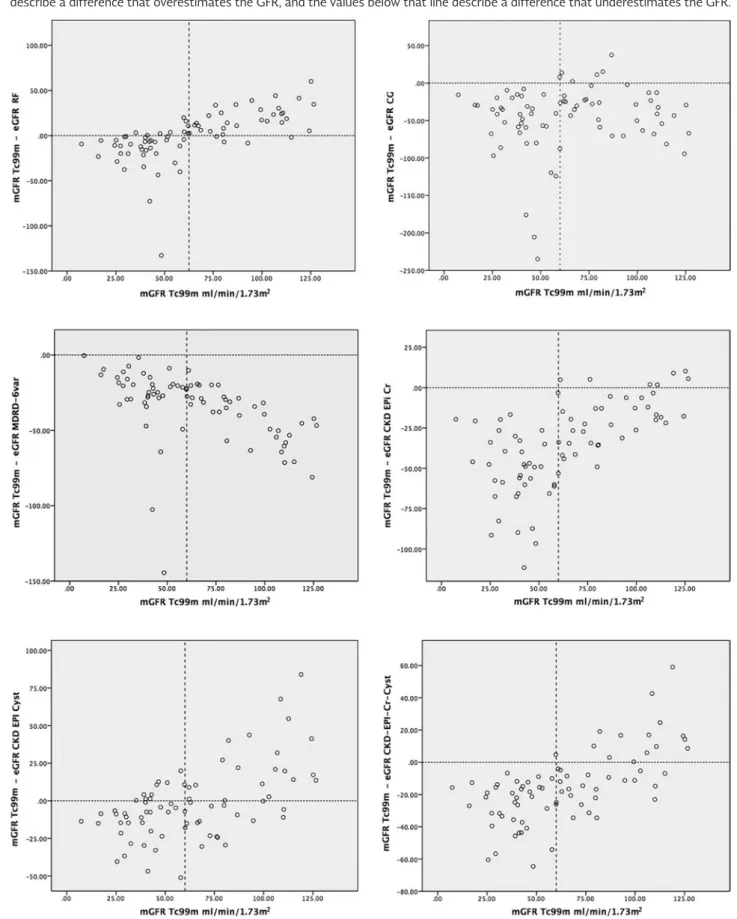
Bland-Altman plots describe the changes in “bias” ac-cording to the measurement with Tc-99 m DTPA. The overestimation of the different formulas increased with the decrease in measured filtration in all the formulas, but to a lesser degree with the RFH, CKD-EPI CystC, and CKD-CKD-EPI CystC-Cr formulas (Fig. 1). Creatinine-dependent formulas (except RFH formula) overestimated kidney function, even in patients with adequate kidney function (>60 ml/min/1.73 m2). On
the other hand, the RFH and CKD-EPI CystC formulas performed similarly, although both tended to under-estimate glomerular filtration when it was >60 ml/ min/1.73 m2 and to overestimate filtration when
kid-ney function was under 60 ml/min/1.73 m2.
Classification according
to the different GFR estimates
According to the GFR through Tc-99m DTPA, 54% of the subjects had GFR < 60 ml/min/1.73m2. The GFR
was >90ml/min in 22%, 60-90 ml/min in 24%, 30-59 ml/min in 41%, 15-29 ml/min in 12%, and in 1% it was <15 ml/min/1.73 m2. According to the RFH and Table 1. General characteristics of patients
Variables (n = 76) Mean (±SD) n (%)
Women 40 (53)
Age (years) 51 (±9)
Etiology
Alcoholism 6 (7.9)
HBV 2 (2.6)
HCV 28 (36.8)
AIH 13 (17.1)
PBC 8 (10.5)
NASH 5 (6.6)
Cryptogenic liver disease 10 (13.2)
Others 4 (5.3)
Patients with ascites 23 (30.3) Child-Pugh
A 22 (28.9)
B 35 (46.1)
C 19 (25)
Child-Pugh score 8 (±9)
MELD score 13 (±4)
Serum creatinine mg/dl 0.72 (0.59-0.9) Cystatin C mg/l 1.23 (0.93-1.59) Sodium mEq/l 134 (131-137)
Urea mg/dl 34 (27-49)
Serum albumin g/dl 3.1 (2.7-3.5)
Table 2. Performance of the Royal Free Hospital, Cockcroft-Gault, MDRD-6, CKD-EPI Cr, CKD-EPI CystC, and CKD-EPI CystC-Cr equations, stratified by the level of liver failure (Child-Pugh B and C), and the level of measured GFR (≥ 60 or < 60 ml/min/1.73 m2)
Equations Tc-99m Royal Free
Hospital Cystatin CCKD-EPI MDRD-6 creatinineCKD-EPI Cockcroft-Gault CystC-CrCKD-EPI
All the patients (n=76)
GFR
ml/min/1.73 m2 63.69 ± 30.57 63.92 ± 25.64 65.40 ± 25.90 97.98 ± 47.47* 99.13 ± 25.31* 109.62 ± 51.76* (23.50)*79.10
p30 (%) 62 59 12 33 25 49
Bias Mean±SD ml/min/1.73 m2
−0.22 ±
26.96 −1.71 ± 24 −34.06 ± 22.89a
−35.43 ± 26.53a
−45.92 ± 44.62a
−15.41 ± 21.6a
% Bias Mean±SD ml/min/1.73 m2
−15.6 ±
54 −16.49 ± 46.52 −57.77 ± 43a
−122.7 ± 109a
−97 ± 105.22a
−44.1 ± 55.84a
GFR < 60 ml/min (n=41)
GFR
ml/min/1.73 m2
40.17 ±
13.05 55.65 ± 28* 51.29 ± 18.41* 83.14 ± 52.3* 90.22 ± 28.34* 96.95 ± 56.43* 66.21 ± 19.21)*
p30 (%) 46 54 12 5 12 22
Bias Mean ±SD ml/min/1.73m2
−15.49 ±
25.21 −11.12 ± 16.01 -27.48 ± 25.54a −50.05 ± 25.11a −56.78 ± 52.6a 26.05 ± 15.88a
% Bias Mean ±SD ml/min/1.73m2
−44.63 ±
59.55 −36.73 ± 49.65 −68.73 ± 55.49 −199 ± 88.65a 117.94−149 ± a −76.32 ± 55.57a
Child-Pugh B and C (N=54)
GFR
ml/min/1.73m2 57.62 ± 29.08 28.4563 ± 58.85 ± 23.17 95.51 ± 52.57* 99.64 ± 24.87* 111.91 ± 56.65* 74.40 ± 29.08)*
p30 (%) 63 59 13 20 11 41
Bias Mean ±SD ml/min/1.73m2
−0.22 ±
26.96 −1.23 ± 25 −32.5 ± 25.22a −40.6 ± 25.45a −54.29 ± 47.74a −16.78 ± 21.86a
% Bias Mean ±SD ml/min/1.73m2
−15.58 ±
55 −17.54 ± 48.41 −60 ± 49 −143.4 ± 106.5a −117.7 ± 110.22a −49.93 ± 56.15a
Ascites (n=23)
GFR
ml/min/1.73m2 43 ± 23 22.0451 ± 50.48 ± 21.76 79.16 ± 44.02* 90.7 ± 30.48* 96.89 ± 57.06* 65.3 ± 20.71*
p30 (%) 48 52 17 9 4 22
Bias Mean ±SD ml/min/1.73m2
−7.58 ±
22.73 −7.03 ± 22.2 −28.16 ± 22.87a −47.24 ± 28.66a −53.44 ± 52.62a −21.85 ± 19.7a
% Bias Mean ±SD ml/min/1.73m2
−32.8 ±
53.44 −33.8 ± 58 −67.1 ± 51 −196 ± 108a −148 ± 125a −72.86 ± 63a
Figure 1: (A-F) The plots represent the measured glomerular filtration (GFR) rate (Tc-99m) and the difference between the measured GFR minus estimated eGFR. The dotted vertical line represents the cutoff point of the mGFR <60 ml/min/1.73m2. The horizontal
CKD-EPI CystC formulas, 55% and 50% of the pa-tients showed an eGFR <60 ml/min, respectively, whereas the CG, MDRD-6, and CKD-EPI Cr formulas showed a lower percentage of the population with a GFR under 60 ml/min (17%, 17%, and 9%, respec-tively) (Fig. 2).
DISCUSSION
In patients with LC, kidney function plays a relevant role in all the disease stages. Its influence ranges from the adjustment of medication dose to being consid-ered a prognostic factor for pre-transplantation and post-transplantation survival14. In the MELD score,
which is the international classification for organ al-location for liver transplantation, SCr has been in-cluded as an essential marker for the evaluation of transplantation, and it is the section of the score that
has the most impact on mortality15. Today, GFR
cal-culated through equations based on creatinine has been shown to be inaccurate and imprecise in patients with cirrhosis, when compared with measured GFR, because the formulas are standardized in the general population4,16,17. In addition to presenting with factors
that modify SCr concentrations, such as age, female sex, muscle mass, and nutritional status, among oth-ers, patients with LC present with high bilirubin levels that directly interfere with the diagnostic assay15.
The RFH formula is an interesting, recently published equation for estimating GFR, which, unlike the previ-ously evaluated formulas, was developed in a popula-tion with LC. The formula includes the variables of age, sex, the presence or absence of ascites, creati-nine, urea, sodium, and INR8,9. It was validated
performance with outstanding accuracy and precision, although the methodology utilized for measuring GFR was not ideal. The RFH formula has the following im-portant characteristics: its most significant feature is that it was carried out in a population with LC; it considers factors which stratify the severity of LC, such as INR and ascites; and finally, it includes serum sodium, also making a correction for a potential state of dilution.
Due to the scarcity of formulas that adequately esti-mate GFR in patients with LC, we proposed to validate the new RFH formula in our cohort of patients with LC4, which only included Hispanic patients. The
per-formance of the formula for estimating GFR was less favorable than in the original study (Table 2). How-ever, it is important to note that there were some differences which could have influenced our results. The most important was the use of different tech-niques to measure GFR. In our study, it was deter-mined through renal clearance using Tc-99m DTPA, which is based on the quantification of the level of the radiopharmaceutical in plasma, as well as in urine. This means that it is not influenced by an increase in the volume of distribution, thus preventing the error observed in the methods based on the plasma clear-ance of a radiopharmaceutical. Plasma clearclear-ance is not necessarily the same as renal clearance, espe-cially in subjects with an increase in volume of distri-bution, in whom part of the clearance (or disappear-ance) of the radioisotope from the plasma is due to the redistribution of the radiopharmaceutical into a third space (edema and/or ascites) and, consequent-ly, kidney function is overestimated. Therefore, the K/ DOQI11-13 guidelines and the British guidelines18
rec-ommend renal clearance more than plasma clearance in patients with an increase in the volume of distribu-tion (ascites and/or edema). In the study by Kala-fateli et al.8, GFR measurement in the RFH training
and internal validation cohorts was done through plasma clearance of Cr-51 EDTA. To correct the over-estimation of GFR associated with the increase in the volume of distribution, they made a mathematical adjustment (previously published in two cohorts, of 13 and 111 patients)19,20. However, despite such
cor-rection, it is not the ideal method for creating and validating a formula, especially because the correction was made merely for the patients with ascites (it is not stated in the study that there were patients with edema and no ascites, which could also influence the
GFR result). In the external validation cohort (accord-ing to the text in the supplement), only GFR measure-ment through plasma clearance of Cr-51-EDTA was carried out, with no mathematical adjustment for ascites, even though 77 patients (93.9%) presented with that criterion. Glomerular filtration measure-ment through plasma clearance in cirrhotic patients with ascites can produce an overestimation of up to 200%, due to the loss of the radioisotope from the plasma into the ascitic fluid.
Another possible explanation for the difference in per-formance of the RFH formula in our cohort was the mean GFR through Tc-99m DTPA. It was much lower in our study than in the two cohorts of the original article (59.8 ml/min/1.73 m2 vs. 78 ml/min/1.73 m2
in the internal validation and 73 ml/min/1.73 m2 in
the external validation). The importance of the de-crease in the measured glomerular filtration is shown by the 20% decrease of p30 when comparing pa-tients with mGFR ≥ 60 ml/min versus those with mGFR < 60 ml/min. It is important to emphasize that the precision and accuracy reported by Kalafateli et al.8 with the CKD-EPI CystC formula (assessed only in
the external validation cohort of 82 patients) was a p30 of 26.8% (95% CI: 17.8-37.1). Such figure con-trasts considerably with the results from our cohort and with the majority of studies published at pres-ent3-5,17,21, in which in the cystatin C-based formulas,
cystatin C is considered the biomarker with greater precision and accuracy for estimating glomerular fil-tration in patients with LC. Both formulas (RFH and CKD-EPI CystC) performed very similarly with respect to precision and accuracy, as well as to the underes-timation of kidney function in patients with filtration > 60 ml/min/1.73m2 and overestimation in those
with filtration <60 ml/min/1.73m2 (Fig. 2,
Supple-mentary material). The RFH formula has the advan-tage that it does not need cystatin C determination (which is costly), and utilizes clinical and biochemical parameters that, in general, are routinely measured in the LC population (INR, sodium, and SCr), thus not increasing costs.
similar to those observed by Kalafateli et al. and other authors4,5,8. The most important limitation of
our study was its retrospective design and the sam-ple size. We could not include the entire population of the previous study because it incorporated pa-tients with anticoagulation and/or TIPS, which could affect the performance of the RFH formula, as well as the fact that not all the patients had the neces-sary data available (ascites, INR, and sodium) for applying the formula.
REFERENCES
1. Hecker R, Sherlock S. Electrolyte and circulatory changes in terminal liver failure. Lancet. 1956;271:1121-5.
2. Wiesner R, Edwards E, Freeman R, et al. Model for end-stage liver disease (MELD) and allocation of donor livers. Gastroenter-ology. 2003;124:91-6.
3. De Souza V, Hadj-Aissa A, Dolomanova O, et al. Creatinine-versus cystatine C-based equations in assessing the renal func-tion of candidates for liver transplantafunc-tion with cirrhosis. Hepa-tology. 2014;59:1522-31.
4. Torre A, Aguirre-Valadez JM, Arreola-Guerra JM, et al. Creati-nine versus cystatin C for estimating GFR in patients with liver cirrhosis. Am J Kidney Dis. 2016;67:342-4.
5. Mindikoglu AL, Dowling TC, Weir MR, et al. Performance of chronic kidney disease epidemiology collaboration creatinine-cystatin C equation for estimating kidney function in cirrhosis. Hepatology. 2014;59:1532-42.
6. Mindikoglu AL, Dowling TC, Magder LS, et al. Estimation of glomerular filtration rate in patients with cirrhosis by using new and conventional filtration markers and dimethylarginines. Clin Gastroenterol Hepatol. 2016;14:624-3200.
7. Cholongitas E, Ioannidou M, Goulis I, et al. Comparison of cre-atinine and cystatin formulae with 51 chromium-ethylenediami-netetraacetic acid glomerular filtration rate in patients with decompensated cirrhosis. J Gastroenterol Hepatol. 2017; 32:191-8.
8. Kalafateli M, Wickham F, Burniston M, et al. Development and validation of a mathematical equation to estimate glomerular filtration rate in cirrhosis: the royal free hospital cirrhosis glo-merular filtration rate. Hepatology. 2017;65:582-91.
9. Pedersen JS, Kimer N, Henriksen JH, Bendtsen F, Møller S. The royal free hospital cirrhosis glomerular filtration rate: validation in a danish cohort. Hepatology. 2017;66:1360-1.
10. Myers GL, Miller WG, Coresh J, et al. Recommendations for improving serum creatinine measurement: a report from the laboratory working group of the national kidney disease educa-tion program. Clin Chem. 2006;52:5-18.
11. Grubb A, Blirup-Jensen S, Lindström V, et al. First certified refer-ence material for cystatin C in human serum ERM-DA471/IFCC. Clin Chem Lab Med. 2010;48:1619-21.
12. Inker LA, Schmid CH, Tighiouart H. Estimating glomerular filtra-tion rate from serum creatinine and cystatin C. N Engl J Med. 2012;367:20-9.
13. National Kidney Foundation. K/DOQI clinical practice guidelines for chronic kidney disease: evaluation, classification, and strati-fication. Am J Kidney Dis. 2002;39:S1-266.
14. Nair S, Verma S, Thuluvath PJ. Pretransplant renal function pre-dicts survival in patients undergoing orthotopic liver transplan-tation. Hepatology. 2002;35:1179-85.
15. Francoz C, Glotz D, Moreau R, Durand F. The evaluation of renal function and disease in patients with cirrhosis. J Hepatol. 2010; 52:605-13.
16. Caregaro L, Menon F, Angeli P, et al. Limitations of serum cre-atinine level and crecre-atinine clearance as filtration markers in cirrhosis. Arch Intern Med. 1994;154:201-5.
17. Haddadin Z, Lee V, Conlin C, et al. Comparison of performance of improved serum estimators of glomerular filtration rate (GFR) to 99m Tc-DTPA GFR methods in patients with hepatic
cirrhosis. J Nucl Med Technol. 2017;45:42-9.
18. Fleming JS, Zivanovic MA, Blake GM, et al. Guidelines for the measurement of glomerular filtration rate using plasma sam-pling. Nucl Med Commun. 2004;25:759-69.
19. Wickham F, Burniston MT, Xirouchakis E, et al. Development of a modified sampling and calculation method for isotope plasma clearance assessment of the glomerular filtration rate in pa-tients with cirrhosis and ascites. Nucl Med Commun. 2013; 34:1124-32.
20. Wickham F, Burniston MT, McMeekin H, Hilson AJ, Burroughs AK. Validation and impact of a new technique for assessment of glomerular filtration rate in patients with liver disease. Nucl Med Commun. 2015;36:168-79.