Quality
Quality
Quality
Quality
United States Office of Environmental EPA/240/R-02/005
Environmental Protection Information December 2002
Agency Washington, DC 20460
Guidance on Choosing a
Sampling Design for Environmental
Data Collection
for Use in Developing a Quality
Assurance Project Plan
FOREWORD
This document, Guidance for Choosing a Sampling Design for Environmental Data Collection (EPA QA/G-5S), will provide assistance in developing an effective QA Project Plan as described in Guidance for QA Project Plans (EPA QA/G-5) (EPA 1998b). QA Project Plans are one component of EPA’s Quality System. This guidance is different from most guidance in that it is not meant to be read in a linear or continuous fashion, but to be used as a resource or reference document. This guidance is a “tool-box” of statistical designs that can be examined for possible use as the QA Project Plan is being developed.
EPA works every day to produce quality information products. The information used in these products are based on Agency processes to produce quality data, such as the quality system described in this document. Therefore, implementation of the activities described in this document is consistent with EPA’s Information Quality Guidelines and promotes the dissemination of quality technical, scientific, and policy information and decisions.
This document provides guidance to EPA program managers, analysts, and planning teams on statistically based sampling schemes. It does not impose legally binding requirements and the methods described may not apply to a particular situation based on the circumstances. The Agency retains the discretion to adopt approaches on a case-by-case basis that may differ from the techniques described in this guidance. EPA may periodically revise this guidance without public notice. It is the intent of the Quality Staff to revise the document to include: new techniques, corrections, and suggestions for alternative techniques. Future versions of this document will include examples in depth that illustrate the strengths of each statistical design.
This document is one of the U.S. Environmental Protection Agency Quality System Series
documents. These documents describe the EPA policies and procedures for planning, implementing, and assessing the effectiveness of a Quality System. Questions regarding this document or other
Quality System Series documents should be directed to the Quality Staff: U.S. Environmental Protection Agency
Quality Staff (2811R)
1200 Pennsylvania Ave., NW Washington, D.C. 20460 Phone: (202) 564-6830 Fax: (202) 565-2441 E-mail: [email protected]
TABLE OF CONTENTS
Page
1. INTRODUCTION . . . 1
1.1 WHY IS SELECTING AN APPROPRIATE SAMPLING DESIGN IMPORTANT? . . . 1
1.2 WHAT TYPES OF QUESTIONS WILL THIS GUIDANCE ADDRESS? . . . 2
1.3 WHO CAN BENEFIT FROM THIS DOCUMENT? . . . 3
1.4 HOW DOES THIS DOCUMENT FIT INTO THE EPA QUALITY SYSTEM? . . 4
1.5 WHAT SOFTWARE SUPPLEMENTS THIS GUIDANCE? . . . 5
1.6 WHAT ARE THE LIMITATIONS OR CAVEATS TO THIS DOCUMENT? . . . . 5
1.7 HOW IS THIS DOCUMENT ORGANIZED? . . . 6
2. OVERVIEW OF SAMPLING DESIGNS . . . 7
2.1 OVERVIEW . . . 7
2.2 SAMPLING DESIGN CONCEPTS AND TERMS . . . 8
2.3 PROBABILISTIC AND JUDGMENTAL SAMPLING DESIGNS . . . 10
2.4 TYPES OF SAMPLING DESIGNS . . . 11
2.4.1 Judgmental Sampling . . . 12
2.4.2 Simple Random Sampling . . . 12
2.4.3 Stratified Sampling . . . 13
2.4.4 Systematic and Grid Sampling . . . 13
2.4.5 Ranked Set Sampling . . . 14
2.4.6 Adaptive Cluster Sampling . . . 15
2.4.7 Composite Sampling . . . 15
3. THE SAMPLING DESIGN PROCESS . . . 17
3.1 OVERVIEW . . . 17
3.2. INPUTS TO THE SAMPLING DESIGN PROCESS . . . 17
3.3 STEPS IN THE SAMPLING DESIGN PROCESS . . . 22
3.4 SELECTING A SAMPLING DESIGN . . . 24
4. JUDGMENTAL SAMPLING . . . 27
4.1 OVERVIEW . . . 27
4.2 APPLICATION . . . 27
4.3 BENEFITS . . . 28
4.4 LIMITATIONS . . . 28
4.5 IMPLEMENTATION . . . 28
Page
4.7 EXAMPLES OF SUCCESSFUL USE . . . 30
4.8 EXAMPLES OF UNSUCCESSFUL USE . . . 31
5. SIMPLE RANDOM SAMPLING . . . 33
5.1 OVERVIEW . . . 33
5.2 APPLICATION . . . 33
5.3 BENEFITS . . . 34
5.4 LIMITATIONS . . . 34
5.5 IMPLEMENTATION . . . 35
5.6 RELATIONSHIP TO OTHER SAMPLING DESIGNS . . . 39
5.7 EXAMPLES . . . 40
APPENDIX 5. SAMPLE SIZE TABLES . . . 44
6. STRATIFIED SAMPLING . . . 51
6.1 OVERVIEW . . . 51
6.2 APPLICATION . . . 51
6.3 BENEFITS . . . 52
6.4 LIMITATIONS . . . 53
6.5 IMPLEMENTATION . . . 53
6.6 RELATIONSHIP TO OTHER SAMPLING DESIGNS . . . 54
6.7 EXAMPLE . . . 55
APPENDIX 6-A. FORMULAE FOR ESTIMATING SAMPLE SIZE . . . 57
APPENDIX 6-B. DALENIUS-HODGES PROCEDURE . . . 59
APPENDIX 6-C. CALCULATING THE MEAN AND STANDARD ERROR . . . 60
7. SYSTEMATIC/GRID SAMPLING . . . 63
7.1 OVERVIEW . . . 63
7.2 APPLICATION . . . 64
7.3 BENEFITS . . . 67
7.4 LIMITATIONS . . . 68
7.5 IMPLEMENTATION . . . 69
7.6 RELATIONSHIP TO OTHER SAMPLING DESIGNS . . . 71
7.7 EXAMPLES . . . 72
8. RANKED SET SAMPLING . . . 77
8.1 OVERVIEW . . . 77
8.2 APPLICATION . . . 80
8.3 BENEFITS . . . 80
Page
8.5 IMPLEMENTATION . . . 83
8.6 EXAMPLES . . . 84
APPENDIX 8-A. USING RANKED SET SAMPLING . . . 87
9. ADAPTIVE CLUSTER SAMPLING . . . 103
9.1 OVERVIEW . . . 103
9.2 APPLICATION . . . 103
9.3 BENEFITS . . . 104
9.4 LIMITATIONS . . . 104
9.5 IMPLEMENTATION . . . 106
9.6 RELATIONSHIP TO OTHER SAMPLING DESIGNS . . . 108
9.7 EXAMPLE . . . 109
APPENDIX 9-A. ESTIMATORS OF MEAN AND VARIANCE . . . 111
10. COMPOSITE SAMPLING . . . 119
10.1 OVERVIEW . . . 119
10.2 COMPOSITE SAMPLING FOR ESTIMATING A MEAN . . . 122
10.2.1 Overview . . . 122
10.2.2 Application . . . 124
10.2.3 Benefits . . . 125
10.2.4 Limitations . . . 125
10.2.5 Implementation . . . 127
10.2.6 Relationship to Other Sampling Designs . . . 130
10.2.7 Examples . . . 133
10.3 COMPOSITE SAMPLING FOR ESTIMATING A POPULATION PROPORTION . . . 133
10.3.1 Overview . . . 133
10.3.2 Application . . . 134
10.3.3 Benefits . . . 135
10.3.4 Limitations . . . 135
10.3.5 Implementation . . . 135
10.3.6 Relationship to Other Sampling Designs . . . 137
10.3.7 Examples . . . 137
APPENDIX 10-A. COST AND VARIANCE MODELS . . . 138
Page 11. COMPOSITE SAMPLING FOR IDENTIFYING A TRAIT AND EXTREME
SAMPLING UNITS . . . 143
11.1 COMPOSITE SAMPLING FOR IDENTIFYING A TRAIT . . . 143
11.1.1 Overview . . . 143
11.1.2 Application . . . 144
11.1.3 Benefits . . . 145
11.1.4 Limitations . . . 145
11.1.5 Implementation . . . 145
11.1.6 Relationship to Other Sampling Designs . . . 149
11.1.7 Examples . . . 151
11.2 COMPOSITE SAMPLING AND RETESTING FOR IDENTIFYING EXTREME SAMPLING UNITS . . . 151
11.2.1 Overview . . . 151
11.2.2 Application . . . 153
11.2.3 Benefits . . . 153
11.2.4 Limitations . . . 153
11.2.5 Implementation . . . 153
11.2.6 Relationship to Other Sampling Designs . . . 154
GLOSSARY OF TERMS . . . 155
FIGURES
Page
1-1. Site Map for Old Lagoon . . . 2
1-2. Life-cycle of Data in the EPA Quality System . . . 4
2-1. Inferences Drawn from Judgmental versus Probabilistic Sampling Designs . . . 11
2-2. Simple Random Sampling . . . 12
2-3. Stratified Sampling . . . 13
2-4. Systematic/Grid Sampling . . . 14
2-5. Adaptive Cluster Sampling . . . 15
2-6. Composite Sampling . . . 15
3-1. The DQO Process . . . 18
3-2. Factors in Selecting a Sampling Design . . . 20
3-3. The Sampling Design Process . . . 22
5-1. Example of a Map Showing Random Sampling Locations . . . 37
5-2. A One-Dimensional Sample of Cross-Sections from a Waste Pile . . . 38
5-3. A Two-Dimensional Sample of Cores from a Waste Pile . . . 39
5-4. Illustration of a Quasi-Random Sample . . . 39
6-1. Stratification of Area to Be Sampled . . . 55
7-1. Systematic Designs for Sampling in Space . . . 63
7-2. Choosing a Systematic Sample of n = 4 Units from a Finite Population of N = 15 Units . . . . 64
7-3. Locating a Square Grid Systematic Sample . . . 70
7-4. Map of an Area to Be Sampled Using a Triangular Sampling Grid . . . 72
8-1. Using Ranked Set Sampling to Select Three Locations . . . 79
9-1. Population Grid with Initial and Follow-up Samples and Areas of Interest . . . 107
9-2. Follow-up Sampling Pattern . . . 108
9-3. Comparison of Initial Sample with Final Sample . . . 108
9-4. Illustration of an Ideal Situation for Adaptive Cluster Sampling . . . 109
10-1. Equal Volume, Equal Allocation Compositing . . . 119
TABLES
Page
1-1. Potential Benefits for Users . . . 3
2-1. Probability-based versus Judgmental Sampling Designs . . . 10
2-2. Sampling Designs Presented in this Guidance . . . 12
3-1. Choosing the Appropriate Sampling Design for Your Problem . . . 24
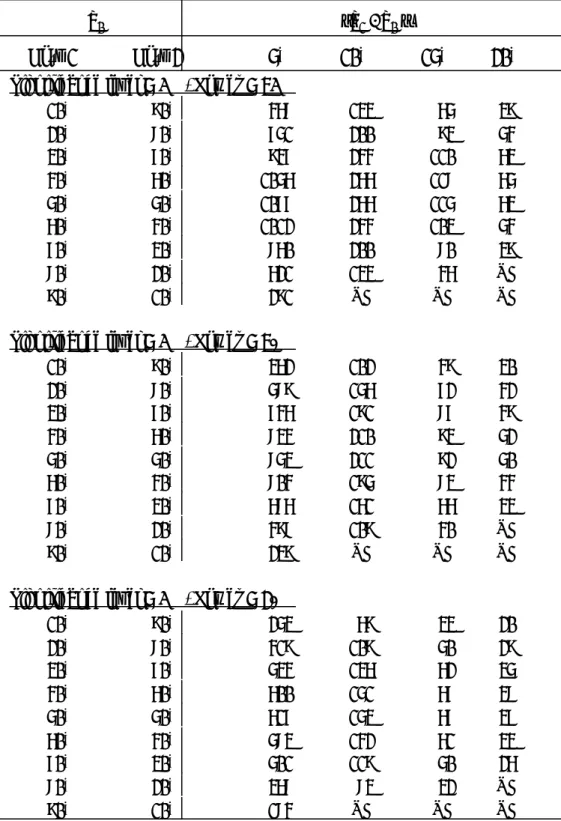
5-1. Sample Size Needed for One-Sample t-test . . . 44
5-2. Sample Size Needed for a One-Sample Test for a Population Proportion, P, at a 5% Significance Level . . . 45
5-3. Sample Size Needed for a One-Sample Test for a Population Proportion, P, at a 10% Significance Level . . . 46
5-4. Sample Size Needed for a Two-Sample t-Test . . . 47
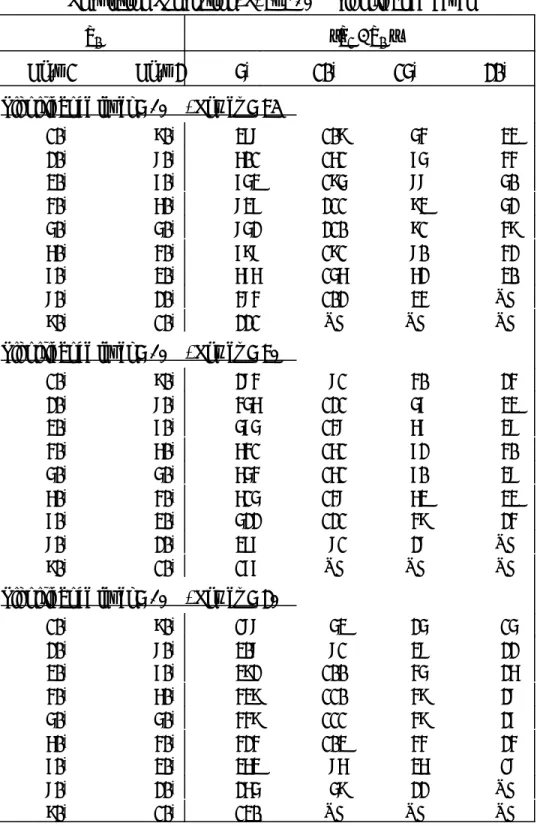
5-5. Sample Size Needed for a Two-Sample Test for Proportions at a 5% Significance Level . . . 48
5-6. Sample Size Needed for a Two-Sample Test for Proportions at a 10% Significance Level . . . 49
6-1. Summary Statistics for Simple and Stratified Random Samples . . . 56
6-2. Number of Samples Needed to Produce Various Levels of Precision for the Mean . . . 56
8-1. Comparing the Number of Samples for Laboratory Analysis Using Ranked Set Sampling . . 81
8-2. The Approximate Cost Ratio for Estimating the Mean . . . 88
8-3. Approximate Cost Ratio for Estimating the Mean when On-site Measurements Are Used to Rank Field Locations . . . 89
8-4. Relative Precision (RP) of Balanced Ranked Set Sampling to Simple Random Sampling for Lognormal Distributions . . . 92
8-5. Optimal Values of t for Determining the Number of Samples for Laboratory Analysis Needed for an Unbalanced Ranked Set Sampling Design . . . 97
8-6. Correction Factors for Obtaining Relative Precision Values . . . 98
9-1. Comparison of Designs . . . 105
10-1. When to Use Composite Sampling — Four Fundamental Cases . . . 121
10-2. Criteria for Judging Benefits of Composite Sampling . . . 123
10-3. Optimal k Values for Estimating a Population Mean . . . 129
10-4. Optimal k for Estimating p and Approximate Confidence Intervals for p. . . 137
10-5. Components of Cost and Variance for Random Samples - With and Without Composite Sampling . . . 139
11-1. Identification of Composite Sampling and Retesting Schemes for Classifying Units Having a Rare Trait . . . 147
11-2. Optimal Number of Samples per Composite for Exhaustive Retesting . . . 148
11-3. Optimal Number of Samples per Composite for Sequential Retesting . . . 149
BOXES
Page
1-1. Questions that this Document Will Help to Address . . . 2 10-1. Example of Benefits of Composite Sampling . . . 126 10-2. Directions for Selecting Equal Allocation, Equal Volume Composite Samples for
Estimating a Mean . . . 128 10-3. Example: Compositing for Estimating a Site Mean . . . 131 10-4. Directions for Composite Sampling for Estimating the Proportion of a Population
1Note: Sampling design is not the only important component. The methods used in sample handling and extraction
are equally important to the quality of the data. The United States Environmental Protection Agency produces extensive guidance on sampling methods and field sampling techniques for different regulations, regions, and programs that are not addressed in this document. In addition, measurement error affects the ability to draw conclusions from the data. Guidance on Data Quality Indicators (QA/G-5i) (EPA, 2001) contains information on this issue.
CHAPTER 1 INTRODUCTION
This document provides guidance on how to create sampling designs to collect environmental measurement data. This guidance describes several relevant basic and innovative sampling designs, and describes the process for deciding which design is right for a particular application.
1.1 WHY IS SELECTING AN APPROPRIATE SAMPLING DESIGN IMPORTANT?
The sampling design is a fundamental part of data collection for scientifically based decision making. A well-developed sampling design plays a critical role in ensuring that data are sufficient to draw the conclusions needed.1 A sound, science-based decision is based on accurate information. To generating accurate information about the level of contamination in the environment, you should
consider the following:
C the appropriateness and accuracy of the sample collection and handling method,
C the effect of measurement error,
C the quality and appropriateness of the laboratory analysis, and
C the representativeness of the data with respect to the objective of the study. Of these issues, representativeness is addressed through the sampling design.
Representativeness may be considered as the measure of the degree to which data accurately and precisely represent a characteristic of a population, parameter variations at a sampling point, a process condition, or an environmental condition [American National Standards Institute/American Society for Quality Control (ANSI/ASQC) 1994]. Developing a sampling design is a crucial step in collecting appropriate and defensible data that accurately represent the problem being investigated.
For illustration, consider Figure 1-1, a site map for a dry lagoon formerly fed by a pipe. Assuming that good field and laboratory practices are exercised and adequate quality control is
2Note: The problem of what constitutes “representativeness” is complex and further discussion may be A
B C
E
F D
Area where outfall from pipe was expected to accumulate
Old Lagoon (now dry) Location of Pipe
Figure 1-1. Site Map for Old Lagoon
the entire site of the old lagoon (for example, perhaps including samples at D, E, and F). If a sampling design results in the collection of nonrepresentative data, even the highest quality laboratory analysis cannot compensate for the lack of representative data. The selection of the appropriate sampling design is necessary in order to have data that are representative of the problem being investigated.2
This document provides technical guidance on specific sampling designs that can be used to improve the quality of environmental data collected. Based in
statistical theory, each chapter explains the benefits and drawbacks of each design and describes relevant examples of environmental measurement applications. To choose a sampling design that adequately addresses the estimation or decision at hand, it is important to understand what relevant factors should be considered and how these factors affect the choice of an appropriate sampling design.
1.2 WHAT TYPES OF QUESTIONS WILL THIS GUIDANCE ADDRESS?
Often it is difficult in practice to know how to answer questions regarding how many samples to take and where they should be taken. The development of a sampling design will answer these
questions after considering relevant issues, such as variability. Box 1-1 outlines the questions that are relevant to choosing a sampling design.
Box 1-1. Questions that this Document Will Help to Address
• What aspects of the problem should be considered for creating a sampling design? • What are the types of designs that are commonly used in environmental sampling? • What are some innovative designs that may improve the quality of the data? • Which designs suit my problem?
• How should I design my sampling to provide the right information for my problem given a limited budget for sampling?
1.3 WHO CAN BENEFIT FROM THIS DOCUMENT?
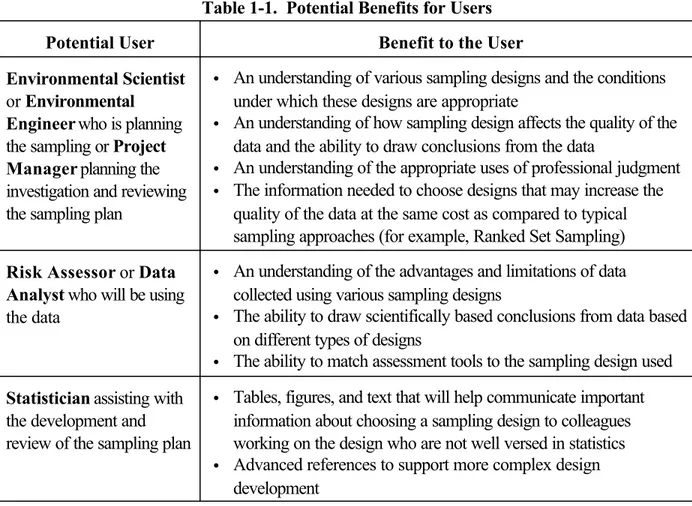
This document will be useful to anyone planning data collection from any type of environmental media including soil, sediment, dust, surface water, groundwater, air, vegetation, and sampling in indoor environments. The document contains information that will help those who are not extremely familiar with statistical concepts as well as those who are more comfortable with statistics. To this end, varying degrees of detail are provided on the various sampling designs, which should be used according to ability. The potential benefits for different types of users are shown in Table 1-1. This document is meant to apply to all environmental media; examples in this document provides information on innovative designs not discussed in earlier EPA documents.
The guidance document is designed for users who are not necessarily well versed in statistics. The document is written in plain language, and is designed to minimize technical jargon and provide useful explanations for those who might not already be familiar with the concepts described. In some chapters, more advanced material and more advanced references have been provided for statisticians -these have been marked as “more advanced.”
Table 1-1. Potential Benefits for Users Potential User Benefit to the User Environmental Scientist
or Environmental Engineer who is planning the sampling or Project Manager planning the investigation and reviewing the sampling plan
• An understanding of various sampling designs and the conditions under which these designs are appropriate
• An understanding of how sampling design affects the quality of the data and the ability to draw conclusions from the data
• An understanding of the appropriate uses of professional judgment • The information needed to choose designs that may increase the
quality of the data at the same cost as compared to typical sampling approaches (for example, Ranked Set Sampling)
Risk Assessor or Data Analyst who will be using the data
• An understanding of the advantages and limitations of data collected using various sampling designs
• The ability to draw scientifically based conclusions from data based on different types of designs
• The ability to match assessment tools to the sampling design used
Statistician assisting with the development and review of the sampling plan
• Tables, figures, and text that will help communicate important information about choosing a sampling design to colleagues working on the design who are not well versed in statistics • Advanced references to support more complex design
PROJECT
Systematic Planning
QA Project Plan
Conduct Study/Experiment
Data Verification and Validation
Standard Operating Procedures
Technical Assessments
Data Quality Assessment
IMPLEMENTATION
PLANNING ASSESSMENT
Sampling Design
Data Quality Indicators
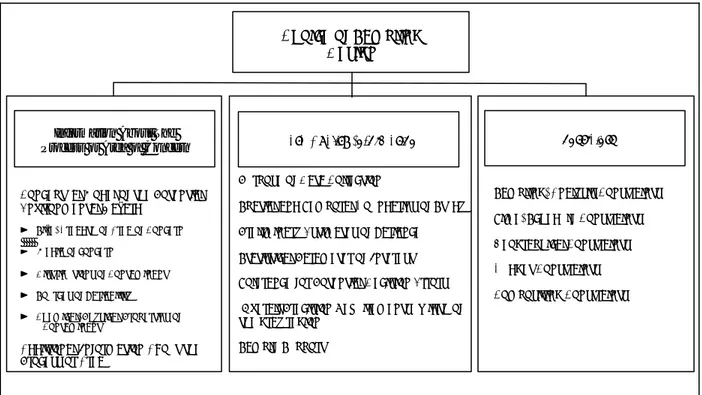
1.4 HOW DOES THIS DOCUMENT FIT INTO THE EPA QUALITY SYSTEM?
Analysts should use systematic planning in order to collect data that will allow them to draw scientifically based conclusions. There are many cases in which data have been collected, but when the decision maker examines the data to draw conclusions, he or she finds that the data do not match the needs of the decision. Such problems can be avoided by using a systematic planning process to design the data collection. This process accounts for user’s needs before the data are collected.
When data are being used in direct support of a decision. the Agency’s recommended systematic plnning tool is the Data Quality Objectives (DQO) Process as described in EPA 2000b. For systematic planning of environmental data collection, EPA prefers the Data Quality Objectives (DQO) process described in the data quality objectives guidance (EPA, 2000b). A sampling design is chosen in Step 7 of the DQO Process based on the parameters specified in the other steps in the DQO Process. In this guidance, the activities of DQO Step 7 are explained in Chapter 3 (i.e., the process of choosing a sampling design), and a full discussion of the factors that should be considered in Step 7 of the DQO Process is given in Section 3.2.
Figure 1-2 illustrates the life-cycle of environmental data in the EPA Quality System. The process begins with systematic planning. Developing a sampling design is the last step in systematic planning, and is explained briefly in Step 7 of Guidance for the Data Quality Objectives Process (QA/G-4) (EPA, 2000b). This guidance document on sampling design is intended to expand greatly on the general details provided in that guidance. Information from the other steps in the systematic
Data Quality Indicators (DQIs) are specific calculations that measure performance as reflected in the DQOs and performance and acceptance criteria. DQIs include precision, accuracy, representativeness, completeness, consistency, and sensitivity, and are discussed at length in Guidance on Data Quality Indicators (QA/G-5i) (EPA, 2001). The choice of sampling design will have an impact on the DQIs. These indicators are addressed specifically for each project in the details of the Quality Assurance (QA) Project Plan.
The development of a sampling design is followed by the development of a QA Project Plan. A process for developing a QA Project Plan is described in Guidance for Quality Assurance Project Plans (QA/G-5) (EPA, 1998b).
After the QA Project Plan is developed and approved, data are collected during the study/experimental phase according to the plan. Quality is further assured by the use of standard operatingprocedures and audits (technical assessment). Finally, verification, validation, and quality assessment of the data complete the quality system data collection process.
1.5 WHAT SOFTWARE SUPPLEMENTS THIS GUIDANCE?
Visual Sampling Plan (VSP) is a software tool that contains some of the sampling plans discussed in this guidance. VSP supports the implementation of the DQO Process by visually displaying different sampling plans, linking them to the DQO Process, and determining the optimal sampling specifications to protect against potential decision errors. This easy-to-use program is highly visual, very graphic, and intended for use by non-statisticians. VSP may be obtained from
http://dqo.pnl.gov.vsp.
1.6 WHAT ARE THE LIMITATIONS OR CAVEATS TO THIS DOCUMENT?
The scope of this document is limited to environmental measurement data. It does not explicitly address count data, survey (questionnaire) data, human exposure data, or experimental data collection, although some of the concepts described here are applicable to these types of studies. This guidance does not provide a complete catalogue of potential sampling designs used by EPA. These guidelines do not supercede regulatory requirements for specific types of sampling design, nor regional, state, or program guidance; rather, they are intended to supplement other guidance.
In addition, there are sampling designs that might be used in environmental data collection that are not discussed in this document. For example, double sampling, sequential sampling, quota
1.7 HOW IS THIS DOCUMENT ORGANIZED?
This document is designed to be used as a reference rather than be read from beginning to end. First-time users will probably want to skim Chapter 2 and read Chapter 3 before continuing to other chapters. Chapter 2 defines important concepts and terms, and introduces the types of sampling designs covered in this document, along with information on what specific types of situations call for which designs. Chapter 3 describes the process of developing a sampling design and discusses how input from a systematic planning process affects the choice of a sampling design.
The remaining chapters contain specific information about different sampling designs or
protocols. Each chapter is formatted in a similar style to allow the reader to easily find information. A synopsis of the benefits and limitations of the design can be found in each chapter, so that readers can evaluate each design in light of their specific situation. Each chapter also contains at least one example and descriptions of applications of this design, where possible. Finally, each chapter has an appendix containing formulae and additional technical information.
Some designs are often used in conjunction with other designs; descriptions and examples of these types of studies are included. At the end of the document, a glossary defines key terms and a list of references contains citations for all referenced material and other materials used in developing this document.
CHAPTER 2
OVERVIEW OF SAMPLING DESIGNS 2.1 OVERVIEW
What does a sampling design consist of?
A complete sampling design indicates the number of samples and identifies the particular samples (for example, the geographic positions where these samples will be collected or the time points when samples will be collected). Along with this information, a complete sampling design will also include an explanation and justification for the number and the positions/timings of the samples. For a soil sample, the samples may be designated by longitude and latitude, or by measurements relative to an existing structure. For air or water measurements, the samples would be designated by longitude and latitude as well as by time. For example, for the measurement of particulates in air, a specified length of time would be set, such as 24 hours, in addition to the geographical location. The sampling design would note what time the air sample collection would begin (for example, 12:00 midnight on February 10, 2001), and when it would end (for example, 12:00 midnight on February 11, 2001). The
measurement protocol would then specify when the sampler would be retrieved and how the sample would be analyzed.
What is the purpose of a sampling design?
The goals of a sampling design can vary widely. Typical objectives of a sampling design for environmental data collection are:
C To support a decision about whether contamination levels exceed a threshold of unacceptable risk,
C To determine whether certain characteristics of two populations differ by some amount,
C To estimate the mean characteristics of a population or the proportion of a population that has certain characteristics of interest,
C To identify the location of “hot spots” (areas having high levels of contamination) or plume delineation,
C To characterize the nature and extent of contamination at a site, or
C To monitor trends in environmental conditions or indicators of health.
are limited or these are multiple objectives, tradeoffs may need to be made in the design. More information on how to go about doing this is contained in Chapter 3 on the sampling design process.
2.2 SAMPLING DESIGN CONCEPTS AND TERMS
Defining the population is an important step in developing a sampling plan. The target population is the set of all units that comprise the items of interest in a scientific study, that is, the population about which the decision maker wants to be able to draw conclusions. The sampled population is that part of the target population that is accessible and available for sampling. For example, the target population may be defined as surface soil in a residential yard, and the sampled population may be areas of soil in that yard not covered by structures or vegetation. Ideally, the sampled population and the target population are the same. If they are not, then professional judgment is used to verify that data drawn from the sampled population is appropriate for drawing conclusions about the target population.
A sampling unit is a member of the population that may be selected for sampling, such as individual trees, or a specific volume of air or water. It is important for study planners to be very specific when defining a sampling unit’s characteristics with respect to space and time. A sampling unit should detail the specific components of a particular environmental media, for example, 10 cubic meters (m3) of air passing through a filter located in downtown Houston on July 15, 2000. Some
environmental studies have distinct sampling units such as trees, fish, or drums of waste material. However, such distinct sampling units may not be available in environmental studies requiring samples of soil, water, or other solid or liquid media. In this case, the sampling units are defined by the investigator and need to be appropriate for selecting a representative sample of material from the medium of
interest. The physical definition of a sampling unit in terms of its “size, shape, and orientation” is referred to as the sample support(Starks, 1986). The sampling frame is a list of all the possible sampling units from which the sample can be selected. The sample is a collection of some of these sampling units.
individual specimens (see Chapter 9). Hence, the study objectives need to clearly define the sample support in order for the results (for example, sample mean and variance) to be clearly interpretable.
Once a sampling unit is selected, a measurement protocol is applied; a measurement protocol is a specific procedure for making observations or performing analyses to determine the characteristics of interest for each sampling unit. The measurement protocol would include the procedures for collecting a physical sample, handling and preparing the physical sample, applying an analytical method (including the sample preparation steps) to obtain a result (that is, to obtain the data for the sample), and protocol for resampling if necessary. If compositing of the samples is employed (so that measurements are made on the composites), then the measurement protocol would also include a
composite sampling protocol, which indicates how many composites are to be formed, how many samples comprise each composite, and which samples are used to form each composite; the
compositing protocol would also prescribe the compositing procedures (for example, for
homogenization, for taking aliquots). The sampling design specifies the number, type, and location (spatial and/or temporal) of sampling units to be selected for measurement.
A water sampling example illustrates how these terms relate to one another. Consider a study designed to measure E. coli and entercocci levels in a specific swimming area of a lake. The target population is the water flowing through this area (delineated by buoys) from May 1 until September 15. The sampled population will be the water in the swimming area at 7 a.m. and 2 p.m at approximately 6 inches below the surface. The sampling units chosen for the study consist of 1-liter volumes of water at particular locations in the swimming area. In this case, the sample support is equal to the sampling unit, 1 liter of water. The measurement protocol calls for the use of a 2-liter beaker, held by a 6-inch handle. The sampler needs a nonmotorized boat (for example, a rowboat) to collect the sample so as to minimize the disturbance to the water. The sample is collected in the specified manner and poured into a 2-liter sample jar, up to the 1-liter line. The rest of the water in the beaker is discarded back into the lake. Each 1-liter container of water is taken to the lab for analysis within 6 hours and is analyzed according to current state standards. The sampling design calls for obtaining a minimum of two samples on each sampling day at 7 a.m. and 2 p.m or up to three times a day when there are indications of increased potential for contamination (for example, heavy rainfall). Sampling days are defined in the study and may be every day, every other day, or whatever frequency is appropriate for the particular problem at hand. The sampling design also specifies the exact locations where the samples should be drawn, which in this case were chosen at random.
sources of variability in the data (for example, inherent variability among sampling units in the population and variability associated with selecting and analyzing samples).
2.3 PROBABILISTIC AND JUDGMENTAL SAMPLING DESIGNS
There are two main categories of sampling designs: probability-based designs and judgmental designs. Probability-based sampling designs apply sampling theory and involve random selection of sampling units. An essential feature of a probability-based sample is that each member of the
population from which the sample was selected has a known probability of selection. When a
probability-based design is used,statisticalinferences may be made about the sampled population from the data obtained from the samplingunits. That is, when using a probabilistic design, inferences can be drawn about the sampled population, such as the concentration of fine particulate matter (PM2.5) in ambient air in downtown Houston on a summer day, even though not every single “piece” of the downtown air is sampled. Judgmental sampling designs involve the selection of sampling units on the basis of expertknowledge or professional judgment.
Table 2-1 summarizes the main features of each main type of sampling design. Section 2.3.1 introduces judgmental sampling, and Chapter 4 contains more information on the benefits and limitations of this design. Sections 2.3.2 through 2.3.7 introduce the six probabilistic sampling designs, and
Chapters 5 through 10 describe these in more detail. Reviewing these chapters will provide more details about the appropriate use of these designs.
Table 2-1. Probability-based versus Judgmental Sampling Designs
Probability-based Judgmental
Advantages
• Provides ability to calculate uncertainty associated with estimates
• Provides reproducible results within uncertainty limits
• Provides ability to make statistical inferences • Can handle decision error criteria
• Can be less expensive than probabilistic designs. Can be very efficient with knowledge of the site
• Easy to implement
Disadvantages
• Random locations may be difficult to locate • An optimal design depends on an accurate
conceptual model
• Depends upon expert knowledge • Cannot reliably evaluate precision of
estimates
• Depends on personal judgment to interpret data relative to study objectives
Objective: Estimate the average concentration of pesticide chlorpyrifos in the apples grown on this apple orchard
TARGET POPULATION: Fruit to be consumed from this orchard
CONSIDER PRACTICAL CONSTRAINTS: Some apples may not be consumed for various reasons, but because this is not predictable, all fruit growing in this orchard is eligible for sampling
SAMPLED POPULATION: All fruit growing in orchard that is to be processed for consumption
Judgmental Sampling
Select measurement protocol Collect sample
units Measure units and
generate data Inspect data
Statistical Report Determine where to take
samples using personal opinion
Professional Judgment
Probability Sampling Determine where to take
samples statistically Select measurement
protocol Collect sample
units Measure units and
generate data Analyze data Professional Judgment Anecdotal Report
Figure 2-1. Inferences Drawn from Judgmental versus Probabilistic Sampling Designs
each ends with data collection and analysis. The difference is seen when moving up the diagram, which shows how conclusions can be drawn about the sampled and target
populations.
When using probabilistic sampling, the data analyst can draw quantitative conclusions about the sampled population. That is, in estimating a parameter (for example., the mean), the analyst can calculate a 95% confidence interval for the parameter of interest. If
comparing this to a threshold, the analyst can state whether the data indicate that the concentration exceeds or is below the threshold with a certain level of confidence. Expert judgment is then used to draw conclusions about the target population based on the statistical
findings about the sampled population. Expert judgment can also be used in other aspects of probabilistic sampling designs, such as defining strata in a stratified design. Such uses of expert judgment will be discussed in more detail in relevant sampling design chapters.
When using judgmental sampling, statistical analysis cannot be used to draw conclusions about the target population. Conclusions can only be drawn on the basis of professional judgment. The usefulness of judgmental sampling will depend on the study objectives, the study size and scope, and the degree of professional judgment available. When judgmental sampling is used, quantitative statements about the level of confidence in an estimate (such as confidence intervals) cannot be made.
2.4 TYPES OF SAMPLING DESIGNS
Figure 2-2. Simple Random Sampling
environmental data. Table 2-2 identifies the sampling designs discussed in this document, and indicates which chapter contains detailed information on each design. This section briefly describes each design, providing some information about the type of applications for which each design is especially
appropriate and useful.
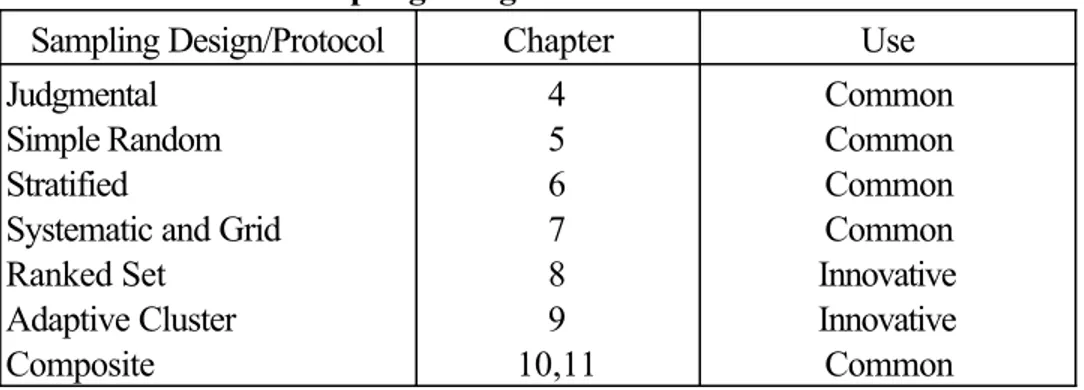
Table 2-2. Sampling Designs Presented in this Guidance
Sampling Design/Protocol Chapter Use
Judgmental Simple Random Stratified
Systematic and Grid Ranked Set
Adaptive Cluster Composite
4 5 6 7 8 9 10,11
Common Common Common Common Innovative Innovative Common
2.4.1 Judgmental Sampling
In judgmental sampling, the selection of sampling units (i.e., the number and location and/or timing of collecting samples) is based on knowledge of the feature or condition under investigation and on professional judgment. Judgmental sampling is distinguished from probability-based sampling in that inferences are based on professional judgment, not statistical scientific theory. Therefore, conclusions about the target population are limited and depend entirely on the validity and accuracy of professional judgment; probabilistic statements about parameters are not possible. As described in subsequent chapters, expert judgment may also be used in conjunction with other sampling designs to produce effective sampling for defensible decisions.
2.4.2 Simple Random Sampling
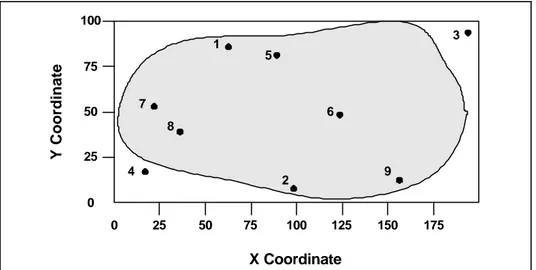
In simple random sampling, particular sampling units (for example, locations and/or times) are selected using random numbers, and all possible selections of a given number of units are equally likely. For example, a simple random sample of a set of drums can be taken by
Down Wind/ Clayey Soil Perpindicular Wind/ Clayey Soil Perpindicular Wind/ Sandy Soil Down Wind/ Sandy Soil Direction of Prevailing Wind Smoke Stack Clayey Soil Perpindicular Wind/ Sandy Soil
Radius = 500 m Clayey Soil Up Wind/ Sandy Soil Up Wind/ Clayey Soil
Figure 2-3. Stratified Sampling
(1) It provides statistically unbiased estimates of the mean, proportions, and variability. (2) It is easy to understand and easy to implement.
(3) Sample size calculations and data analysis are very straightforward.
In some cases, implementation of a simple random sample can be more difficult than some other types of designs (for example, grid samples) because of the difficulty of precisely identifying random geographic locations. Additionally, simple random sampling can be more costly than other plans if difficulties in obtaining samples due to location causes an expenditure of extra effort.
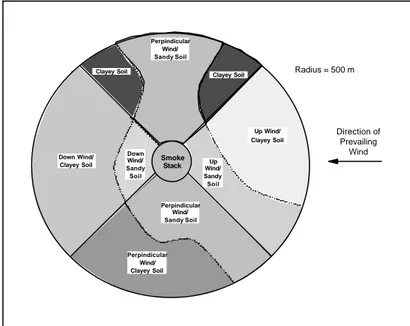
2.4.3 Stratified Sampling
In stratified sampling, the target population is separated into nonoverlapping strata, or subpopulations that are known or thought to be more homogeneous (relative to the environmental medium or the contaminant), so that there tends to be less variation among sampling units in the same stratum than among sampling units in different strata. Strata may be chosen on the basis of spatial or temporal proximity of the units, or on the basis of preexisting information or professional judgment about the site or process. Figure 2-3 depicts a site that was stratified on the basis of information about how the contaminant is present based
on wind patterns and soil type and on the basis of surface soil texture. This design is useful for estimating a
parameter when the target population is heterogeneous and the area can be subdivided based on expected contamination levels. Advantages of this sampling design are that it has potential for achieving greater precision in estimates of the mean and variance, and that it allows computation of reliable estimates for population subgroups of special interest. Greater precision can be obtained if the measurement of interest is strongly correlated with the variable used to make the strata.
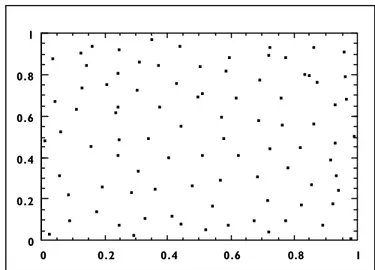
2.4.4 Systematic and Grid Sampling
Systematic Grid Sampling - Square Grid Systematic Grid Sampling - Triangular Grids
Figure 2-4. Systematic/Grid Sampling
of systematic grids include square, rectangular, triangular, or radial grids [Section 16.6.2 of Myers (1997)].
In random systematic sampling, an initial sampling location (or time) is chosen at random and the remaining sampling sites are specified so that they are located according to a regular pattern (Cressie, 1993) for example, at the points identified by the intersection of each line in one of the grids shown in Figure 2-4. Systematic and grid
sampling is used to search for hot spots and to infer means, percentiles, or other
parameters and is also useful for estimating spatial patterns or trends over time. This design provides a practical and easy method for designating sample locations and ensures uniform coverage of a site, unit, or process.
2.4.5 Ranked Set Sampling
Ranked set sampling is an innovative design that can be highly useful and cost efficient in obtaining better estimates of mean concentration levels in soil and other environmental media by
explicitly incorporating the professional judgment of a field investigator or a field screening measurement method to pick specific sampling locations in the field. Ranked set sampling uses a two-phase sampling design that identifies sets of field locations, utilizes inexpensive measurements to rank locations within each set, and then selects one location from each set for sampling.
In ranked set sampling, m sets (each of size r) of field locations are identified using simple random sampling. The locations are ranked independently within each set using professional judgment or inexpensive, fast, or surrogate measurements. One sampling unit from each set is then selected (based on the observed ranks) for subsequent measurement using a more accurate and reliable (hence, more expensive) method for the contaminant of interest. Relative to simple random sampling, this design results in more representative samples and so leads to more precise estimates of the population parameters.
Figure 2-6. Composite Sampling
Population Grid with Shaded Areas of Interest and Initial Simple Random Sample
X X X X X
X X X
X
X X X
X
X X X
X
X X X
X X X X
X X X X
X X X
X X X X
X X X X
X X
X X X
X
X X
X
X X XXX
X
X X X X
X X X X X X X
X
Final Adaptive Cluster Sampling Results X = Sampling unit
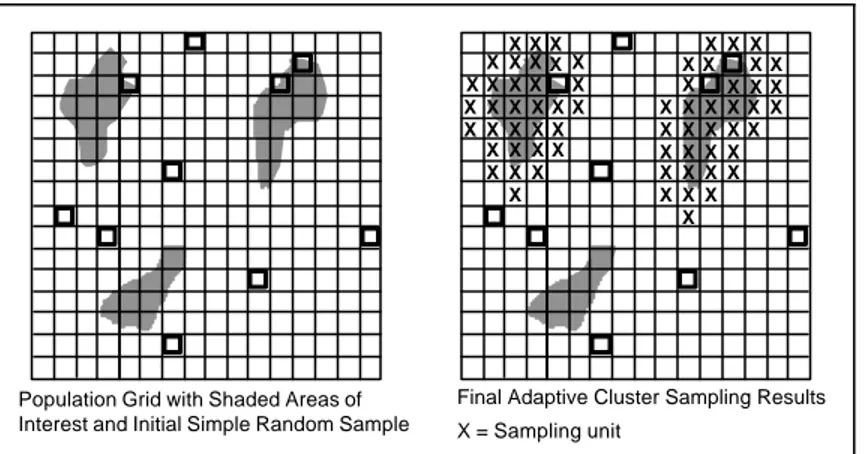
Figure 2-5. Adaptive Cluster Sampling 2.4.6 Adaptive Cluster Sampling
In adaptive cluster sampling, n samples are taken using simple random sampling, and additional samples are taken at locations where measurements exceed some threshold value. Several additional rounds of sampling and analysis may be needed. Adaptive cluster sampling tracks the selection probabilities for later phases of sampling so that an unbiased estimate of the population mean can be calculated despite oversampling of certain areas. An example application of adaptive cluster sampling is delineating the borders of a plume of contamination.
Initial and final adaptive sampling designs are shown in Figure 2-5. Initial measurements are made of randomly selected primary sampling units using simple random sampling (designated by squares in Figure 2-5). Whenever a sampling unit is found to show a characteristic of interest (for example, contaminant concentration of concern, ecological effect as indicated by the shaded areas in the figure), additional
sampling units adjacent to the original
unit are selected, and measurements are made.
Adaptive sampling is useful for estimating or searching for rare characteristics in a population and is appropriate for inexpensive, rapid measurements. It enables delineating the boundaries of hot spots, while also using all data collected with appropriate weighting to give unbiased estimates of the
population mean.
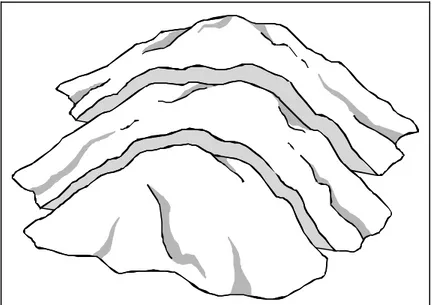
2.4.7 Composite Sampling
In composite sampling (illustrated in Figure 2-6), volumes of material from several of the selected sampling units are physically combined and mixed in an effort to form a single
Compositing is often used in conjunction with other sampling designs when the goal is to estimate the population mean and when information on spatial or temporal variability is not needed. It can also be used to estimate the prevalence of a rare trait. If individual aliquots from samples
CHAPTER 3
THE SAMPLING DESIGN PROCESS 3.1 OVERVIEW
What are the objectives of the sampling design process?
The sampling design process should match the needs of the project with the resources available. The needs generally consist of the study objectives and the tolerable limits on uncertainty. The resources may include personnel, time, and availability of financial resources. The goal of the process is to use all of the information available so that the data collected meets the needs of the decision maker.
Who is typically involved in the sampling design process?
The sampling design process typically includes a multi-disciplinary group (such as a DQO development team) that is involved in systematic planning at the beginning and at key review points. This team should include the decision maker or end user of the data. More rigorous technical activities will likely be performed by statisticians or by environmental scientists or engineers who have training and experience in environmental statistics.
3.2. INPUTS TO THE SAMPLING DESIGN PROCESS
What outputs from the systematic planning process are incorporated into the sampling design process?
Step 1. State the Problem
Define the problem; identify the planning team; examine budget, schedule.
Step 2. Identify the Decision
State decision; identify study question; define alternative actions.
Step 3. Identify the Inputs to the Decision Identify information needed for the decision (information sources, basis for Action Level, sampling/analysis method).
Step 4. Define the Boundaries of the Study Specify sample characteristics; define spatial/temporal limits, units of decision making.
Step 5. Develop a Decision Rule
Define statistical parameter (mean, median); specify Action Level; develop logic for action.
Step 6. Specify Tolerable Limits on Decision Errors Set acceptable limits for decision errors relative to consequences (health effects, costs).
Step 7. Optimize the Design for Obtaining Data Select resource-effective sampling and analysis plan that meets the performance criteria.
DQOs are qualitative and quantitative statements, developed in the first six steps of the
DQO Process (Figure 3-1), that define the purpose for the data collection effort, clarify the kind of data needed, and specify the limits on decision errors needed for the study. These outputs are used in the final DQO step to develop a sampling design that meets the performance criteria and other design constraints. The DQO Process helps investigators ensure that the data collected are of the right type, quantity, and quality needed to answer research questions or support environmental decisions, and ensures that valuable resources are spent on collecting only those data necessary to support defensible decisions.
The DQO Process is a systematic planning approach for data collection that is based on the scientific method and uses a seven-step process. Although the DQO Process is typically described in linear terms, it is really a flexible process that relies on iteration and modification as the planning team works through each step, thus allowing early steps to be revised in light of information developed from subsequent steps.
The Steps of the DQO Process
Step 1: State the Problem. This step defines the problem clearly, identifies the primary decision maker and planning team members, and determines the available budget, personnel, and schedule deadlines.
Step 2: Identify the Decision. The key activities are to develop an appropriate decision statement: identify the principal study question, define alternative actions that could result from resolving the principal study question, link the principal study question to possible actions, and organize multiple decisions.
Step 3: Identify the Inputs to the Decision. These activities include identifying the type and sources of information needed to resolve the decision statement, identifying information needed to establish the action level, and confirming that suitable methods exist.
define the population of interest, defines the spatial and temporal boundaries, defines the scale of decision making, and identifies any practical constraints on data collection.
Step 5: Develop a Decision Rule. This step develops a decision rule, a statement that allows the decision maker a logical basis for choosing among alternative actions, by determining the parameter of interest, action level, scale of decision making, and outlining alternative actions.
Step 6: Specify Tolerable Limits on Decision Errors. This step determines the decision maker’s tolerable limits on potential decision errors by identifying the decision errors and base-level assumptions, specifying a range of possible parameter values where the consequences of decision errors are relatively minor, and assigning probability values to the probability for the occurrence of potential decision errors.
Step 7: Optimize the Design for Obtaining Data. This final step identifies a resource-effective sampling design for data collection for generating data. This design is then expected to satisfy the DQOs. Meeting or exceeding the DQOs is the goal of selection of sampling design.
By using the DQO Process, the planning team clarifies study objectives, defines the appropriate types of data, and specifies tolerable levels of potential decision errors that will be used to establish the quality and quantity of data needed to support decisions. Through this process, the planning team can examine trade-offs between the uncertainty of results and cost of sampling and analysis in order to develop designs that are acceptable to all parties involved. These are all important inputs to the sampling design process.
What information will be needed to implement the sampling design process?
The information needed includes outputs from the systematic planning process (for example, the outputs from Steps 1 through 6 of the DQO Process) and specific information about contributing factors about the specific problem that could influence the choice of design. The categories of factors that should be used in developing a sampling design are shown in Figure 3-2 and include:
Information About the Process or Area of Concern includes the conceptual model and any additional information about the process or area (for example, any secondary data from the site that are available, including results from any pilot studies).
Data Quality Information that is needed as input to the sampling design process is mainly from the DQO Process and include:
Data Quality Information Information About The
Process or Area of Concern
ConceptualModel of the Potential Environmental Hazard
Size/Breadth of Area of Concern
Media of concern
Distributions of Contaminant
Sources of Variability
Chemical/Physical Properties of Contaminant
Additional Information About the Process or Area
Sampling/Analysis Constraints Time/Schedule Constraints Geographical Constraints Budget Constraints Compositing Constraints
Constraints
Purpose of Data Collection
Spatial and Temporal Boundaries of Study Preliminary Estimates of Variance Statistical Parameter of Interest Tolerance for Potential Decision Errors
Overall Precision Requirements (width of the gray region)
Sample Support
Choice of Sampling Design
Figure 3-2. Factors in Selecting a Sampling Design
reject or support a finding that the specified parameters of two populations differ), estimating a parameter with a level of confidence, or detecting hot spots (DQO Step 5).
C The target population and spatial/temporal boundaries of the study (DQO Step 4).
C Preliminary estimation of variance (DQO Step 4).
C The statistical parameter of interest, such as mean, median, percentile, trend, slope, or percentage (DQO Step 5).
C Limits on decision errors and precision, in the form of false acceptance and false rejection error rates and the definition of the gray region (overall precision specifications) (DQO Step 6).
Constraints are principally sampling design and budget.
It is important to carefully consider early in the design phase the sample support of the data to be collected and the proposed method of conducting the chemical analysis. The sample support is the physical size, shape, and orientation of material that is extracted from the sampling unit and subjected to the measurement protocol. In other words, the sample support comprises the portion of the sampling unit that is actually available to be measured or observed, and therefore to represent the sampling unit. Consequently, the sample support should be chosen so that the measurement protocol captures the desired characteristics of the sampling unit, given the inherent qualities of and variability within the sampling unit, and is consistent with the objectives of the study. The specification of sample support also should be coordinated with the actual physical specifications of the chosen analytical method(s) to ensure that a sufficient quantity of material is available to support the needed analyses. Usually, the analytical method needs a much smaller amount of material than that needed for the sample support to represent the sampling unit. In that case, the measurement protocol will specify how the sample support will be processed and subsampled to yield the amount of material needed for analysis.
Some examples will help clarify how sample support relates to sampling units and analytical methods. Consider a study that is designed to estimate average arsenic contamination in surface soil at a site. The project team may decide to divide the site into square sampling units that are 3 meters on each side and 10 centimeters deep. Given their knowledge of variability experienced at other sites, the project team may decide that the sample support needed to properly characterize a sampling unit is the area and volume of soil that can be obtained by taking 9 soil cores, each 15 cm in diameter and 10 cm deep. Consider another example in which a study is designed to estimate average mercury
contamination in fish. The project team may decide that the sampling unit is an individual fish, and the sample support is the type and mass of fish tissue extracted from each fish, which they might specify in a table. In both of the above examples, an analytical chemist would confirm that the sample support would provide a sufficient amount of soil or fish tissue to conduct the analytical procedures needed to characterize the concentrations of arsenic in soil or mercury in fish. Sometimes the sample support is an integral part of the analytical result. For example, when sampling water for the occurrence of
microbiological contaminants such as chryptosporidium, water is passed through filters and the filters are then processed and examined to count the number of organisms. The volume of water filtered constitutes the sample support and also is used directly in the calculation of the occurrence rate (i.e., number of organisims per volume of water). In all cases, the sample support is chosen to ensure that the measurement protocol will reliably characterize the sampling unit in a way that is consistent with the study objectives. The study objectives are defined during systematic planning, such as in DQO Steps 1 and 2. The definition of the sampling unit and selection of sampling support will depend strongly on the study boundaries defined in DQO Step 4, and on the performance criteria developed in DQO Step 6.
Review planning outputs
Develop general design alternatives
Formulate mathematical expressions for performance and cost of
each design
Determine sample size that satisfies performance criteria and constraints
Choose the most resource-effective design
Document the design in the QA Project Plan
Figure 3-3. The Sampling Design
sample collection method, or weather constraints (for example, performance of field technologies at low temperature, high humidity, or the ability to collect samples during certain seasons or types of weather). Time/schedule constraints could include seasonal constraints such as the relationship of exposure to season (for example, solvent volatility in warmer weather) and the availability of certified professionals. Geographic constraints could include physical barriers that may preclude sampling (for example, rivers, fences) and also any possible hindrance to the ability to accurately identify sample location. Budget constraints should take into account the entire data collection process—from the collection of the sample in the field, including transport and storage, to analysis of the samples and data entry and validation. Compositing constraints could include the decision on representativeness of the physical sample taken at a location or station, or the ability to physically mix samples both in the field and in the laboratory.
In addition to these categories, sampling design development should also take into account existing regulations and requirements (for example, state, municipal) if they apply. Finally, any possible secondary uses of the data should be considered to the extent possible.
3.3 STEPS IN THE SAMPLING DESIGN PROCESS
Steps of the sampling design process are represented in Figure 3-3 and described below.
Review the systematic planning outputs. First, the sampling objectives need to be stated clearly. Next, make sure the acceptance or performance criteria are specified adequately (such as probability limits on decision errors or estimation intervals). Then review the constraints regarding schedule, funding, special
equipment and facilities, and human resources.
Develop general sampling design
alternatives. Decide whether the approach will involve episodic sampling events (where a sampling design is established and all data for that phase are collected according to that design) or an adaptive strategy (where a sampling protocol is established and sampling units are selected in the field, in accordance with the protocol, based on results from previous sampling for that phase). Consider sampling designs that are compatible with the sampling objectives. Evaluate advantages,
specific conditions of the study including the anticipated costs for possible alternative sampling strategies.
Formulate mathematical expressions for the performance and cost of each design alternative. For each design, develop the necessary statistical model or mathematical formulae needed to determine the performance of the design, in terms of the desired statistical power or width of the confidence interval. This process usually involves developing a model of relevant components of variance and estimating the total variance, plus key components as necessary. Also for each design, develop a cost model that addresses fixed costs (such as mobilization and setup costs) and variable costs (such as labor hours per sample and analytical costs per sample). Note that this step is not used in judgmental sampling designs. Assistance from a statistician will be needed to develop these formulae for more complex designs; formulae for the simpler designs are provided in the appendices to the chapters in this guidance.
Determine the sample size that satisfies the performance criteria and constraints.
Calculate the optimal sample size (and sample allocation, for stratified designs or other more complex designs). This guidance document provides formulae for estimating sample sizes needed for the different designs. Trade-offs may be needed between less precise, less expensive measurement protocols (that allow for more sampling units to be selected and measured) and more precise, more expensive measurement protocols (that provide better characterization of each sampling unit at the expense of allowing fewer sampling units to be selected and measured). Care has to be taken to ensure that the trade-offs made do not change the inferences from the initially planned design. For example, the use of compositing designs needs to agree with the initial concepts of exposure or goal of the study.
If none of the designs are feasible (i.e., performance specifications cannot be satisfied within all constraints), then consider the following possible corrective actions listed below. Note that this step is not used in judgmental sampling designs because performance criteria are not explicitly considered.
C Consider other, more sophisticated, sampling designs.
C Relax performance specifications (for example, increase the allowable probability of committing a decision error) at the expense of increasing decision error risk.
C Relax one or more constraints (for example, increase the budget).
C Reevaluate the sampling objectives (for example, increase the scale of decision making, reduce the number of sub-populations that need separate estimates, or consider surrogate or indicator measurements).
personnel and the community, and any other relevant issues of concern to those involved with the project. Finally, obtain agreement within the planning team on the appropriate design.
Document the design in the QA Project Plan. Provide details on how the design should be implemented, contingency plans if unexpected conditions or events arise in the field, and quality
assurance (QA) and quality control (QC) that will be performed to detect and correct problems and ensure defensible results. Specify the key assumptions underlying the sampling design, particularly those that should be verified during implementation and assessment. Details on how to write a QA Project Plan can be found in Guidance for Quality Assurance Project Plans (QA/G-5) (EPA, 1998b).
3.4 SELECTING A SAMPLING DESIGN
Table 3-1 presents examples of problem types that one may encounter and suggests sampling designs that are relevant for these problem types in particular situations.
Table 3-1. Choosing the Appropriate Sampling Design for Your Problem
If you are... and you have... consider using... in order to...
performing a screening phase of an investigation of a relatively small-scale problem
a limited budget and/or a limited schedule
judgmental sampling assess whether further investigation is warranted that should include a statistical probabilistic sampling design.
developing an understanding of when contamination is present
an adequate budget for the number of samples needed
systematic sampling acquire coverage of the time periods of interest.
developing an understanding of where contamination is present
an adequate budget for the number of samples needed
grid sampling acquire coverage of the area of concern with a given level of confidence that you would have detected a hot spot of a given size.
estimating a population mean
an adequate budget systematic or grid sampling
also produce information on spatial or temporal patterns.
budget constraints and analytical costs that are high compared to sampling costs
Table 3-1. Choosing the Appropriate Sampling Design for Your Problem
If you are... and you have... consider using... in order to...
budget constraints and professional knowledge or inexpensive screening measurements to assess the relative amounts of the contaminant at specific field sample locations
ranked set sampling reduce the number of analyses needed for a given level of precision.
estimating a population mean or proportion
spatial or temporal information on contaminant patterns
stratified sampling increase the precision of the estimate with the same number of samples, or achieve the same precision with fewer samples and lower cost.
delineating the boundaries of an area of contamination
a field screening method adaptive cluster sampling
simultaneously use all observations in estimating the mean
estimating the prevalence of a rare trait
analytical costs that are high compared to sampling costs
random sampling and composite sampling
produce an equally precise (or a more precise) estimate of the prevalence with fewer analyses and lower cost.
attempting to identify population units that have a rare trait (for a finite population of units)
the ability to physically mix aliquots from the samples and then retest additional aliquots
composite sampling and retesting
classify all units at reduced cost by not analyzing every unit.
attempting to identify population unit(s) that have the highest contaminant levels (for a finite population of units)
the ability to physically mix aliquots from the samples and then retest additional aliquots
composite sampling and retesting
CHAPTER 4
JUDGMENTAL SAMPLING 4.1 OVERVIEW
Judgmental sampling refers to the selection of sample locations based on professional judgment alone, without any type of randomization. Judgmental sampling is useful when there is reliable historical and physical knowledge about a relatively small feature or condition. As discussed in Quality
Assurance Guidance for Conducting Brownfields Site Assessments (EPA, 1998a), whether to employ a judgmental or statistical (probability-based) sampling design is the main sampling design decision. This design decision applies to many environmental investigations including Brownsfield investigations. An important distinction between the two types of designs is that statistical sampling designs are usually needed when the level of confidence needs to be quantified, and judgmental sampling designs are often needed to meet schedule and budgetary constraints.
Implementation of a judgmental sampling design should not be confused with the application of professional judgment (or the use of professional knowledge of the study site or process). Professional judgment should always be used to develop an efficient sampling design, whether that design is
judgmental or probability-based. In particular, when stratifying a population or site, exercising good professional judgment is essential so that the sampling design established for each stratum is efficient and meaningful.
4.2 APPLICATION
For soil contamination investigations, judgmental sampling is appropriate for situations in which any of the following apply:
C Relatively small-scale features or conditions are under investigation.
C An extremely small number of samples will be selected for analysis/characterization.
C There is reliable historical and physical knowledge about the feature or condition under investigation.
C The objective of the investigation is to screen an area(s) for the presence or absence of contamination at levels of concern, such as risk-based screening levels (note that if such contamination is found, follow-up sampling is likely to involve one or more statistical designs).