Differential effects of local habitat and landscape characteristics on bird communities in Mediterranean afforestations motivated by the EU Common Agrarian Policy
29
0
0
Texto completo
(2) *Manuscript Click here to download Manuscript: Main text - revised_2.doc Click here to view linked References. 1 2 3 4 5 6 7 8 9 10 11 12 13 14 15 16 17 18 19 20 21 22 23 24 25 26 27 28 29 30 31 32 33 34 35 36 37 38 39 40 41 42 43 44 45 46 47 48 49 50 51 52 53 54 55 56 57 58 59 60 61 62 63 64 65. 1. Differential effects of local habitat and landscape characteristics on bird. 2. communities in Mediterranean afforestations motivated by the EU Common. 3. Agrarian Policy. 4. SÁNCHEZ-OLIVER1, J.S., REY BENAYAS1*, J.M. and CARRASCAL, L.M.2. 5. 1. 6. Alcalá de Henares, Spain. Tel. +34 91 8856408, Fax +34 91 8854929 (e-mail:. 7. [email protected]). 8. 2. 9. CSIC, José Gutiérrez Abascal, 2, 28006 Madrid, Spain (e-mail:. : Dpto. de Ciencias de la Vida, Edificio de Ciencias, Universidad de Alcalá, 28871. : Dpto. Biodiversidad y Biología Evolutiva, Museo Nacional de Ciencias Naturales,. 10. [email protected]). 11. 1. *: Corresponding author: Tel. +34 (9)1 8854987; e-mail: [email protected]. 12. 1.
(3) 1 2 3 4 5 6 7 8 9 10 11 12 13 14 15 16 17 18 19 20 21 22 23 24 25 26 27 28 29 30 31 32 33 34 35 36 37 38 39 40 41 42 43 44 45 46 47 48 49 50 51 52 53 54 55 56 57 58 59 60 61 62 63 64 65. 13. Abstract. 14. We investigated the effects of local habitat structure and surrounding landscape. 15. characteristics (proportion of land use types and connectedness) on species density and. 16. composition of bird communities inhabiting the interior of young tree plantations on. 17. former cropland in central Spain, which were motivated by the Common Agrarian. 18. Policy. Variation of species density (number of species per 0.78 ha) among tree. 19. plantations showed different environmental associations across seasons: local habitat. 20. was more important than landscape characteristics during winter, while they were. 21. similarly important during spring. Species density increased with the development of. 22. the tree layer in winter, and with the presence of urban areas around tree plantations and. 23. cover of the herbaceous layer within them in the breeding season. We identified 15. 24. species that exhibit high relative abundance in woodland habitats within the. 25. Mesomediterranean region of Central Spain that were absent in both seasons in the. 26. studied tree plantations, which were an attractive habitat for urban exploiter species but. 27. an unfavourable habitat for the regional forest species pool except for forest generalist. 28. species. Composition of bird assemblages was more related to local habitat structure. 29. than to landscape characteristics around tree plantations, and was rather similar in. 30. winter and spring seasons. The very different effects of local habitat and landscape. 31. characteristics on bird communities make difficult suggesting management practices. 32. with positive effects for all avifauna species during the entire year. We conclude that the. 33. small size and low maturity of the studied tree plantations do not contribute to. 34. enhancing the bird diversity value of current CAP aids to afforest former cropland with. 35. pines in the Mediterranean region.. 36. 2.
(4) 1 2 3 4 5 6 7 8 9 10 11 12 13 14 15 16 17 18 19 20 21 22 23 24 25 26 27 28 29 30 31 32 33 34 35 36 37 38 39 40 41 42 43 44 45 46 47 48 49 50 51 52 53 54 55 56 57 58 59 60 61 62 63 64 65. 37. Keywords: Bird assemblages; Forest generalist species; Land use; Seasonal variation;. 38. Species density; Tree plantation. 3.
(5) 1 2 3 4 5 6 7 8 9 10 11 12 13 14 15 16 17 18 19 20 21 22 23 24 25 26 27 28 29 30 31 32 33 34 35 36 37 38 39 40 41 42 43 44 45 46 47 48 49 50 51 52 53 54 55 56 57 58 59 60 61 62 63 64 65. 39. Introduction. 40. Features of animal assemblages respond to the characteristics of both the local. 41. habitat and the landscape that surround such habitat, and these two sets of. 42. characteristics can interact affecting species composition and abundance (Fischer et al.. 43. 2011; Geiger et al. 2010; Moreno-Mateos et al. 2011; Piha et al. 2007; Wretenberg et al.. 44. 2010). On the other hand, human activities may profoundly modify land cover and. 45. vegetation structure at both levels and, consequently, affect the composition and. 46. abundance of local communities (Blondel 1990; Heikkinen et al. 2004).. 47. Large tracts of cropland and pastureland have been reforested in the world in. 48. recent decades by tree plantations or by secondary succession. Seven per cent of the. 49. forest land is tree plantations at present and their annual rate is growing as compared to. 50. afforestation by secondary succession (FAO 2011; Rey Benayas and Bullock 2012).. 51. These tree plantations have noticeable effects on both the abiotic environment and. 52. biological communities (Bremer and Farley 2010; Gómez-Aparicio et al. 2009; Munro. 53. et al. 2009; Poschlod et al. 2005), particularly on birds that are a taxonomic group of. 54. high indicator value (Felton et al. 2010; Lindenmayer et al. 2010; Rey Benayas et al.. 55. 2010; Santos et al. 2006). In the European Union, the Common Agrarian Policy (CAP). 56. has favoured the transformation of farmland into tree plantations since 1993 by means. 57. of a scheme of aid for forestry measures in agriculture (EEC Council Regulation No.. 58. 2080/92), which has resulted on the afforestation of ca. 921,210 ha to date (Directorate-. 59. General for Agriculture and Rural Development 2012). This afforestation program. 60. pursues both societal and environmental benefits, including control of erosion,. 61. prevention of desertification, regulation of the water regime, and increasing the fixation. 62. rate of carbon dioxide. The amount of afforested farmland will likely increase in a near 4.
(6) 1 2 3 4 5 6 7 8 9 10 11 12 13 14 15 16 17 18 19 20 21 22 23 24 25 26 27 28 29 30 31 32 33 34 35 36 37 38 39 40 41 42 43 44 45 46 47 48 49 50 51 52 53 54 55 56 57 58 59 60 61 62 63 64 65. 63. future in some European regions due to subsidies to vineyard extirpation (e.g. 93,600 ha. 64. were extirpated in Spain in the 2008-2011 period of which 73.1% belonged to La. 65. Mancha; Spanish Agrarian Guarantee Fund 2012) together with subsidies to. 66. afforestation of former vineyards, which aim to ensure EU wine production matches. 67. demand and eliminate wasteful public intervention in EU wine markets (Regulation. 68. (EC) 479/2008).. 69. Cropland afforestations in southern Europe are mostly based on coniferous. 70. species such as Pinus halepensis and P. pinaster. Afforested fields usually form an. 71. archipelago of man-made woodland habitat in the dominant agricultural matrix. These. 72. plantations may adversely affect open habitat species that are of conservation concern in. 73. Europe, including birds, by replacing high quality steppe habitat and increasing risk of. 74. predation (Cresswell 2008; Díaz et al. 1998; Reino et al. 2010). However, they may. 75. offer opportunities to woodland birds, providing suitable habitats for generalist species. 76. (Rey Benayas et al. 2010). On the other hand, agricultural land abandonment and active. 77. afforestation should not be assumed to always benefit conservation, as it has been. 78. shown for birds of different biogeographic origin in agricultural lands of the. 79. Mediterranean region (increase in diversity with successional stage for Eurosiberian. 80. birds but not for Mediterranean species; Suárez-Seoane et al. 2002). Species-area. 81. relationships for bird communities in natural forests and pine plantations of Spain have. 82. been previously studied in detail (e.g. Díaz et al. 1998; Santos et al. 2006),. 83. demonstrating a very tight relationship between the area of forest islands and species. 84. richness. Nevertheless, little is known about how local species richness at standardized. 85. area units (i.e., species density) is affected by the surrounding landscape while taking. 86. into account habitat characteristics of the focal tree plantation. 5.
(7) 1 2 3 4 5 6 7 8 9 10 11 12 13 14 15 16 17 18 19 20 21 22 23 24 25 26 27 28 29 30 31 32 33 34 35 36 37 38 39 40 41 42 43 44 45 46 47 48 49 50 51 52 53 54 55 56 57 58 59 60 61 62 63 64 65. 87. In this study we aim to assess the wintering and breeding bird communities in. 88. young tree plantations (<20 years old) motivated by the CAP that are embedded in. 89. Mediterranean agricultural landscapes of Central Spain. These plantations are located at. 90. the south-western limit of the Palaearctic, a region with impoverished woodland. 91. avifauna dominated by species of Mediterranean origin and woodland generalists. 92. (Carrascal and Díaz 2003; Monkkonen 1994; Tellería and Santos 1994), and a strong. 93. seasonality in abiotic conditions and productivity that imposes widely different. 94. ecological scenarios throughout the year on the communities living in them (Newton. 95. 2007). They are established in small patches over a predominantly treeless landscape. 96. dominated by herbaceous or woody crops, where large mature forests of holm oaks that. 97. may serve as sources of woodland bird species are very scarce. Therefore, the avifauna. 98. in the plantations should be highly influenced by that inhabiting the surrounding. 99. landscape. This biogeographic scenario combined with the current CAP subsidies for. 100. afforestation on former arable land allow us testing the importance of local habitat. 101. characteristics and larger-scale features (e.g. the land cover surrounding the tree. 102. plantations) on bird assemblages. Moreover, the analysis of the responses of birds that. 103. colonize the interior of these afforestations in two contrasting seasons may. 104. proportionate insights about the temporal generality of their effects and suggest. 105. management practices that favour the implementation of friendly afforestation projects. 106. for woodland avifauna within deforested landscapes of the Mediterranean region on a. 107. seasonal basis.. 108 109. Methods. 110. Study area 6.
(8) 1 2 3 4 5 6 7 8 9 10 11 12 13 14 15 16 17 18 19 20 21 22 23 24 25 26 27 28 29 30 31 32 33 34 35 36 37 38 39 40 41 42 43 44 45 46 47 48 49 50 51 52 53 54 55 56 57 58 59 60 61 62 63 64 65. 111. Field work was conducted in tree plantations located in Campo de Montiel (La Mancha,. 112. situated in the southern Spanish plateau). The study area is ca. 440 km2 within UTM. 113. coordinates x1 4305423, x2 4272951, y1 458025 and y2 483525 (zone 30S; Figure in. 114. Appendix 1). Altitude ranges between 690 and 793 m a.s.l. The climate is continental. 115. Mediterranean with dry and hot summers and cold winters. Mean annual temperature. 116. and total annual precipitation in the area during the last 30 years were 13.7 °C and 390. 117. mm, respectively (retrieved from http://www.aemet.es/). These figures were 16.6 °C. 118. and 359.9 mm in 2011, when our bird surveys took place.. 119. The area is a representative mosaic of different crops and semi-natural or. 120. introduced woody vegetation that is characteristic of large areas in Mediterranean. 121. landscapes. Croplands were mostly occupied by herbaceous crops (wheat and barley),. 122. harvested once a year in June, and permanent woody crops (olive trees — three to five. 123. meters high, and vineyards — 1 m high). Natural vegetation mostly consisted of holm. 124. oak Quercus rotundifolia L. woodland and riparian forests that have been mostly. 125. extirpated from this region. Until 1992, woodland cover was restricted to open holm oak. 126. patches, usually grazed by sheep and goats. However, as in many other Mediterranean. 127. landscapes, the agricultural land is subjected to intensive management (e.g., irrigation of. 128. vineyards and olive groves) and land use change. A major result of land use change is. 129. the abandonment of herbaceous cropland and vineyard extirpation and their. 130. afforestation with the native Aleppo pine Pinus halepensis Mill. alone or mixed with. 131. holm oak and Retama sphaerocarpa (L.) Boiss., which has increased forest land in the. 132. last 20 years. These tree plantations are noticeably dominated by pines as they establish. 133. better and grow faster than the other planted species. Thus, height and diameter at breast. 134. height (dbh) of dominant pines are surrogates of the age of tree plantations. 7.
(9) 1 2 3 4 5 6 7 8 9 10 11 12 13 14 15 16 17 18 19 20 21 22 23 24 25 26 27 28 29 30 31 32 33 34 35 36 37 38 39 40 41 42 43 44 45 46 47 48 49 50 51 52 53 54 55 56 57 58 59 60 61 62 63 64 65. 135 136. Bird survey. 137. First, all young forest plantations in the study area were identified using both orto-. 138. photos (Geographic Information System of Farming Land 2010; hereafter SigPac) and. 139. Google Earth®, and were later verified in the field. We found 99 plantations that were. 140. established in 1992 or later. Next, we selected the plantations to be surveyed for birds,. 141. excluding those smaller than 1 ha: 61 forest plantations with a mean area of 4.82 ha (sd. 142. = 5.61; larger plantation = 36.5 ha). Average spacing distance between studied. 143. plantations was 11.7 km (see Figure 1 in Appendix 1). Pruning and thinning are the. 144. management practices performed on these plantations that modify their vegetation. 145. structure; 26 of our surveyed plantations were pruned, 16 of which were also thinned.. 146. Species abundance and density were quantified by means of circular plot. 147. censuses that were carried out in winter (January and February) and spring (April and. 148. May) 2011, to study wintering and breeding bird communities, respectively. Every tree. 149. plantation was represented by one circular plot located at the centre of the plantation.. 150. Census method consisted of point-counts (Bibby et al. 2000), ten minutes long each,. 151. recording all birds detected visually and/or acoustically within the 50-m radius plot. 152. (0.78 ha). We noted the presence of every bird species during the 10 minutes except if. 153. individuals were over-flying the plot. Two censuses of each plot were carried out in. 154. each season, one in the morning between sunrise and 3 hours later and one in the. 155. evening two hours before sunset. The relative abundance of each species and local. 156. species density (i.e., number of species per 0.78 ha) were estimated using the average of. 157. the two censuses in each season. The small area covered by the plots, and the relatively. 158. long time devoted to bird counts (accumulated census time of 20 minutes in each 8.
(10) 1 2 3 4 5 6 7 8 9 10 11 12 13 14 15 16 17 18 19 20 21 22 23 24 25 26 27 28 29 30 31 32 33 34 35 36 37 38 39 40 41 42 43 44 45 46 47 48 49 50 51 52 53 54 55 56 57 58 59 60 61 62 63 64 65. 159. season), maximizes the detection probability of species within the area of 0.78 ha and,. 160. thus, the accurate estimations of local species density and abundance (Shiu and Lee. 161. 2003). This time invested in bird census (25.6 min ha-1) is considerably longer than that. 162. used in previous studies recording species richness in woodland islands (e.g., 10.2 min-1. 163. in pine plantations sampled by Díaz et al. 1998). Otherwise, our purpose was not to. 164. exhaustively characterize the avifauna of each plantation, but to analyze the variation of. 165. local species density in the interior of this novel habitat of an archipelago of young and. 166. small afforestations that punctuates the agricultural landscape. All censuses were. 167. conducted by the same well trained field ornithologist (JS S-O) on windless and rainless. 168. days.. 169. To have a reference of the avifauna that potentially can colonize the studied. 170. plantations, we used the habitat breadth of the bird species in 15 main habitat categories. 171. as well as their relative abundance in woodlands within the Mesomediterranean region. 172. of Central Spain obtained from Carrascal and Palomino (2008).. 173 174. Local habitat and landscape variables. 175. We characterized two sets of variables related to tree plantations, namely (i) local. 176. habitat variables, which included vegetation in the bird census plots and area of the. 177. plantations, and (ii) landscape variables, which included tree plantation connectivity and. 178. land use around plantations.. 179. (i) Vegetation structure and composition of main plant species at each surveyed. 180. forest plantation were measured in a 25-m radius plot and a 10-m radius plot that. 181. coincided with the centres of the bird census plots. This sampling was carried out before. 182. the spring bird census. In the 25-m radius plots, we directly counted or estimated by 9.
(11) 1 2 3 4 5 6 7 8 9 10 11 12 13 14 15 16 17 18 19 20 21 22 23 24 25 26 27 28 29 30 31 32 33 34 35 36 37 38 39 40 41 42 43 44 45 46 47 48 49 50 51 52 53 54 55 56 57 58 59 60 61 62 63 64 65. 183. eye, after previous training, the following structural features of the vegetation:. 184. percentage cover of chamaephytes, shrubs and trees, average height of chamaephytes,. 185. shrubs and trees, and number of trunks <5, 5-10, 10–20, 20–40 and >40cm in dbh. In. 186. the 10-m radius plots, we estimated percentage cover of herbs and bare soil and. 187. measured the average height of the herb layer. All vegetation measurements (Table 1). 188. were carried out by the same observer (JS S-O) to avoid inter-personal bias.. 189. (ii) Land use types were identified by means of land use layers taken from. 190. SigPac (see source above). They were analyzed with ArcGIS 10.0 in 1-km buffer-. 191. rings from the center of each forest plantation; on each buffer-ring, the percentage of. 192. area occupied by each land use type was obtained, resulting in the figures shown in. 193. Table 1. Finally, for a target plantation, structural connectedness was measured as the. 194. average distance of the three closest plantations or natural woodland patches weighted. 195. by the area of such plantations or woodland patches (Table 1).. 196 197. Statistical analyses. 198. The effects of pruning on the development of the tree layer was tested by means of a. 199. MANOVA on percentage of tree cover, height of the tree layer, dbh, and number of. 200. trunks > 5 cm.. 201. The relationships of species density and species composition with local habitat. 202. and landscape predictor variables, were separately analysed for the winter and the. 203. breeding season by means of Partial Least Squares Regressions (hereafter PLSR; Abdi. 204. 2007). Sample units for these analyses were the 61 census plots in the tree plantations.. 205. Results obtained with PLSR are similar to those from conventional multiple regression. 206. techniques; however, PLSR allows for the simultaneous analysis of multiple response 10.
(12) 1 2 3 4 5 6 7 8 9 10 11 12 13 14 15 16 17 18 19 20 21 22 23 24 25 26 27 28 29 30 31 32 33 34 35 36 37 38 39 40 41 42 43 44 45 46 47 48 49 50 51 52 53 54 55 56 57 58 59 60 61 62 63 64 65. 207. variables, and it is extremely robust to the effects of low sample size (i.e. overfitting). 208. and high degree of correlation between predictor variables (i.e. severe multi-. 209. collinearity) (Carrascal et al. 2009). PLSR establishes associations between the response. 210. variables and factors extracted from the predictor variables that maximize the explained. 211. variance in the response variables. These factors are defined as linear combinations of. 212. predictors, so the original multidimensionality is reduced to a lower number of. 213. orthogonal factors to detect structure in the relationships between predictor variables. 214. and between these factors and the response variables. The relative contribution of each. 215. predictor to the extracted factors was calculated by means of the square of predictor. 216. weights. The PLSR components regarding species composition were obtained based on. 217. the abundance of those species with >0.1 birds/census plot; the abundance of 12 species. 218. in winter and 17 species in spring defined the response variables that were summarized. 219. in composition components by means of the linear combination of the species’. 220. abundances. Only those components significant after a ten-fold validation procedure. 221. were retained (StatSoft 2011).. 222. All statistical analyses were conducted in Statistica 10 (StatSoft 2011).. 223 224. Results. 225. Tree plantation and landscape characteristics. 226. There was a broad variation in the local habitat variables of the studied tree plantations. 227. (Table 1). Overall, the number of pines >5 cm dbh was not too large but there were a. 228. lot of small trees when considering the average trunk diameter of pines. Pruning. 229. enhanced the development of the tree layer according to a MANOVA (Wilk’s =. 230. 0.752, p = 0.003, n = 61). 11.
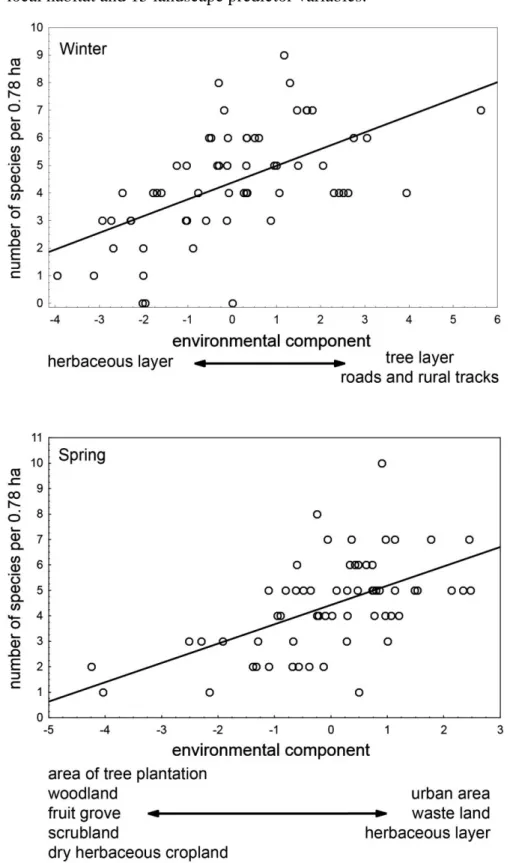
(13) 1 2 3 4 5 6 7 8 9 10 11 12 13 14 15 16 17 18 19 20 21 22 23 24 25 26 27 28 29 30 31 32 33 34 35 36 37 38 39 40 41 42 43 44 45 46 47 48 49 50 51 52 53 54 55 56 57 58 59 60 61 62 63 64 65. 231. There was also a considerable variation in the landscape characteristics around. 232. the tree plantations in an area mainly dominated by dry herbaceous cropland, olive tree. 233. groves and vineyards (Table 1).. 234 235. Species density. 236. Average number of species per census plot of 0.8-ha did not significantly change. 237. between seasons (paired t-test: t = 0.158, d.f. = 60, p = 0.875), being 4.38 species during. 238. winter time (range = 0 - 9, sd = 2.02, n = 61 plots) and 4.43 species during the breeding. 239. season (range = 1 - 10, sd = 1.84). Winter and spring species density were not. 240. significantly correlated (r = 0.208, p = 0.109, n = 61).. 241. One significant component (p << 0.001) was obtained in each PLSR analysis of. 242. the number of species in the 61 studied tree plantations using all local habitat and. 243. landscape predictor variables, accounting for 31.9% and 31.4% of total variance in. 244. winter and breeding season species density, respectively (Table 2 and Figure 1).. 245. Environmental effects on local species density were very different in both seasons. The. 246. weights of local habitat and landscape variables were not significantly correlated in. 247. winter and spring (r = 0.190, p = 0.372, n = 24 predictor variables), thus defining. 248. different patterns of environmental determinism on species density in both seasons.. 249. In winter, species density mainly increased with the development of the tree. 250. layer (cover, height and trunk diameter of pines), which was associated to low. 251. development of the herbaceous and shrub layers (Table 2 and Figure 1). None. 252. predictor variable describing landscape characteristics around the plantations attained a. 253. |weight| > 0.2. Thus, the importance of local habitat variables on winter species density. 254. was considerably higher than the importance of variables describing the landscape 12.
(14) 1 2 3 4 5 6 7 8 9 10 11 12 13 14 15 16 17 18 19 20 21 22 23 24 25 26 27 28 29 30 31 32 33 34 35 36 37 38 39 40 41 42 43 44 45 46 47 48 49 50 51 52 53 54 55 56 57 58 59 60 61 62 63 64 65. 255. characteristics (calculated by means of the square of predictor weights), and was. 256. considerably higher than that expected considering the relative number of predictors in. 257. the two groups of variables (local habitat = 0.86, landscape = 0.14; the ‘null’. 258. proportions according to the number of predictors was 0.38 for nine local habitat. 259. variables and 0.62 for 15 landscape variables).. 260. During the breeding season, species density was positively associated with the. 261. presence of waste lands, urban areas and scattered buildings around them, and. 262. negatively related to their size, the height and cover of shrubs and the amount of area. 263. around plantations covered by woodland (mainly remaining patches of holm oak. 264. forests), fruit groves, shrubland and dry herbaceous cropland (Table 2 and Figure 1).. 265. Landscape characteristics of the surrounding the tree plantations were similarly. 266. important than local habitat in determining species density during the breeding season. 267. (summatory of the square of predictor weights: 0.42 for nine local habitat variables and. 268. 0.58 for 15 landscape characteristics, which were very similar to the ‘null’ proportions. 269. of 0.38 and 0.62 respectively, according to the number of predictors).. 270 271. Species composition. 272. The avifauna was dominated by the great tit (Parus major), the chiffchaff (Phylloscopus. 273. collybita), the goldfinch (Carduelis carduelis), the wood pigeon (Columba palumbus). 274. and the magpie (Pica pica) in wintertime, and by the goldfinch, the spotless starling. 275. (Sturnus unicolor), the wood pigeon and the magpie during the breeding season (spring). 276. (average of more than one detected individual per census plot in both seasons;. 277. Appendix 2).. 13.
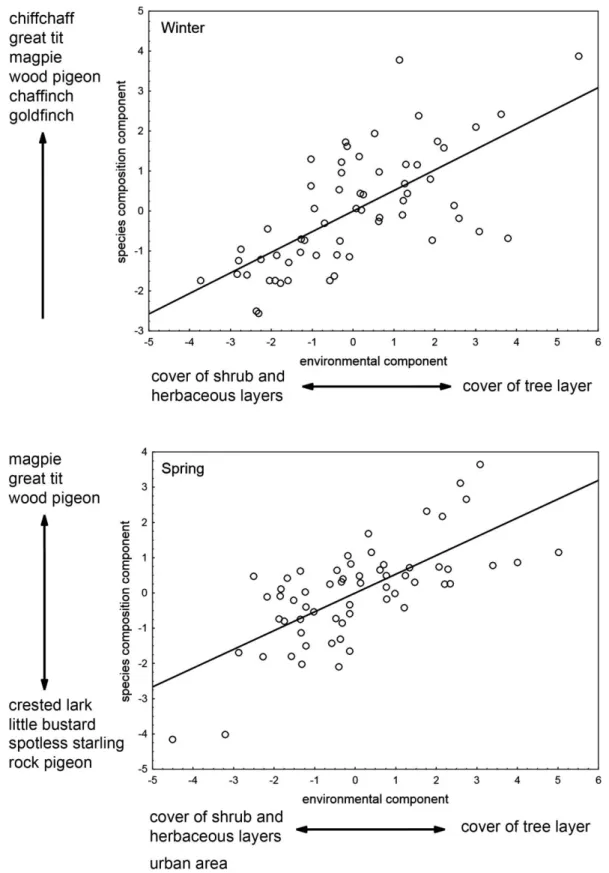
(15) 1 2 3 4 5 6 7 8 9 10 11 12 13 14 15 16 17 18 19 20 21 22 23 24 25 26 27 28 29 30 31 32 33 34 35 36 37 38 39 40 41 42 43 44 45 46 47 48 49 50 51 52 53 54 55 56 57 58 59 60 61 62 63 64 65. 278. The following species that exhibit high relative abundance in woodland habitats. 279. within the Mesomediterranean region of Central Spain according to Carrascal and. 280. Palomino (2008) were completely absent in both seasons in the studied tree plantations:. 281. great spotted woodpecker (Dendrocopos major), blackbird (Turdus merula), nuthatch. 282. (Sitta europaea), short-toed treecreeper (Certhia brachydactyla), firecrest (Regulus. 283. ignicapillus), coal tit (Periparus ater), crested tit (Lophophanes cristatus), long-tailed tit. 284. (Aegithalos caudatus), hawfinch (Coccothraustes coccothraustes), blue tit (Cyanistes. 285. caeruleus), rock bunting (Emberiza cia), jay (Garrulus glandarius), and Eurasian. 286. Hoopoe (Upupa epops). Similarly, other woodland species in the region such as robin. 287. (Erithacus rubecula) and Woodchat Shrike (Lanius senator) were very scarce in the. 288. studied plantations.. 289. Relative abundances of species across the 61 studied tree plantations were not. 290. tightly correlated among themselves either in winter or during the breeding season, as. 291. defined by the low variance attained by the first components of the PLSRs in both. 292. seasons using the common species (those with more than 0.1 birds/plot): 7.9% of. 293. variance in the relative abundances of 12 species in winter, and 5.7% of variance for 17. 294. species in spring. Nevertheless, these loose patterns of co-variation in species. 295. abundances were highly associated with the plantation characteristics, mainly local. 296. habitat in both seasons (see below): r = 0.675, p << 0.001 for winter, and r = 0.700, p. 297. << 0.001 for the breeding season.. 298. The main pattern of co-variation in species abundances during the winter season. 299. was the association of the chiffchaff, great tit, magpie, wood pigeon, chaffinch. 300. (Fringilla coelebs), and goldfinch in tree plantations with a well developed tree layer. 301. (Figure 2; see predictor variable weights in Table 2; these species were selected 14.
(16) 1 2 3 4 5 6 7 8 9 10 11 12 13 14 15 16 17 18 19 20 21 22 23 24 25 26 27 28 29 30 31 32 33 34 35 36 37 38 39 40 41 42 43 44 45 46 47 48 49 50 51 52 53 54 55 56 57 58 59 60 61 62 63 64 65. 302. according to absolute values of loadings > 0.2 in the component of species abundances).. 303. On the other hand, there is a common pattern of increase in species abundances during. 304. the breeding season that associates the magpie, great tit, and wood pigeon in tree. 305. plantations with a tall and dense cover of the tree layer surrounded by relatively high. 306. cover of vineyard with olive trees, as opposed to the co-variation of abundances of rock. 307. pigeon (Columba livia), spotless starling, little bustard (Tetrax tetrax) and crested lark. 308. (Galerida cristata) in plantations with high cover of the shrubs and herb layers near. 309. urban areas (Figure 2).. 310. The importance of the environmental factors related to composition of bird. 311. assemblages was rather similar in winter and spring (Table 2), as the weights of local. 312. habitat and landscape variables were highly correlated in both seasons: r = 0.921, p <<. 313. 0.001, n = 24 predictor variables). Moreover, the importance of local habitat variables in. 314. defining the co-variation of abundance of bird species was considerably higher than that. 315. of variables describing the landscape characteristics around tree plantations in both. 316. seasons calculated by means of the square of predictor weights (WINTER: local habitat. 317. = 0.83, landscape = 0.17; SPRING: local habitat = 0.73, landscape = 0.27; the ‘null’. 318. proportions according to the number of predictors were 0.38 and 0.62, respectively).. 319 320. Discussion. 321. Overall community composition. 322. Our results show that the local composition of bird assemblages inhabiting the interior. 323. of young Mediterranean cropland afforestations are characterized by a few common. 324. dominant species, namely magpie, wood pigeon and goldfinch in both seasons, great tit. 325. and chiffchaff in wintertime, and spotless starling in spring. These ubiquitous species 15.
(17) 1 2 3 4 5 6 7 8 9 10 11 12 13 14 15 16 17 18 19 20 21 22 23 24 25 26 27 28 29 30 31 32 33 34 35 36 37 38 39 40 41 42 43 44 45 46 47 48 49 50 51 52 53 54 55 56 57 58 59 60 61 62 63 64 65. 326. are generalist birds of wooded areas, with broad geographical ranges and high. 327. population sizes in Spain (Carrascal and Palomino 2008; Martí and del Moral 2003).. 328. They are of little conservation concern in the European context (BirdLife International. 329. 2004). They are also of little sensibility to habitat fragmentation as they can thrive in. 330. very small woodland patches (Díaz et al. 1998; Razola and Rey Benayas 2009; Santos. 331. et al. 2002), such as those corresponding to the afforestations investigated in this study.. 332. The biogeographical basis of the avifauna in this Mediterranean region, with an. 333. impoverished European forest avifauna dominated by species of early successional. 334. stages, probably limits the possibility of colonization of pure coniferous woodland. 335. species. Forest specialists of Mediterranean coniferous forests that require more mature. 336. and larger woodland patches (Díaz et al. 1998; Santos et al. 2006), such as the great. 337. spotted woodpecker, firecrest, crested tit, short-toed treecreeper or nuthatch, were never. 338. recorded in these plantations, thus emphasizing the low suitability of these woodlands. 339. for forest avifauna of the region. This points to the importance of the biogeographic. 340. context when designing restoration plans with afforestations in agricultural-dominant. 341. landscapes (Suárez-Seoane et al. 2002), and enlightens the conflicts that can arise if. 342. single services of ecological restoration such as carbon sequestration by tree plantations. 343. are targeted without taking into account regional biodiversity (Bullock et al. 2011).. 344 345. Relative effects of local habitat and landscape characteristics. 346. The influence of different sets of environmental factors, namely local habitat of tree. 347. plantations and landscape characteristics, on bird communities changed considerably. 348. between seasons, with a prominent role of local habitat variables during winter for. 349. species density, and a more balanced importance of landscape characteristics around 16.
(18) 1 2 3 4 5 6 7 8 9 10 11 12 13 14 15 16 17 18 19 20 21 22 23 24 25 26 27 28 29 30 31 32 33 34 35 36 37 38 39 40 41 42 43 44 45 46 47 48 49 50 51 52 53 54 55 56 57 58 59 60 61 62 63 64 65. 350. plantations and local habitat during the breeding season. During the breeding season. 351. birds are spatially restricted to the focal place where they breed, and thus they show. 352. marked habitat preferences related to vegetation structure, which is an important. 353. attribute determining species composition of bird communities at the local scale. 354. (Hinsley et al. 2009; Hurlbert 2004). In contrast, during the winter period, birds adopt a. 355. vagabonding life-style exploring a greater variety of habitats over larger areas to track. 356. the spatial and temporal distribution of food availability (Levey and Stiles 1992;. 357. Wiktander et al. 2001). From this perspective, local habitat should have a greater. 358. importance in the breeding season than in the winter in influencing bird communities of. 359. tree plantations within agricultural landscapes. Nevertheless, our results do not support. 360. this prediction for species density.. 361. The negative influence of the area of tree plantations studied here on local. 362. species density is related to the fact that the probability of recording “ubiquitous/edge”. 363. bird species in the centre of plantations decreases as plantation area increases. This. 364. result, together with the remarkable negative influence of nearby woodlands on local. 365. species density in the interior of the plantations, reinforces the idea of the low. 366. favourability of these young afforestations dominated by pines for the forest avifauna of. 367. the study region, especially if they are large.. 368. The high importance of urban cover around the tree plantations on species. 369. density during spring points to the attractiveness of scarce woodland fragments to. 370. urban-exploiters of Central Spain (Palomino and Carrascal 2006), such as the rock dove. 371. (Columba livia), collared dove (Streptopelia decaocto), greenfinch (Carduelis chloris),. 372. house sparrow (Passer domesticus), magpie, or spotless starling. It also emphasizes that. 373. urban development extends its impact on the surrounding habitats affecting bird 17.
(19) 1 2 3 4 5 6 7 8 9 10 11 12 13 14 15 16 17 18 19 20 21 22 23 24 25 26 27 28 29 30 31 32 33 34 35 36 37 38 39 40 41 42 43 44 45 46 47 48 49 50 51 52 53 54 55 56 57 58 59 60 61 62 63 64 65. 374. communities, especially by the influence of just a few very common urban species (e.g.. 375. Findlay and Houlahan 1997; Odell and Knight 2001; Palomino and Carrascal 2007;. 376. Sauvajot et al. 1998). Urban and surrounding areas are a source of the ubiquitous and. 377. opportunistic nest predator magpie, and could thus entail additional conservation. 378. concern, because its overabundance around the cities could pose a deleterious effect on. 379. other bird species breeding in the plantations (e.g. Andren 1992; Groom 1993; Paradis. 380. et al. 2000). Similarly, Lindenmayer et al. (2012) found that another aggressive corvid. 381. reduced bird abundance in Australian tree plantations located in an agricultural. 382. landscape.. 383 384. Management of tree plantations. 385. The results of this study show that, overall, there are difficulties in making. 386. generalizations about the environmental factors that determine bird diversity inhabiting. 387. the interior of young tree plantations in Mediterranean agricultural landscapes on a year-. 388. round basis, and thus in outlining management recommendations to make them. 389. friendlier for the avifauna. These plantations offer opportunities for a few generalist. 390. forest bird species but are not perceived as an attractive breeding habitat for most forest. 391. species in the region. Further, the youngest plantations with under-developed tree layer. 392. and presence of shrub and herbaceous layers benefit bird species that are characteristic. 393. of open farmland habitats such as the calandra lark, little bustard and rock pigeon (Rey. 394. Benayas et al. 2010). As pruning of pines speeds up the development of the tree layer, a. 395. more generalized use of this practice would increase overall species density in winter. 396. and benefit forest species such as the wood pigeon, which is of interest to hunters, and. 397. insectivorous birds such as the great tit or blue tit, which have the potential of 18.
(20) 1 2 3 4 5 6 7 8 9 10 11 12 13 14 15 16 17 18 19 20 21 22 23 24 25 26 27 28 29 30 31 32 33 34 35 36 37 38 39 40 41 42 43 44 45 46 47 48 49 50 51 52 53 54 55 56 57 58 59 60 61 62 63 64 65. 398. enhancing pest regulation in both tree plantations and crops around them (Jedlicka et al.. 399. 2011).. 400 401. Conclusions. 402. Local habitat and surrounding landscape characteristics in Mediterranean landscapes. 403. dominated by croplands had very different effects on bird communities inhabiting the. 404. interior of young afforestations in the winter and breeding seasons, which make difficult. 405. suggesting extensive management practices with positive effects for all avifauna species. 406. during the entire year. These small, monotonous plantations are an attractive habitat for. 407. urban exploiter species but an unfavourable habitat for the regional forest species pool. 408. with the exception of the forest generalist species. Therefore, the small size and low. 409. maturity of the studied tree plantations do not contribute to enhancing the bird diversity. 410. value of current CAP aids to afforest former cropland with pines in the Mediterranean. 411. region. Further monitoring of bird communities as these plantations get older is. 412. necessary to provide more robust science-based management recommendations, and test. 413. the success of the implemented recommendation (more use of tree pruning) that the. 414. results of this study hinted.. 415 416. Acknowledgements. 417. Projects from the Spanish Ministry of Science and Education (CGL2010-18312) and the. 418. Government of Madrid (S2009AMB-1783, REMEDINAL-2) are currently providing. 419. financial support for this body of research. Claire Jasinski kindly improved the English. 420. of an early draft. We are indebted to two anonymous reviewers whose comments. 421. improved a previous version of this manuscript. 19.
(21) 1 2 3 4 5 6 7 8 9 10 11 12 13 14 15 16 17 18 19 20 21 22 23 24 25 26 27 28 29 30 31 32 33 34 35 36 37 38 39 40 41 42 43 44 45 46 47 48 49 50 51 52 53 54 55 56 57 58 59 60 61 62 63 64 65. 422 423. References. 424 425. Abdi H (2007) Partial least square regression (PLS regression). In: NJ S (ed) Encyclopedia of Measurement and Statistics. Sage, Thousand Oaks, pp 740–744. 426 427. Andren H (1992) Corvid density and nest predation in relation to forest fragmentation A lansdcape perspective. Ecology 73:794–804.. 428 429. Bibby C, Burgess ND, Hill DA, Mustoe SH (2000) Bird Census Techniques, 2nd ed. Academic Press, London. 430 431. BirdLife International (2004) Birds in Europe: population estimates, trends and conservation status. BirdLife International, Cambridge, U.K.. 432 433 434. Blondel J (1990) Biogeography and history of forest bird faunas in the Mediterranean zone. In: Keast A (ed) Biogeography and ecology of forest bird communities. SPB Academic Publishing, The Hague, pp 95–107. 435 436 437. Bremer LL, Farley KA (2010) Does plantation forestry restore biodiversity or create green deserts? A synthesis of the effects of land-use transitions on plant species richness. Biodiversity and Conservation 19:3893–3915.. 438 439 440. Bullock JM, Aronson J, Newton AC, et al. (2011) Restoration of ecosystem services and biodiversity: conflicts and opportunities. Trends in ecology & evolution 26:541–9. doi: 10.1016/j.tree.2011.06.011. 441 442 443. Carrascal LM, Díaz L (2003) Asociación entre distribución continental y regional. Análisis con la avifauna forestal y de medios arbolados de la Península Ibérica. Graellsia 59:179–207.. 444 445 446. Carrascal LM, Galván I, Gordo O (2009) Partial least squares regression as an alternative to current regression methods used in ecology. Oikos 118:681–690. doi: 10.1111/j.1600-0706.2008.16881.x. 447 448. Carrascal LM, Palomino D (2008) Las aves comunes reproductoras en España. Población en 2004-2006. SEO/BirdLife, Madrid. 202.. 449. Cresswell W (2008) Non-lethal effects of predation in birds. Ibis 150:3–17.. 450 451 452. Díaz M, Carbonell R, Santos T, Tellería JL (1998) Breeding bird communities in pine plantations of the Spanish plateaux: biogeography, landscape and vegetation effects. Journal of Applied Ecology 35:562–574.. 453 454. Directorate-General for Agriculture and Rural Development (2012) Agriculture in the European Union - Statistical and Economic Information 2011. 357. 20.
(22) 1 2 3 4 5 6 7 8 9 10 11 12 13 14 15 16 17 18 19 20 21 22 23 24 25 26 27 28 29 30 31 32 33 34 35 36 37 38 39 40 41 42 43 44 45 46 47 48 49 50 51 52 53 54 55 56 57 58 59 60 61 62 63 64 65. 455 456. FAO (2011) State of the World’s Forests 2011. Food and Agriculture Organization of the United Nations, Rome. 179.. 457 458 459. Felton A, Knight E, Wood J, et al. (2010) A meta-analysis of fauna and flora species richness and abundance in plantations and pasture lands. Biological Conservation 143:545–554. doi: 10.1016/j.biocon.2009.11.030. 460 461 462. Findlay CS, Houlahan J (1997) Anthropogenic Correlates of Species Richness in Southeastern Ontario Wetlands. Conservation Biology 11:1000–1009. doi: 10.1046/j.1523-1739.1997.96144.x. 463 464 465. Fischer C, Flohre A, Clement LW, et al. (2011) Mixed effects of landscape structure and farming practice on bird diversity. Agriculture, Ecosystems and Environment 141:119–125. doi: 10.1016/j.agee.2011.02.021. 466 467 468 469. Geiger F, De Snoo GR, Berendse F, et al. (2010) Landscape composition influences farm management effects on farmland birds in winter: A pan-European approach. Agriculture, Ecosystems and Environment 139:571–577. doi: 10.1016/j.agee.2010.09.018. 470 471. Geographic Information System of Farming Land (2010) Geographic Information System of Farming Land. http://pagina.jccm.es/agricul/sigpac.htm.. 472 473 474. Gómez-Aparicio L, Zavala MA, Bonet FJ, Zamora R (2009) Are pine plantations valid tools for restoring Mediterranean forests? An assessment along abiotic and biotic gradients. Ecological Applications 19:2124–2141. doi: 10.1890/08-1656.1. 475 476. Groom DW (1993) Magpie Pica pica predation on Blackbird Turdus merula nests in urban areas. Bird Study 40:55–62. doi: 10.1080/00063659309477129. 477 478 479. Heikkinen R, Luoto M, Virkkala R (2004) Effects of habitat cover, landscape structure and spatial variables on the abundance mosaic of birds in an agricultural-forest mosaic. Journal of Applied Ecology 41:824–835.. 480 481 482. Hinsley SA, Hill RA, Fuller RJ, et al. (2009) Bird species distributions across woodland canopy structure gradients. Community Ecology 10:99–110. doi: 10.1556/ComEc.10.2009.1.12. 483 484. Hurlbert AH (2004) Species-energy relationships and habitat complexity in bird communities. Ecology Letters 7:714–720. doi: 10.1111/j.1461-0248.2004.00630.x. 485 486 487. Jedlicka JA, Greenberg R, Letourneau DK (2011) Avian conservation practices strengthen ecosystem services in California vineyards. PloS ONE 6:e27347. doi: 10.1371/journal.pone.0027347. 488 489 490. Levey DJ, Stiles FG (1992) Evolutionary Precursors of Long-Distance Migration: Resource Availability and Movement Patterns in Neotropical Landbirds. The American Naturalist 140:447. doi: 10.1086/285421 21.
(23) 1 2 3 4 5 6 7 8 9 10 11 12 13 14 15 16 17 18 19 20 21 22 23 24 25 26 27 28 29 30 31 32 33 34 35 36 37 38 39 40 41 42 43 44 45 46 47 48 49 50 51 52 53 54 55 56 57 58 59 60 61 62 63 64 65. 491 492 493. Lindenmayer DB, Knight EJ, Crane MJ, et al. (2010) What makes an effective restoration planting for woodland birds? Biological Conservation 143:289–301. doi: 10.1016/j.biocon.2009.10.010. 494 495 496 497. Lindenmayer DB, Northrop-Mackie AR, Montague-Drake R, et al. (2012) Not all kinds of revegetation are created equal: revegetation type influences bird assemblages in threatened Australian woodland ecosystems. PloS one 7:e34527. doi: 10.1371/journal.pone.0034527. 498. Martí R, Del Moral JC (2003) Atlas de las Aves Reproductoras de España. 733.. 499 500. Monkkonen M (1994) Diversity Patterns In Palearctic And Nearctic Forest Bird Assemblages. Journal of Biogeography 21:183–195.. 501 502 503. Moreno-Mateos D, Rey Benayas JM, Pérez-Camacho L, et al. (2011) Effects of Land use on Nocturnal Birds in a Mediterranean Agricultural Landscape. Acta Ornithologica 46:173–182. doi: 10.3161/000164511X625946. 504 505 506. Munro NT, Fischer J, Wood J, Lindenmayer DB (2009) Revegetation in agricultural areas: the development of structural complexity and floristic diversity. Ecological Applications 19:1197–1210. doi: 10.1890/08-0939.1. 507. Newton I (2007) The migration ecology of birds. Academic Press, London. 508 509 510. Odell EA, Knight RL (2001) Songbird and Medium-Sized Mammal Communities Associated with Exurban Development in Pitkin County, Colorado. Conservation Biology 15:1143–1150. doi: 10.1046/j.1523-1739.2001.0150041143.x. 511 512 513. Palomino D, Carrascal LM (2006) Urban influence on birds at a regional scale: A case study with the avifauna of northern Madrid province. Landscape and Urban Planning 77:276–290. doi: 10.1016/j.landurbplan.2005.04.003. 514 515 516. Palomino D, Carrascal LM (2007) Threshold distances to nearby cities and roads influence the bird community of a mosaic landscape. Biological Conservation 140:100–109. doi: 10.1016/j.biocon.2007.07.029. 517 518 519 520. Paradis E, Baillie SR, Sutherland WJ, et al. (2000) Large-scale spatial variation in the breeding performance of song thrushes Turdus philomelos and blackbirds T. merula in Britain. Journal of Applied Ecology 37:73–87. doi: 10.1046/j.13652664.2000.00547.x. 521 522 523 524. Piha M, Tiainen J, Holopainen J, Vepsäläinen V (2007) Effects of land-use and landscape characteristics on avian diversity and abundance in a boreal agricultural landscape with organic and conventional farms. Biological Conservation 140:50– 61. doi: 10.1016/j.biocon.2007.07.021. 525 526. Poschlod P, Bakker JP, Kahmen S (2005) Changing land use and its impact on biodiversity. Basic and Applied Ecology 6:93–98. doi: 10.1016/j.baae.2004.12.001 22.
(24) 1 2 3 4 5 6 7 8 9 10 11 12 13 14 15 16 17 18 19 20 21 22 23 24 25 26 27 28 29 30 31 32 33 34 35 36 37 38 39 40 41 42 43 44 45 46 47 48 49 50 51 52 53 54 55 56 57 58 59 60 61 62 63 64 65. 527 528 529. Razola I, Rey Benayas JM (2009) Effects of woodland islets introduced in a Mediterranean agricultural landscape on local bird communities. Web Ecology 9:44–53.. 530 531 532. Reino L, Porto M, Morgado R, et al. (2010) Does afforestation increase bird nest predation risk in surrounding farmland? Forest Ecology and Management 260:1359–1366. doi: 10.1016/j.foreco.2010.07.032. 533 534. Rey Benayas JM, Bullock JM (2012) Restoration of Biodiversity and Ecosystem Services on Agricultural Land. Ecosystems. doi: 10.1007/s10021-012-9552-0. 535 536 537 538. Rey Benayas JM, Galván I, Carrascal LM (2010) Differential effects of vegetation restoration in Mediterranean abandoned cropland by secondary succession and pine plantations on bird assemblages. Forest Ecology and Management 260:87–95. doi: 10.1016/j.foreco.2010.04.004. 539 540 541 542. Santos T, Tellería JL, Carbonell R (2002) Bird conservation in fragmented Mediterranean forests of Spain: effects of geographical location, habitat and landscape degradation. Biological conservation 105:113–125. doi: 10.1016/S00063207(01)00210-5. 543 544 545. Santos T, Tellería JL, Díaz M, Carbonell R (2006) Evaluating the benefits of CAP reforms: Can afforestations restore bird diversity in Mediterranean Spain? Basic and Applied Ecology 7:483–495. doi: 10.1016/j.baae.2005.11.001. 546 547 548. Sauvajot RM, Buechner M, Kamradt DA, Schonewald CM (1998) Patterns of human disturbance and response by small mammals and birds in chaparral near urban development. Urban Ecosystems 2:279–297.. 549 550. Shiu HJ, Lee P (2003) Assessing Avian Point-count Duration and Sample Size Using Species. Zoological Studies 42:357–367.. 551 552. Spanish Agrarian Guarantee Fund (2012) Spanish Agrarian Guarantee Fund. www.fega.es. Accessed 16 Apr 2012. 553. StatSoft (2011) Statistica 10 (data analysis software system).. 554 555 556 557. Suárez-Seoane S, Osborne PEP, Baudry J (2002) Responses of birds of different biogeographic origins and habitat requirements to agricultural land abandonment in northern Spain. Biological Conservation 105:333–344. doi: 10.1016/S00063207(01)00213-0. 558 559. Tellería JL, Santos T (1994) Factors involved in the distribution of forest birds in the Iberian Peninsula. Bird Study 41:161–169. doi: 10.1080/00063659409477216. 560 561. Wiktander U, Olsson O, Nilsson SG (2001) Seasonal variation in home-range size, and habitat area requirement of the lesser spotted woodpecker (Dendrocopos minor) in 23.
(25) 1 2 3 4 5 6 7 8 9 10 11 12 13 14 15 16 17 18 19 20 21 22 23 24 25 26 27 28 29 30 31 32 33 34 35 36 37 38 39 40 41 42 43 44 45 46 47 48 49 50 51 52 53 54 55 56 57 58 59 60 61 62 63 64 65. 562 563. southern Sweden. Biological Conservation 100:387–395. doi: 10.1016/S00063207(01)00045-3. 564 565 566. Wretenberg J, Pärt T, Berg Å (2010) Changes in local species richness of farmland birds in relation to land-use changes and landscape structure. Biological Conservation 143:375–381. doi: 10.1016/j.biocon.2009.11.001. 24.
(26) Table. Table 1. Mean, standard deviation (sd) and range (min / max) of the local habitat and landscape variables describing the characteristics of the 61 studied tree plantations. mean. sd. Local habitat Area of tree plantation (ha) Cover of the tree layer (%) Average pine height (m) Average trunk diameter of pines (dbh cm) # of pine trunks larger than 5 cm dbh / 0.2 ha Cover of the shrub layer (%) Average height of the shrub layer (m) Cover of the herbaceous layer (%) Average height of the herbaceous layer (m). 4.8 35.4 3.5 11.4 70.5 4.7 1.2 54.3 0.4. 5.6 25.5 1.5 5.8 50.7 8.8 1.1 40 0.3. Landscape around plantations Average distance to other woodlands (m) Streams, rivers and lagoons (% cover) Roads and rural tracks (% cover) Woodlands (% cover) Fruit groves (% cover) Waste lands (% cover) Olive groves (% cover) Pastures with scattered trees (% cover) Scrubland (% cover) Pastures (% cover) Dry herbaceous cropland (% cover) Vineyards (% cover) Vineyards with olive trees (% cover) Dried fruit orchards (% cover) Urban areas and scattered buildings (% cover). 739.7 0.7 6.4 4.2 1.1 6.8 21.9 0.4 10.0 1.1 18.2 20.9 5.1 0.6 2.4. 621.7 1.1 5.2 4.7 1.3 4.4 23.7 1.6 7.4 3.2 9.2 13.7 8.5 2.4 4.2. Range 1.0 1.7 0.9 0 0 0 0 0 0. 36.5 100 7.2 33.2 185 46.2 3.3 100 1.1. 14 2506 0 4.1 0 31.1 0.1 25.2 0 5.4 0 14.8 0 94.7 0 9.4 0 29.5 0 19.1 0 40.8 0 49.2 0 32.3 0 16.9 0 25.8. 1.
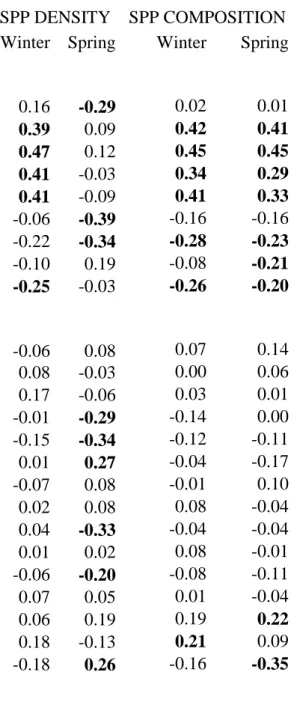
(27) Table 2. Results of the partial least squares regression (PLSR) models analyzing the variation in bird species density and bird species composition in 61 tree plantations during winter and the breeding season (spring) according to nine local habitat features of plantations and 15 landscape predictor variables. Figures shown are the predictor weights of each variable in each component (in bold those with |weights| > 0.2; this threshold was calculated according to the following equation: [1 / #predictors]0.5). SPP DENSITY SPP COMPOSITION Winter Spring Winter Spring Local habitat Area of tree plantation (ha) Cover of the tree layer (%) Average pine height (m) Average trunk diameter of pines (dbh cm) # of pine trunks larger than 5 cm dbh Cover of the shrub layer (%) Average height of the shrub layer (m) Cover of the herbaceous layer (%) Average height of the herbaceous layer (m). 0.16 0.39 0.47 0.41 0.41 -0.06 -0.22 -0.10 -0.25. -0.29 0.09 0.12 -0.03 -0.09 -0.39 -0.34 0.19 -0.03. 0.02 0.42 0.45 0.34 0.41 -0.16 -0.28 -0.08 -0.26. 0.01 0.41 0.45 0.29 0.33 -0.16 -0.23 -0.21 -0.20. Landscape around plantations Average distance to other woodlands (m) Streams, rivers and lagoons (% cover) Roads and rural tracks (% cover) Woodlands (% cover) Fruit groves (% cover) Waste lands (% cover) Olive groves (% cover) Pastures with scattered trees (% cover) Scrubland (% cover) Pastures (% cover) Dry herbaceous cropland (% cover) Vineyards (% cover) Vineyards with olive trees (% cover) Dried fruit orchards (% cover) Urban areas and scattered buildings (% cover). -0.06 0.08 0.17 -0.01 -0.15 0.01 -0.07 0.02 0.04 0.01 -0.06 0.07 0.06 0.18 -0.18. 0.08 -0.03 -0.06 -0.29 -0.34 0.27 0.08 0.08 -0.33 0.02 -0.20 0.05 0.19 -0.13 0.26. 0.07 0.00 0.03 -0.14 -0.12 -0.04 -0.01 0.08 -0.04 0.08 -0.08 0.01 0.19 0.21 -0.16. 0.14 0.06 0.01 0.00 -0.11 -0.17 0.10 -0.04 -0.04 -0.01 -0.11 -0.04 0.22 0.09 -0.35. 2.
(28) Figure. Figure 1. Relationship between (a) the species density per 0.8-ha census plot of tree plantations in the winter (top) and (b) the breeding season (down) and the multivariate gradient (first PLSR component) defined by the Partial Least Squared Regression analysis on 9 local habitat and 15 landscape predictor variables.. 1.
(29) Figure 2. Relationship between (a) the species composition of tree plantations in the winter (top) and (b) the breeding season (down) and the multivariate gradient (first PLSR component) defined by the Partial Least Squared Regression analysis on 9 local habitat and 15 landscape predictor variables.. 2.
(30)
Figure
Documento similar