Contaduría y Administración 63 (3), 2018, 1-16 Accounting & Management
* Corresponding author.
E-mail address: flarenatasaouza@hotmail.com (F. R. de Souza)
Peer review under the responsibility of Universidad Nacional Autónoma de México. http://dx.doi.org/10.22201/fca.24488410e.2018.1045
0186- 1042/© 2018 Universidad Nacional Autónoma de México, Facultad de Contaduría y Administración. This is an open access article under the CC BY-NC-ND (http://creativecommons.org/licenses/by-nc-nd/4.0/)
Payroll exemption impact on the behavior of costs
in BM&FBovespa civil construction sector
El impacto de la exoneración de la nómina del comportamiento de costos
del sector de la construcción civil de BM&FBovespa
Flávia Renata de Souza
*, Altair Borgert and Leonardo Flach
Universidad Federal de Santa Catarina, Brazil
Received 10 March 2016; Accepted 19 October 2016 Available online 27 June 2018
Abstract
Among the various initiatives of the Brazilian Federal Government to overcome the economic crisis, what stands out is the incentive to legalize manual labor. Brazil is one of the countries with the highest incidence of payroll tax on workers. Thus, the objective of this research is to analyze the impact of payroll exemption on the behavior of costs of civil construction companies listed in BM&FBovespa. The hypo
-thesis is that the behavior of costs is statistically different in the periods before and after the exemption of payrolls. As methodological procedures, we used linear regression and a t test to check for differences between the averages of the values before and after the exemption. The data analysis panel identified the
sticky behavior of costs over time in the industry. The results obtained do not reject null the hypothesis
when observing the behavior of costs based on CPV / RLV and CT / RLV data. Therefore, it is not possible to say that there is a significant difference between the periods before and after the payroll exemption and consequent effective cost reduction.
JEL Classification: M41.
Resumen
Entre las diversas iniciativas del Gobierno Federal de Brasil para superar la crisis económica, se destaca el incentivo para la legalización del trabajo. Brasil es uno de los países con mayor incidencia de
los impuestos en la nómina de los trabajadores. Por lo tanto, el objetivo de esta investigación es analizar el impacto de la liberación de los costos de nómina en el comportamiento de las empresas en el sector de la construcción civil en la BM & FBovespa. La hipótesis es que el comportamiento de los costos es estadísticamente diferente en los periodos antes y después de la exoneración de la nómina. Como proce
-dimientos metodológicos, se utilizó la regresión lineal y la prueba T para comprobar si hay diferencias entre los promedios de los valores anteriores y posteriores a la exoneración. El panel de análisis de datos identifica el comportamiento Stiky de los costos con el tiempo en la industria. Los resultados no rechazan la hipótesis nula cuando se observa el comportamiento de los costos basados en los datos CPV / RLV y CT / RLV. Por lo tanto, no es posible decir que hay una diferencia significativa entre los períodos antes y después de la exoneración de la nómina y la consiguiente reducción efectiva de costos.
Código JEL: M41
Palabras clave: Exoneración de la nómina, Construcción civil, Comportamiento de costos.
Introduction
Since the 1990s, there has been an intense movement of changes in the production environment in Brazil. What stands out as the main cause of these transformations, is liberal intervention in the economic restructuring policy of the country (Mancuso & Oliveira, 2006). Among the various initiatives of the Brazilian Federal Government to overcome the crisis, what stands out is the incentive for the legalization of manual labor by reducing hiring costs. (Brasil, Economia e Governo, 2015). Brazil is considered one of the countries with the highest incidence of payroll tax on workers (Giambiagi, 2008, Khair, Araújo & Afonso, 2005, Afonso, Soares & Castro, 2013). It is noteworthy that, as a percentage on commercial profits, the country is in 6th place in the world, with a value of up to 40 percent of worker’s income (The World Bank, 2015).
In this context, the Federal Government established the GBP (Greater Brazil Plan), which is the industrial, technological and foreign trade policy of the country, whose objectives are: “sustain economic growth in an adverse economic context; leave the international crisis in a better position than when entered “( Plano Brasil Maior, 2015).
Among the measures announced in the GBP, it deals with payroll exemption, initially targeted to industries, in order to promote exports, subsequently expanded to some service providers (Plano Brasil Maior, 2015). The relief comes from taxes on the payroll sheet, which affect the cost of production in Brazil where the Federal Government operates through economic action and policy plans such as the GBP by being able to reduce the cost of production, one of the components of doing business in Brazil (Custo Brasil) that, when elevated, affect the position of companies in the country in relation to companies from other countries (Mancuso & Oliveira, 2006).
period specified by the constitution, and on July 19, 2013, was ratified by law No. 12,844 / 13, which amended the legal provision of law No. 12,546 / 11 and vouched for the changes (Tavares Junior, Almeida & Santos, 2015). The payroll exemption replaces employers payment contributions of 20% to Social Security (INSS) on the payroll by a percentage applied on the gross revenue corresponding to 2%.
Since one of the exemption purposes of the payroll is to reduce costs, it is important to consider whether there is, in practice, cost reduction for companies to benefit from the strategy. One way to perform this analysis is through an expenditure behavior study, as we have done in other sectors of the Brazilian economy in studies Richartz, Nunes, Borgert & Dorow (2011), Richartz, Borgert, Ferrari & Vicente (2012), Ferrari, Kremer & Pinheiro (2013) and Ferrari, Kremer & Silva (2014). There is relevance in studying the behavior of costs in global search, according to the study of Anderson, Banker & Janakiraman (2003); Medeiros, Costa & Silva (2005); Calleja, Steliaros & Thomas (2006); Balakrishnan & Gruca, 2008; He, Teruya & Shimizu (2010); Uy (2011); Yükçü & Özkaya (2011); Pervan & Pervan (2012); Porporato & Werbin (2012); Werbin, Vinuesa & Porporato (2012).
Thus, the question that motivates the study is: what is the impact of payroll cost exemption in the companies listed in BM&FBovespa’s construction segment, between 2009 and 2014?
Thereby, the objective of this article is to identify the behavior of costs in companies in the civil construction segment listed in BM&FBovespa between 2009 and 2014.
Theoretical framework
In this section, we present the main research reported in the literature which is related to the study. The process of reviewing the literature is important to understand and develop the topic. Payroll Exemption
For the Brazilian IRS (Receita Federal do Brasil , 2015), the initiative of payroll relief is a governmental measure that aims to replace the current form of social security contributions on the payroll. Thus, there is a new form of contribution on the gross revenue of companies.
After a period of study and analysis on the needs in relation to the taxes paid by the companies, a number of legal provisions establishing the exemption of payroll entered into effect, including in the civil construction segment, in this case, on April 01, 2013, valid until December 31, 2014.
MP No 540/2011 succeeded by Law 12,546 / 2011, amended and added by Law 12,715 / 2012, subsequently amended by MP 601/2012 which, among other changes, highlights the inclusion of the construction sectors and provides that, from April/01/2013 the sector will have the social security contribution on payroll replaced by the contribution on gross revenue.
The payroll exemption mechanism replaces, even in effect, payment of social security contributions of 20% to Social Security (INSS) by the company on payroll for a percentage between 1% and 2% of the monthly gross revenue with companies affected by the exemption (Receita Federal do Brasil, 2015).
Second, the change in the basis of the contribution contemplates a reduction of the tax relief to the benefited sectors, once the tax rate on gross revenues is set at a lower level, the rate is able to maintain the tax collection unchanged – known as neutral rate.
According to the regulatory framework that deals with this, Federal Constitution - art. 195, §§ 24:13; Law No. 8.212 / 1991 - art. 22, item I and III; Law No. 12,546 / 2011, the changes are not for all companies. They are only for those that fall in economic activities or that manufacture industrial products listed in the Provisional Measure, even those already benefited by Law No. 12,546 / 2011, which established the payroll exemption. Therefore, the company must pay their social security contributions defined by the percentage of gross income resulting from such product sales. For construction companies, the percentage applied on the gross revenue amounts to 2%. The construction sector includes several fields of activity, however, in this study the focus is specifically on the civil construction sector, represented in the National Classification of Economic Activities - CNAE 2.0 by the following groups: 412, 413, 433 and 439 (Concla 2015 ).
On July19, 2013, Law No. 12,844 / 13 was implemented, which amended law No. 12,546 / 11 measures and consolidated the changes previously announced by the provisional measures. In this environment, the contribution of gross revenue, established by the exemption, only replace the employer’s share of 20% on the payroll, and does not alter other charges such as RAT - Risk of accidents at work, the variable contribution relative to other entities (third parties), Severance Indemnity Fund (FGTS), among others. There were no changes in the forms of deductions and gatherings related to payroll by the employee (Nascimento & Juvella, 2015). Cost behavior
The term expenditure or cost behavior has its concept changed over time with the development and advancement of research in the area. According to Garrison, Noreen & Brewer (2007) and Hansen & Mowen (2001), the topic of study involves the description of changes in the amount of costs of an organization due to the production level. In this more classical approach, the changes in a given period of time can be explained in general by structured cost drivers (Balakrishnan & Gruca, 2008). This approach, commonly referred to as traditional, according to Oliveira, Lustosa & Sales (2007) believes that what affects changes in cost within a defined range, are the changes in activity level, and that there is a relationship between these characteristics.
However, several studies (Anderson, Banker & Janakiraman, 2003 Medeiros, Costa & Silva, 2005 Calleja, Steliaros & Thomas, 2006 He, Teruya & Shimizu, 2010 Uy, 2011 Yükçü & Özkaya 2011, Pervan & Pervan 2012, Porporato & Werbin, 2012, Werbin, Vinuesa & Porporato, 2012) point out that such a symmetrical relationship cannot occur in practice, which leads to studies that seek to analyze the behavior of costs.
In order to explore the possible link between government action and payroll exemption reflected in cost behavior, this study investigates previous studies that have addressed the issue and present forms of cost behavior analysis, as used by Oliveira, Lustosa & Sales (2007), Richartz et al. (2011), Ferrari, Kremer & Pinheiro (2013) and Ferrari, Kremer & Silva (2014).
for the previous period and 20 other observations for the post privatization period. One of the reasons for the research is to highlight the importance of using the costs of items available for consultation as parameter analysis.
The study concluded that the calculated costs were suitable for analysis, and observed interference of Brazilian labor legislation in the concept of manual labor costs, which resulted in allocation of part of its values to fixed costs. The authors found that the variable operating costs, in the period after privatization, characterized significant reduction, which corroborates with the assumption of the study. Similarly, the current study proposed applying such analysis, however, in another phenomenon, during the period before and after payroll exemption of companies in the civil construction segment, only those which disclose their financial reports in BM&FBovespa are investigated.
Richartz et al. (2011) analyzed companies in the state of Santa Catarina listed in BM&FBOVESPA, belonging to the yarn and fabric industries between 1998 and 2010. The study found that, on average, 78.88% of Net Sales (RLV) is absorbed by cost of Goods Sold (CPV). Still, such a representation has not changed significantly over the analysis period.
Ferrari, Kremer & Pinheiro (2013) studied the behavior of costs in relation to a number of changes in the regulatory framework of the listed companies in the Telecommunications sector (Fixed and Mobile) of BM&FBovespa between 1995 and 2012. As a regulated industry by the government, it is believed that the performance of companies in such sector may change in response to changes imposed by law, as occurred in the object of this research. The results showed that major changes in the behavior of total costs occurred until 2003, at which time there was an opening in the telecommunications market, and legislation allowed the entry of new firms. After this period, there was stability in such relationship. This result demonstrates that the costs of companies are affected by the regulations imposed on the industry.
Another study, Ferrari, Kremer & Silva (2014), dealt specifically with the payroll exemption phenomenon. The analysis consisted in checking possible influence on the cost of companies in the yarn and fabric sector with shares negotiated in BM&FBovespa in the state of Santa Catarina. The authors investigated for a period of five years, in which, at some point in time the payroll exemption went into effect for that sector. In this study, it was concluded that the analysis of the cost of goods sold and total costs characterized that, there are changes in the cost of goods sold and the total costs of relief measures. Yet, in the analysis of net income, changes were not observed with relief measures.
Methodological Procedures
To carry out this study, the population comprises companies with shares traded in BM&FBovespa, from 2009 to 2014, covered by the payroll exemption policy. The definition of such companies is justified by the fact that these companies have the financial information necessary to conduct the analysis, once the financial statements are available for public consultation.
Table 1
Companies listed on the BM&FBovespa that make up the analysis
Sector Subsector Segment Corporate Name
Construcion and
Tranportation Construction and Engineering Civil Construction
Even Construtora e Incorporadora S.A. Gafisa S.A.
Helbor Empreendimentos S.A. Joao Fortes Engenharia S.A. Mrv Engenharia e Participações S.A. Rossi Residencial S.A.
Viver Incorporadora e Construtora S.A. Source: Adapted from BM&FBovespa (2015).
The sample is composed of companies in the Civil Construction sector that reported their financial statements in BM&FBovespa quarterly, between January 2009 and December 2014, cited in Table 1. It is noteworthy that government initiatives to payroll exemption, according to law measures, occur for certain groups, among which are Civil Construction and Transportation. These sectors are described in Appendix I, II and III of the IN RFB n. 1,436 / 13.
Therefore, it is assumed that companies which make up the analysis produce the items described and are subject to the application of such devices. There are, in this study, two variables analyzed: the Cost of Goods Sold and Total Costs (administrative expenses plus selling expenses), all values were relativized by dividing the net sales revenue, so that there is no distortion of data between companies of different sizes.
Through the presented context; it is defined as a hypothesis: the behavior of costs of companies in the civil construction segment with disclosed information in BM&FBovespa, after the relief measures, is statistically different from the period prior to the implementation of tax exemption law, as stated:
• H 0 - The costs do not exhibit behavioral changes as a result of tax relief measures; • H1 – The costs exhibit behavioral changes after tax relief measures.
Information of the comprising sample companies was gathered through BM&FBovespa website, as follows:
• RLV - Net Sales;
• CPV - Cost of Goods Sold; • DV - Sales expenses;
• DA - Administrative Expenses.
because it is not linked directly to the volume of production, but it relates more to the capital structure of each company, which is not analyzed herein.
In order to identify the impact of relief on the costs, the prepared graphs show a linear line trend, a linear regression equation and the descriptive statistics for each data set. In addition to the graphical analysis, in order to certify and support the conclusions, there will be a Student t test to verify the existence of differences between the average rates seen before and after the exemption phenomenon. Once you monitor a set of 16 observations prior to the exemption phenomenon and 8 observations after the exemption, the t test is parametrized.
In order to complement these results, a review panel of quarterly data over the period also allows you to observe the behavior of costs in light of the model proposed by Anderson, Banker and Janakiraman (2003):
Equation 1 – Model proposed for analysis
Source: Prepared by the authors based on Anderson, Banker and Janakiraman (2003).
The model presented in Equation 1 considers the RLV log of changes as independent variables and the CPV log of changes as a dependent (variation of the current period compared to the previous period). Thus, due to the constant α, of the angular coefficient β, the RLV
variation and the random error μ, it’s possible to predict which reflects the total costs due
to changes in RLV. In the model, the variable Dummy_Dim_RLV equals 1 when the RLV decreases from period t to t-1 and 0 when the RLV increases in this period, i.e., insert in the formula the effect of lowering the RLV from one period to another. To operationalize the model, Gretl software was used.
To check the possibility of statistical inferences, before the analysis, a normality data test is performed. There are several tests applicable in different contexts, in this case, the Shapiro-Wilk test is applied because of the sample size with a 5% significance level for all cost items, which attests to the normality of the data.
Results
In general, two sets of data are analyzed, resulting from companies with the exempt phenomenon in which the calculation base of the employer’s social security contribution was at 20% on the value of the manual labor revenue after the exemption phenomenon in which the base calculation became the revenues of companies with different tax rates across sectors and products. Thus, the data is compared from the periods (before and after), so that it characterizes, or not, the change on the costs and results in the segment under consideration.
Table 2
Descriptive statistics
Statistical Summary CPV/RLV CT/RLV LL/RLV
Average 0.2347 6.1623 -2.4928
Standard Errror 0.8982 12.4598 21.8220
Median 0.8339 2.4003 2.6541
Standard Diviation 4.4001 61.0405 106.9054
Variation Coefficient 18.7457 9.9055 -42.8849
Sample Variance 19.3607 3725.9454 11428.7635
Minimum -13.1519 -217.6270 -382.3767
Maximum 6.2695 175.2786 257.4836
Source: Survey data.
It is observed in Table 2 that the average ratio of total costs (CT) and net sales (RLV) is greater than 1 (one), i.e., the total costs are more than the total RLV. This feature can be confirmed by the average net income of data to be negative in the analysis, i.e., the data shows that, on average, the companies analyzed in this segment have loss in relation to net sales for the quarters considered in the analysis.
Still, it is emphasized that the LL data is much more dispersed compared to the others (CPV and CT). This information is evident through the variation coefficient of -42.8849, when compared to the value of 18.7457 CPV and 9.9055 of CT. The variation coefficient is calculated thru the ratio between the standard deviation and the average, thus, it represents a relative value dispersion (or concentration) of the data around the mean. In the case of LL, it is noticeable by the minimum (382.3767) and maximum (257.4836) value of the LL / RLV data.
Following the data analysis, we start an analysis of possible payroll exemption influence on the behavior of costs (tendency to increase or decrease). The study’s analysis is structured in 3 parts: i) the first part analyzes cost behavior of products sold, which aims to identify the impact of payroll exemption over the production process of enterprises, in other words, the impact that the phenomenon can cause while linked to the core business of companies in the Civil Construction industry, is verified; ii) the second part covers the behavior of the companies’ total costs, in order to analyze, in addition to production costs, administrative and sales expenses; and iii) the third part analyzes the possible exemption effects in relation to the company profit margin, because, if it influences the costs, there can be an effect on profit. Therefore, if there are reduction of costs, increases in net income are expected.
Cost Analysis of Goods Sold – COGS
Figure 1 - Behavior of cost of goods sold Source: Survey data.
Figure 1, in a general sense, demonstrates that the behavior of cost on goods sold has a visible slight downward trend over the quarters, with a determinant coefficient of 0.0071. However, it is noted in the period prior to the exemption that the downward trend is somewhat less pronounced, as evidenced by the trend line and the negative coefficient slope of -0.1302.
Thus, for the period after the adoption of tax exemption initiatives, the same slope is negative (-0.6559), with a r² of 0.0714, so, in the separate analysis period presents a higher downward trend in relation to the joint analysis, this ultimately covers a less pronounced tendency of the period prior to the phenomenon and thereby mitigate the drop effect observed in the long run.
The Student t test, in order to determine whether these trends before and after the phenomenon of Law change effectively, and are not simply explained by the randomness of the sample, as shown in Table 3, is applied. This t statistic is intended to test the research hypothesis that the costs show changes after payroll exemption initiatives.
It is evident in Table 3, although the averages present close values, due to a small variance, the test did not reject null the hypothesis at a significance level of 5% according to the 0.99% T significance. In other words, the test does not reject the hypothesis that the costs do not have change, i.e., there were no alterations in the costs of products sold through the exemption
Table 3
T - Test for relationship CPV/RLV
T - Test for CPV/RLV Before After
Average 0.184692 0.173082
Variance 12.82318 50.43573
Remarks 16 6
Mean difference of hypothesis 0
Gl 6
Stat t 0.003826
P(T<=t) two-tailed 0.997071
t critical two-tailed 2.446912
Source: Survey data
Analysis of Total Costs – CT
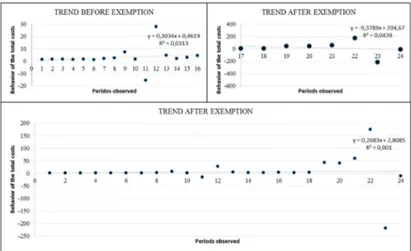
In order to analyze more thoroughly the effects of payroll exemption, not only on the CPV, this part of the study identifies potential effects on the total cost of businesses (CT = CPV + DV + DA) with an aim in understanding also the possible administrative effects, as shown in Figure 2, which shows the trends together and separate from the periods involving the phenomenon described.
Figure 2. Behavior of the total costs Source: Survey data.
thereafter, with a slope of -9.3789. Such trends are visually perceptible through the trace of the
trend line.
It is noteworthy that, compared to the CPV analysis, the total cost trend changes in the period before and after the phenomenon, differently to the CPV behavior. This result shows that the exemption does not only impact the company’s production area (factory floor), but also covers the administrative area due to the functional characteristics of civil construction companies under review. Thus, the t test is applied, in order to demonstrate if there are significant differences between the periods being analyzed, as demonstrated in Table 4.
Table 4.
T - Test for relationship CPV/RLV
T – Test for CT/RLV Before After
Average 3.12731 15.38582
Variance 66.53222 16802.76
Remarks 16 6
Mean difference hypothesis 0
Gl 5
Stat t -0.23147
P(T<=t) two-tailed 0.826122
t critical two-tailed 2.570582
Source: Survey data.
The t test developed at 5% significance level did not reject null the hypothesis, as shown in the test significance of 0.8261, that is, although there is a visual trend of change as shown in Figure 2, the data shows that there is no difference between the average total cost in the period before and after the payroll exemption. The analysis shows that despite the intensity with which the total costs decreased compared to the previous period, there is no difference between the two periods analyzed (before and after).
The results differ from those found by Ferrari, Kremer & Silva (2014), held in fabric and yarn companies in Santa Catarina, in which the variables CPV / RLV and CT / RLV showed decrease after exemption; proven by using the t-test comparison between the averages.
In order to relate previous studies, Richartz et al. (2011), concluded that there is no uniform behavior characterization of the relationship between the companies’ costs and revenues, which were surveyed. Even so, it indicated an increasing trend of the average between the costs and revenues, which, over time, companies tend to have their gross profit reduced. In order to relate these results with those achieved through this research, it is concluded that the civil construction’s industry total cost, on average, showed significant changes in the analyzed
period by alternating between periods of rise and fall.
Data Analysis Panel
The first part tests the hypotheses of the no bias estimator regression models, which consist of: variance constancy of the unobservable error term (no heterosk edasticity); randomness and independence of waste (no autocorrelation); normal distribution unobservable error terms; no perfect linear relationship between the explanatory variables (multicollinearity) (Wooldridge, 2010). Thus, the tests for each hypothesis are presented in Table 5:
Table 5.
Tests of Assumptions Data Regression Model panel
Assumption Heteroscedasticity Autocorrelation Normality Multicollinearity Test
Performed White’s Test Durbin-Watson Jarque-Bera Variance Impact of factor (VIF)
Test Result
Test result does not reject HO in favor of H1 at a significance of 1% - Lack of Heteroscedasticity
Rejects HO in favor of H1 at a significance level of 1% - Autocorrelation existance
Does not reject HO in favor of H1 at a significance level of 5% - Normal distribution of waste
Lack of Multicollinearity
Source: Prepared by the authors based on survey data.
As the results have shown in Table 5, the chances of bias existence were rejected, except autocorrelation, in which its existence of the data was attested by the Durbin-Watson test. In relation to autocorrelation, in order to make valid T and F statistics, the Robust Standard-Error method was used (Wooldridge, 2010). In view of the tests and corrections, the Data Reegression Model is estimated with the use of a fixed-effects estimator. The model was used to conduct the analysis of the costs of the companies listed in the Construction Sector of BM & FBOVESPA sample components, as shown in Table 6.
Table 6
Model estimation results
Variables Estimator Coefficient Robust Standard- Error Ratio t p-value
Constant Α -0.00496 0.029353 -0.19 0.844
Log Var. Revenue β 1 0.65982 0.290465 2.27 0.024
Dummy Dim. RLV β 2 -0.07564 0.256541 -0.29 0.768
Statistics F (2.158) 45.87 Adjusted R² 0.38
Prob>F 0
Source: Prepared by the authors based on survey data.
According to the results estimated in Table 6, the equation allows you to analyze the factors that explain the cost behavior are as follows:
The estimated model has one of the variables (Log Var. Revenue) statistically significant at 95%, as is usually accepted. Thus, it can be said that the change in net revenue sales influences the variation in costs. Net revenue corresponds to Gross revenue sales, less taxes imposed on it, among which, in the case of companies with tax relief, it is paid to Social Security (INSS).
Table 7
Asymmetry costs for the explanatory model
1% RLV Increase 1% RLV Decrease Assymmetry Behavior
General 0.6549 0.5793 0.1629 Sticky
Source: Prepared by the authors based on survey data.
As shown in Table 7, it is noted in the estimated model, for pessimism, that for a 1% increase in the RLV, the CPV increases 0.6549%. However, when there is a 1% RLV drop, CPV decreases 0.5793%, which corresponds to the sticky behavior. Regarding the exemption, costs tend to increase more with revenue increases, which decrease with reductions in revenue.
This is important for the management of companies in the Civil Construction sector and the variations caused by the measures of payroll exemption. These results feature a sticky behavior, which corroborates to the study of Anderson, Banker & Janakiraman (2003); and Werbin, Vinuesa & Porporato (2012).
Conclusions
From the point of view of cost behavior, this study identified the potential impacts of government initiatives dealing with payroll tax relief. It examined the impact on costs, and consequently, on the results of companies in the civil construction sector listed in BM&FBovespa between the periods of 2009-2014. The possible effects analysis of the phenomenon adopted a sample composed of 16 quarters prior to the exemption and 8 subsequent quarters to the exemption. This form of analysis enabled the visualization of relevant results amidst the expectations, since it provided for a reduction in total costs as well as improvements in the results of the companies studied after the exemption phenomenon.
In the analysis of the variables collected CPV / RLV and CT / RLV, all did not reject null the hypothesis in the Student t test. This result characterizes no changes in the amount of the cost of goods sold, in the total costs and the result of net income in relation to the period before
and after the relief efforts.
Therefore, throughout the analysis, the sample data did not present enough evidence to not reject null the hypothesis - that the cost items (CPV / RLV and CT / RLV) do not show changes with the relief efforts. It is emphasized that the results presented may have been characterized due to other factors, or variables, which were not analyzed in this research, as financial costs and the results of equity, can stand out, as well as the reasons for high LL variance amounts.
As suggestions for further studies, it is suggested to carry out the analysis of the segments as a whole, as well as other sectors that are also covered by governmental payroll exemption initiatives. It is also considered important the development of an analysis which considers a comparison on the number of employees in the companies, so that you can check the impact of payroll exemption in the manual labor costs.
References
Afonso, J. R. R., Soares, J. M., Castro, K. P. (2013). Avaliação da estrutura e do desempenho do
siste-ma tributário brasileiro: livro branco da tributação brasileira. Brasília: Banco Interamericano de
Desenvolvimento. (Texto para Discussão, n. 265) https://publications.iadb.org/handle/11319/5706 [accessed 05.10.2015]
Anderson, M. C.; Banker, R. D.; Janakiraman, S. N. (2003). Are selling, general, and administrative costs “sticky”? Journal of Accounting Research, 41(1), 47-63, https://doi.org/10.1111/1475-679x.00095 Balakrishnan, R.; Gruca, T. S. (2008). Cost Stickiness and Core Competency: A Note. Contemporary
Accounting Research, 25(4), 993-1006, https://doi.org/10.1506/car.25.4.2
BM&FBovespa – Bolsa de Valores, Mercadorias e Futuros (2015). Classificação do setor de atuação das companhias. Available in: http://www.bmfbovespa.com.br/ciaslistadas/empresaslistadas/BuscaEm-presaListada.aspx?idioma=pt-br# [accessed 05.10.2015].
Brasil (2015). Constituição Federal. Available in: http://www.planalto.gov.br/ccivil_03/constituicao/ constituicaocompilado.htm [acessed 05.10.2015]
Brasil (2015).Instrução Normativa RFB nº 1.436, de 20 de dezembro de 2013. Diário Oficial República Federativa do Brasil, Poder Executivo, Brasília, DF, 02 jan. 2014. Available in: http://normas.receita. fazenda.gov.br/sijut2consulta/link.action?idAto=48917&visao=anotado [accessed 12.10.2015] Brasil (2015). Lei nº 8212/1991, de 24 de julho de 1991. Available in:
http://www.planalto.gov.br/cci-vil_03/leis/l8212cons.htm [accessed 12.10.2015]
Brasil (2015). Lei nº 12546, de 14 de dezembro de 2011. Diário Oficial República Federativa do Brasil, Poder Executivo, Brasília, DF, 15 dez. 2011. Available in: http://www.receita.fazenda.gov.br/Legisla-cao/leis/2011/lei12546.htm [accessed 12.10.2015]
Brasil (2015). Lei nº 12715, de 17 de setembro de 2012. Available in: http://www.planalto.gov.br/cci-vil_03/_ato2011-2014/2012/lei/l12715.htm [accessed 12.10.2015]
Brasil (2015). Lei nº 12844, de 19 de julho de 2013. Available in: http://www.planalto.gov.br/ccivil_03/_ ato2011-2014/2013/lei/l12844.htm [accessed 12.10.2015]
Brasil (2015). Medida provisória nº 540, de 02 de agosto de 2011. Available in: http://www.planalto.gov. br/ccivil_03/_ato2011-2014/2011/mpv/540.htm [accessed 12.10.2015]
Brasil (2015). Medida provisória nº 601, de 28 de dezembro de 2012. Available in: http://www.planalto. gov.br/ccivil_03/_ato2011-2014/2012/mpv/601.htm [accessed 12.10.2015]
Brasil, Economia e Governo (2015). O que é desoneração da folha de pagamento e quais são seus possí-veis efeitos? Available in: http://www.brasil-economia-governo.org.br/2014/08/11/o-que-e-desonera-cao-da-folha-de-pagamento-e-quais-sao-seus-possiveis-efeitos/ [accessed 15.10.2015]
Calleja, K.; Steliaros, M.; Thomas, D. C. (2006). A note on cost stickiness: Some international compari-sons. Management Accounting Research,17(2), 127-140.https://doi.org/10.1016/j.mar.2006.02.001 Concla (2015). Comissão Nacional de Classificação. CNAE 2.0. Available in: http://www.cnae.ibge.gov.
br/estrutura.asp?TabelaBusca=CNAE_200@CNAE%202.0@0@cnae@0 [accessed 15.10.2015] Ferrari, M. J.; Kremer, A. W.; Pinheiro, N. S. (2013). Análise do comportamento dos custos no setor de
Ferrari, M. J.; Kremer, A. W.; Silva, M. C. (2014). Desoneração da folha de pagamento e comportamento dos custos das empresas de fios e tecidos do estado de Santa Catarina listadas na BM&FBOVESPA.
Anais do Congresso Brasileiro de Custos. Natal, RN, Brasil https://anaiscbc.emnuvens.com.br/anais/ article/view/3732 [accessed 03.10.2015]
Garrison, R. H; Noreen, E. W; Brewer, P. C. (2007). Contabilidade gerencial. Rio de Janeiro: LTC. Giambiagi, F. (2008). 18 anos de política fiscal no Brasil: 1991/2008. Economia Aplicada,12(4), p.
535-580. https://doi.org/10.1590/s1413-80502008000400002
Hansen, D. R.; Mowen, M. M. (2001). Gestão de custos: contabilidade e controle. São Paulo: Pioneira Thomson Learning: Cengage Learning.
He, D.; Teruya, J.; Shimizu, T. (2010). Sticky selling, general, and administrative cost behavior and its changes in Japan. Global Journal of Business Research, 4(4), 1-10. Available in: http://ssrn.com/abs-tract=1871276 [accessed 04.10.2015]
Khair, A.; Araujo, E. A.; Afonso, J. R. R. (2005). Carga tributária – mensuração e impacto sobre o cresci-mento. Revista de Economia & Relações Internacionais, 4(7), 27-42. Available in: http://www.faap. br/revista_faap/rel_internacionais/pdf/revista_economia_07.pdf [accessed 03.10.2015]
Mancuso, W. P.; Oliveira, A. J. (2006). Abertura econômica, empresariado e política: os planos doméstico e internacional. Revista Lua Nova,69(1), 147-172. https://doi.org/10.1590/s0102-64452006000400007 Medeiros, O. R.; Costa, P. S.; Silva, C. A. T. (2005). Testes empíricos sobre o comportamento assimétrico dos custos nas empresas brasileiras.Revista Contabilidade & Finanças, 16(38), 47-56. https://doi. org/10.1590/s1519-70772005000200005
Nascimento, E. L.; Juvella, S. B. (2014). Impactos da desoneração da folha de pagamentos no setor de construção civil. Anais do Simpósio de Gestão de Projetos. São Paulo, SP, Brasil, 3.
Oliveira, P. H. D.; Lustosa, P. R. B.; Sales, I. C. H. (2007). Comportamento de custos como parâmetro de eficiência produtiva: uma análise empírica da Companhia Vale Do Rio Doce antes e após a privatiza-ção. Revista Universo Contábil, 3(3), 54-7 http://proxy.furb.br/ojs/index.php/universocontabil/article/ view/597/533
Pervan, M.; Pervan, I. (2012). Sticky costs: evidence from Croatian food and beverage industry. Interna-tional Journal of Mathematical Models and Methods in Applied Sciences,8(6), 963-970. Available in: http://www.naun.org/main/NAUN/ijmmas/16-513.pdf [accessed 06.10.2015]
Plano Brasil Maior (2014). Plano Brasil Maior: Inovar para competir. Competir para crescer. Available in: http://www.brasilmaior.mdic.gov.br/conteudo/128 [accessed 12.10.2015]
Porporato, M.; Werbin, E. M. (2012). Active cost Management in banks: evidence of sticky costs in Argentina, Brazil and Canada. Int. J. of Financial Services Management, 5(4), 303-320. https://doi. org/10.1504/ijfsm.2012.048834
Receita Federal do Brasil (2015). Desoneração da folha de pagamento.Available in: http://idg.receita. fazenda.gov.br/dados/receitadata/gastos-tributarios/renuncia-fiscal-setorial [accessed 12.10.2015]
Richartz, F.; Nunes, P.; Borgert, A.; Dorow, A. (2011). Comportamento dos custos das empresas catari
-nenses que atuam no segmento fios e tecidos da BM&FBOVESPA. Anais do Congresso Brasileiro
de Custos. Rio de Janeiro, RJ, Brasil, 38. Available in https://anaiscbc.emnuvens.com.br/anais/article/
view/522 [accessed 12.10.2015]
Richartz, F.; Borgert, A.; Ferrari, M. J; Vicente, E. F. R. (2012). Comportamento dos custos das empresas brasileiras listadas no segmento de fios e tecidos da BM&FBOVESPA entre 1998 e 2010. Anais do
Congresso Brasileiro de Custos. Bento Gonçalves, RS, Brasil, 19. Available in
https://anaiscbc.emnu-vens.com.br/anais/article/view/341 [accessed 12.10.2015]
Tavares Junior, I. V.; Almeida, L. R.; Santos, C.B. (2015). A desoneração da folha de pagamento: os impactos causados na atividade de construção civil. Estudos, Goiânia, v. 42, n. 2, p. 175-186. ISSN: 1983-781X http://dx.doi.org/10.18224/est.v42i2.4016
Uy, A. O. O. (2011). Modeling cost behavior: linear models for cost stickiness. Academy of Accounting and Financial Studies Journal, 15(1), 25-34.
Werbin, E., M.; Vinuesa, L. M.; & Porporato, M.. (2012). Costos pegajosos (sticky costs) en empre-sas españolas: un estudio empírico. Contaduría y administración, 57(2), 185-200. http://www.scielo. org.mx/scielo.php?script=sci_arttext&pid=S0186-10422012000200009&lng=es&tlng=es. [accessed 10.10.2015]
Wooldridge, J. M. (2010). Introdução à econometria: uma abordagem moderna. São Paulo: Cengage Learning.