P-364
A METHOD FOR DETERMINATION OF THE IMPACT SOURCE
CHARACTERISTICS OF A HUMAN WALKER
43.55.Rg
Thaden, Rainer
Institute of Technical Acoustics, Aachen University (RWTH) D-52056 - Aachen
Germany
Tel: +49 241 8097999 Fax: +49 241 8092214
E-mail: rth@akustik.rwth-aachen.de
ABSTRACT
For the purpose of measuring the impedance of human walkers ‘in action’, an aluminium slab with three force transducers and a velocity transducer was used to determine force and velocity signals during walking. A model of the walker is introduced. It is based on an ideal force source with an impedance connected to a load impedance (floor). From the measured quantities the load impedances, the walker impedance and the force source are computed. The goal of this work is to develop a model of the impact sound insulation including the type of walker, floor and floor covering
INTRODUCTION
During recent years there has been a growing discussion about floor impact noise. It is discussed if the main floor impact source – the human walker – is properly represented by the tapping machine. It was found that the rating of floors according to the tapping machine, especially for light-weight floor constructions, can be wrong due to the low floor impedance and the mismatching between the source impedances of walker and tapping machine. The impedance of a human walker was measured and a modified tapping machine was presented by Scholl [1], to improve the matching between tapping machine impedance and human walker impedance.
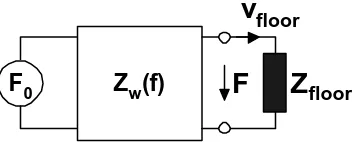
Z
Floor,
F
FloorZ
Walker, F
WalkerFig. 1: A human walker as impact source
However, impedance measurements done so far have the shortcoming that the impedance is measured in a static condition, where the foot rests upon a shaker with a force and velocity transducer. So it was tried to measure the inner impedance in motion, which means during walking, jumping, running etc.
Furthermore it was tried to characterise the walker not only by its impedance but also by the force which is introduced into the floor. So the walker is modelled by an ideal force source and an impedance. From this model the force introduced in an arbitrary floor construction can be calculated.
In this paper the ‘traditional’ measurements as well as the new approach is presented and some preliminary results are shown.
A MODEL OF THE HUMAN WALKER
A human walker can be modelled as an ideal force source and an impedance as seen in Fig. 2. Scholl [1] derived a simple mechanical model from impedance measurements using only two masses and a spring as shown in Fig. 3.
F
0Z
w(f)
F
Z
floorv
floor [image:2.596.208.384.567.638.2]m
w 2n
wm
w 1m
w 1=500 g
m
w 2=50 g
n
w=8.3 x 10
-5m/N
η
=500 g
j
ω
m
w 1j
ω
m
w 21/j
ω
n
wZ
w(f) [image:3.596.169.411.71.226.2]Z
w(f)Fig. 3: Simple mass-spring-mass model for the impedance of the human walker as in [1] The mass-spring-mass model has approximately the same impedance as a human walker as measured in [1]. The mass mw1 represents the ‘body’ of the walker and can be reduced to 500 g
(the mass of the hammers in the tapping machine) introducing changes only in the frequency range below 50 Hz. Accordingly Scholl proposes to use a modified tapping machine with a layer of rubber underneath.
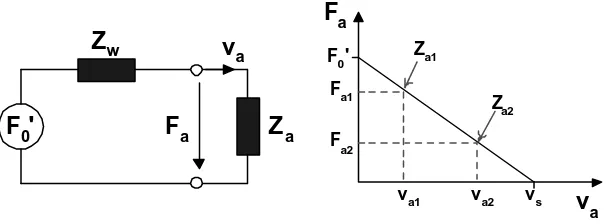
The impedance and the force source are transformed into a real force source with a different open-circuit force F0’ and an frequency dependent inner impedance Zw as shown in Fig. 4.
j
ω
m
w 1j
ω
m
w 21/j
ω
n
wZ
w
F
0Z
wF
0'
Fig. 4: Transforming the system of a two port and a force source into a Thevenin equivalent circuit
[image:3.596.141.448.394.481.2]F
0'
Z
wZ
aF
aF
av
av
a vs F0' [image:4.596.144.447.88.200.2]Fa1 F a2 va2 va1 Za1 Za2
Fig. 5: A real force source and its characteristic derived from two measurements with load impedances Za1 and Za2
For a frequency dependent source and impedance, a characteristic as in Fig. 5 has to be derived for each frequency.
The real force source behaves as follows: for floors with low connected impedances, a high velocity is introduced with already a small force. The higher the floor impedance, the lower the velocity and the higher the force. The power delivered by the source reaches a maximum if the load impedance and the inner impedance are equal. For a floor with an infinitely high impedance (like a concrete floor on the foundation of a building) the velocity is zero and the force is F0’. The velocity reaches its maximum vs at Za=0.
CALCULATION OF THE FORCE SOURCE AND THE INNER IMPEDANCE
From two measurements of the force Fa1, Fa2 and the velocity va1, va2 over two load impedances
Za1 and Za2 connected to the real force source the ideal source F0’ and the impedance Zw can
be calculated as follows:
2 1 2 1 0
'
a a a a s wv
v
F
F
v
F
Z
−
−
=
=
eq. 12 2 2 1 1 1
0
'
aa w a a a w a
F
Z
Z
Z
F
Z
Z
Z
F
=
+
⋅
=
+
⋅
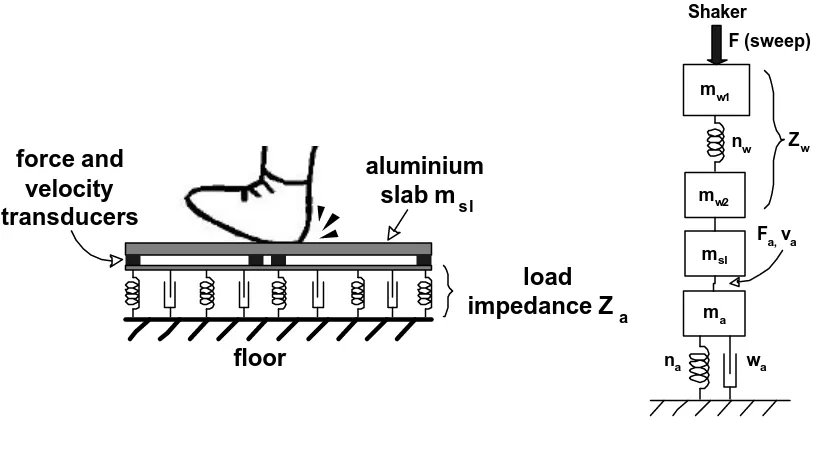
eq. 2MEASUREMENT SET-UP
signal-to-noise ratios, the connected load impedance should be in the same dimension as the inner impedance of the walker (matched impedances to produce high output signal).
To make first experiences with this measurement method, a model of the walker and the measurement set-up was built out of small springs and masses. The walker was modelled as mass-spring-mass system with mw1=400g, mw2=20g and nw=3.4·10
-6
. These model elements differ from the model parameters of Scholl [1] just for practical reasons (available material etc.). The aluminium slab which is to be used in the real measurement on a human walker is modelled by a steel cylinder with a mass of msl=380g. The load impedances consists of a mass
ma1=590g resp. ma2=40g and a spring na1=2.32·10 -7
m/N resp. na1=3.3·10 -7
m/N. As excitation source a shaker was mounted on top of this model making sure that for each two measurements the model was excited by identical forces. The excitation signal was shaped in a way, that the problems with low signal-to-noise ratios at higher frequencies are reduced. Fig. 6 shows the set-up for a measurement and the model built of masses and damped springs.
floor
aluminium
slab m
slforce and
velocity
transducers
load
impedance Z
amw2 mw1
msl nw
ma
na wa
Fa, va Zw Shaker
[image:5.596.97.505.284.518.2]F (sweep)
Fig. 6: Real measurement set-up and model
RESULTS
Fig. 7 shows the results of the force (upper curves) and the velocity (lower curves) measurement at two different load impedances. The differences Fa1 – Fa2 (upper curve) and va1
– va2 (lower curve) are shown in Fig. 8. Fig. 9 and Fig. 10 show the calculated impedance and
CONCLUSION
A model for the human walker was proposed which is based on an ideal force source and an inner impedance. To characterise the walker as impact source, the force and the impedance were determined. These quantities were derived from two measurements of the force and the velocity over two different load impedances. A measurement set-up consisting of an aluminium slab mounted on 3 force transducers and a velocity transducer and a variable load impedance underneath was developed. For first experiments, a model of the measurement set-up was built from small masses (metal cylinders) and damped springs (2 plastic slabs with rubber foam in-between). From the measured forces and velocities for two different load impedances, the inner impedance and the open-circuit force were calculated.
As a next step measurements on a ‘real’ human walker have to be carried out. The major work seems to be coping with the varying exciting force and the dynamics of the signals to be measured. Another problem is to build terminating mechanical impedances Za which show a
[image:6.596.306.503.302.447.2]linear behaviour under high loads as they appear during walking, running etc.
Fig. 7: Measured forces (upper curves) and velocities of the model over two different load
impedances. 0 dB = 1 N resp. 1 m/s
Fig. 8: Results from substracting the forces (upper curve) and the velocities.
[image:6.596.92.292.303.442.2]0 dB = 1 N resp. 1 m/s
Fig. 9: Resulting inner impedance Zw of the
model. 0 dB = 1 N resp. 1 m/s Fig. 10: open-circuit force F0 dB = 1 N resp. 1 m/s 0' of the model.
BIBLIOGRAPHICAL REFERENCES
[image:6.596.99.281.500.635.2]
![Fig. 3: Simple mass-spring-mass model for the impedance of the human walker as in [1]](https://thumb-us.123doks.com/thumbv2/123dok_es/5460224.111505/3.596.141.448.394.481/fig-simple-mass-spring-model-impedance-human-walker.webp)