Buenos Aires, 5, 6 y 7 de noviembre de 2008
FIA2008-A151
Quantification of structure born sound using scanning
laser velocimetry and BEM radiation calculations
Jose Cordova(a), Marco Beltman(b), Jessica Gullbrand(b), Rafael de la Guardia(a),
(a) Intel Tecnologia de Mexico SA de CV, Guadalajara Design Center, Systems Research Center Mexico, Parque Industrial Tecnologico II, Periferico Sur 7980 Edificio 4-E, 45600 Tlaquepaque, Jalisco, Mexico.
(b) Intel Corporation, Corporate Technology Group, 2111 NE 25th Avenue, 97124 Hillsboro, Oregon, USA.
Abstract
Fans are important noise sources in electronic systems. These devices are typically noisier when they are installed in systems. A standardized test methodology is available to experimentally determine the effect of the backpressure on the fan acoustic emission. In addition, the source character changes when it is installed because of the coupling with acoustic cavity modes. Finally, there is structural coupling between the fan and the installation structure. This paper outlines a new technique to quantify the contribution from the structure born sound by using scanning laser Doppler Velocimetry and a consequent boundary element calculation of the radiated sound. A fan is mounted to a square plate for this purpose, and acoustic and vibration measurements are performed. By using the new technique the contribution of the structure-born sound is quantified.
Resumen
1 Introduction
Low acoustic noise emissions from personal computers is important in order to comply with emerging eco-labels and government procurement specifications, and to meet customer demand for quieter systems. The fans that are present in these systems to provide airflow for cooling are primary noise sources. It is well known that the noise emission of fans under installed conditions is different from the acoustic emission of the fan. A specific ISO standard was developed to quantify the effect of the backpressure on the acoustic noise emission, using a fan plenum test device1. In addition, panels and obstructions can change the behaviour of acoustic sources such as fans, leading to significant increases in the radiated sound power in some cases2. The source character of the fan noise changes when the fan is installed. The reason for the change is because of the coupling with acoustic cavity modes3, 4, 5. Finally, the transmission of vibrations to the chassis through the mounting structures and the consequent radiation of sound from the panels is a key factor that needs to be quantified6.
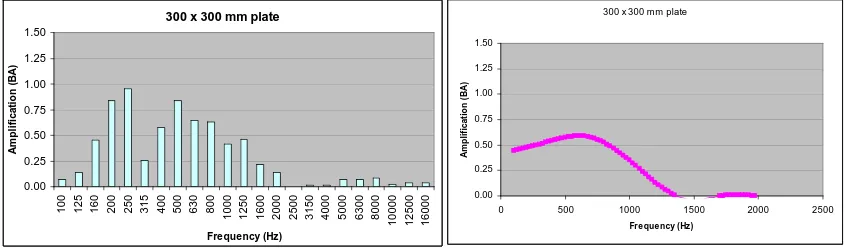
In a previous study4, an experimental setup was developed to quantify the change in source character when a fan is mounted on a plate. The acoustic emission of the fan was measured when it was unconfined and when it was mounted on a plate, where the plates varied in size. The amplification of the noise emission was found to increase with plate size, see Figure 1. The dipole character of the fan noise is broken up by the plate, resulting in increased acoustic noise. Experiments were performed for different mounting conditions: hard mount, soft mount and decoupled. In the decoupled case, the fan is located close to, but not actually making physical contact with the plate. In general, the results correspond well to the results of a boundary element model of a dipole in the presence of a solid, rigid surface.
300 x 300 mm plate
0.00 0.25 0.50 0.75 1.00 1.25 1.50 10 0 12 5 16 0 20 0 25 0 31 5 40 0 50 0 63 0 80 0 100 0 125 0 160 0 200 0 250 0 315 0 400 0 500 0 630 0 800 0 1000 0 1250 0 1600 0 Frequency (Hz) A m p lif ic a tio n ( B A )
300 x 300 mm plate
0.00 0.25 0.50 0.75 1.00 1.25 1.50
0 500 1000 1500 2000 2500
Frequency (Hz) Am p li ficat io n ( B A )
300 x 300 mm plate
0.00 0.25 0.50 0.75 1.00 1.25 1.50 10 0 12 5 16 0 20 0 25 0 31 5 40 0 50 0 63 0 80 0 100 0 125 0 160 0 200 0 250 0 315 0 400 0 500 0 630 0 800 0 1000 0 1250 0 1600 0 Frequency (Hz) A m p lif ic a tio n ( B A )
300 x 300 mm plate
0.00 0.25 0.50 0.75 1.00 1.25 1.50
0 500 1000 1500 2000 2500
[image:2.595.100.523.411.535.2]Frequency (Hz) Am p li ficat io n ( B A )
Figure 1. Measured and simulated amplification for fan with plate4.
The current paper extends this previous work and outlines a new technique to quantify the contribution from the structure born sound by using scanning Laser Doppler Velocimetry (LDV) and a consequent boundary element calculation of the radiated sound.
2 Problem Statement
3 Experimental approach
In this section an overview of the experimental approach for obtaining the vibrations is described, as well as the sound power setup for obtaining the overall sound power. The vibrations obtained from the Polytec Laser Doppler Vibrometer7 are then exported to LMS Virtual Lab8 software, where the component of acoustic noise radiated by the vibrating plate is calculated.
3.1 Experimental setup
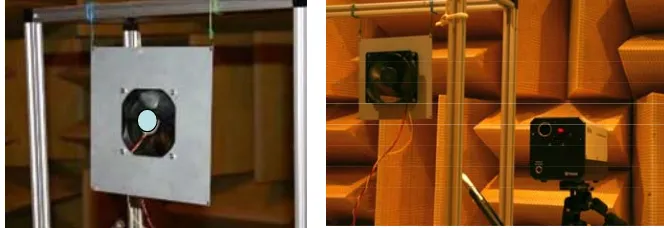
The experimental setup consists of mounting a standard 92 mm axial fan on a metal plate using four bolts, one in each corner (hard mount). The fan is a seven blade fan with three struts. The plates used in this investigation are three square steel plates with the outer dimensions of 150 x 150 mm, 200 x 200 mm and 300 x 300 mm. All the plates are 0.8 mm thick. There is an opening in the middle of the plate to allow for airflow. Pictures are shown in Figure 2 and Figure 3.
150x150 mm
200x200 mm
300x300 mm
150x150 mm
200x200 mm
300x300 mm
150x150 mm
200x200 mm
300x300 mm
[image:3.595.73.512.288.372.2]150x150 mm
200x200 mm
300x300 mm
[image:3.595.172.452.413.483.2]Figure 2. Steel plates and 92 mm fan configurations.
Figure 3. Details of fan mounting and airflow opening.
3.2 Scanning laser Doppler velocimetry
The measurements are performed using a Polytec PSV 3000 system. The plate is suspended in the middle of a precision grade anechoic chamber (according to ISO 3745), as shown in Figure 4. The chamber is mounted on dampers which mechanically isolate it from building vibrations.
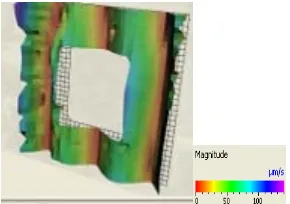
[image:3.595.144.476.621.735.2]For the measurements, a 40 x 40 grid is used for all plates. The scanning distance is 97 cm from the scanning head to the steel plate. The fan speed is held at a mean value with +/- 10 RPM approximately throughout the entire scan by applying a constant voltage. The key to the vibration measurements is the use of a reference microphone signal. This allows capturing the vibration magnitude and also the phase information. This is crucial in the consequent prediction of the acoustic radiation. The reference microphone is a Bruel & Kjaer 4190 condenser microphone, and is calibrated before each set of experiments. An example of typical vibration data is shown in Figure 5 for one experimental run. In this specific experiment, the fan was rotating at a speed of 1500 RPM and was mounted on the 200 x 200 mm plate. The map in Figure 5 shows the vibration velocity magnitude at a specific frequency, in this case 301.6 Hz.
Figure 5. Typical vibration data for the 200 x 200 mm steel plate.
3.3 Sound power determination
The radiated sound power was measured in a hemi-anechoic chamber, following the guidelines provided in ISO 37459. A microphone array was used with 10 Bruel & Kjaer 4190 microphones. Each of the microphones was calibrated before each series of experiments. The emitted sound power was measured for the fan in free space, the fan hard mounted to the plate, soft mounted to the plate and decoupled from the plate.
4 Numerical simulations
The velocity distributions for the measurements were imposed as boundary conditions in a boundary element calculation. This section outlines the transfer and acoustic radiation predictions.
4.1 Data transfer from scanning laser Doppler Velocimetry
Polytec system are not included in the export. In the Polytec software however, these points might still be visible in plots because they are interpolated, depending on the visualization settings.
4.2 Boundary element calculation
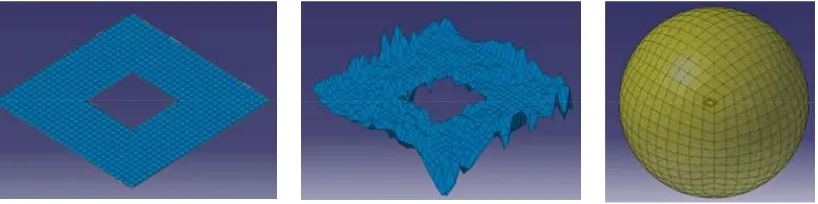
[image:5.595.97.506.243.345.2]As outlined before, the mesh and velocity distributions are imported using the universal file format. Consequently, a boundary element calculation is carried out using an indirect uncoupled approach. A spherical field point mesh with a radius of 2 m and 866 points is used to calculate the radiated sound power. The radiated sound power is only calculated at the frequencies corresponding to the frequencies of the bands in the mode set as shown in Figure 6.
Figure 6. Structural mesh, example plate deformation and field point mesh.
5 Results and discussion
In this section, the results of the experiments and simulations are outlined. First, the experimental results of the sound power measurements are shown, followed by an overview of typical measured velocity distributions. Finally, the radiated sound from these vibrations is presented and compared to the overall measured values.
5.1 Sound power measurements
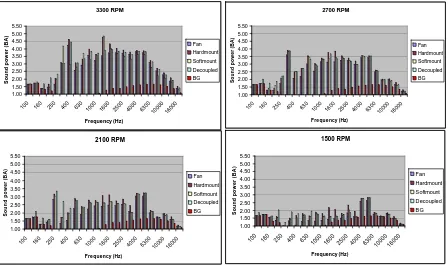
The results of the sound power measurements are given in Figure 7, 8 and 9.4 The results shown are for four different fan installation conditions where fan, refers to the measured fan sound power without any mounting condition. Hardmount refers to the fan bolted tightly to the plate. When special rubber connectors are used to hold the fan close to the plate and at the same time provide some damping between the fan and the plate is referred to as softmount. Finally, the decoupled legend refers to the case when the fan is held very close to the plate without making physical contact, therefore avoiding direct transmission of mechanical vibrations from the fan to the plate. BG refers to the back ground noise measured inside the anechoic chamber before each set of experiments.
3300 RPM 1.00 1.50 2.00 2.50 3.00 3.50 4.00 4.50 5.00 5.50
100 160 250 400 630 1000 1600 2500 4000 6300 1000016000
Frequency (Hz) Sound po w e r ( B A ) Fan Hardmount Softmount Decoupled BG 2700 RPM 1.00 1.50 2.00 2.50 3.00 3.50 4.00 4.50 5.00 5.50
100 160 250 400 630 1000 1600 2500 4000 6300 100
00 160
00
Fre quency (Hz)
S o und p o w e r (B A ) Fan Hardmount Softmount Decoupled BG 2100 RPM 1.00 1.50 2.00 2.50 3.00 3.50 4.00 4.50 5.00 5.50
100 160 250 400 630 1000 1600 2500 4000 6300
100 00 16000 Frequency (Hz) S ound pow e r (B A ) Fan Hardmount Softmount Decoupled BG 1500 RPM 1.00 1.50 2.00 2.50 3.00 3.50 4.00 4.50 5.00 5.50
100 160 250 400 630
[image:6.595.74.522.91.357.2]1000 1600 2500 4000 6300 10000 16000 Frequency (Hz) S ound p o w e r (B A ) Fan Hardmount Softmount Decoupled BG
Figure 7. Sound power measurements for fan on 300 x 300 mm plate.
Figure 8. Sound power measurements for fan on 200 x 200 mm plate.
1500 RPM 1.00 1.50 2.00 2.50 3.00 3.50 4.00 4.50 5.00 5.50
100 160 250 400 630 1000 1600 2500 4000 6300 10000 16000 Frequency (Hz) S oun d pow e r (B A ) Fan Hardmount Softmount Decoupled BG 2100 RPM 1.00 1.50 2.00 2.50 3.00 3.50 4.00 4.50 5.00 5.50
100 160 250 400 630 1000 1600 2500 4000 6300 1000 0 1600 0 Frequency (Hz) S ound pow e r ( B A ) Fan Hardmount Softmount Decoupled BG 2700 RPM 1.00 1.50 2.00 2.50 3.00 3.50 4.00 4.50 5.00 5.50
100 160 250 400 630 1000 1600 2500 4000 6300 1000 0 1600 0 Frequency (Hz) S oun d p o w e r (B A ) Fan Hardmount Softmount Decoupled BG 3300 RPM 1.00 1.50 2.00 2.50 3.00 3.50 4.00 4.50 5.00 5.50
[image:6.595.75.523.426.691.2]Figure 9. Sound power measurements for fan on 150 x 150 mm plate.
5.2 Representative velocity maps
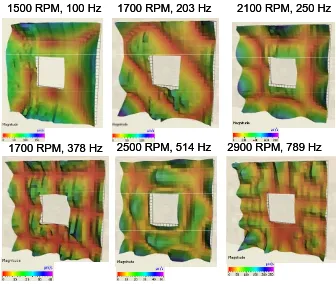
A set of representative velocity fields are shown in Figure 10. Note that the scales for these plots are different. Typical velocities are approximately between 50 μm/s and 500 μm/s.
Figure 10. Representative velocity maps for the 300 x 300 mm plate.
1500 RPM, 100 Hz
1700 RPM, 378 Hz
1700 RPM, 203 Hz 2100 RPM, 250 Hz
2500 RPM, 514 Hz 2900 RPM, 789 Hz
1500 RPM, 100 Hz
1700 RPM, 378 Hz
1700 RPM, 203 Hz 2100 RPM, 250 Hz
2500 RPM, 514 Hz 2900 RPM, 789 Hz
3300 RPM 1.00 1.50 2.00 2.50 3.00 3.50 4.00 4.50 5.00 5.50
100 160 250 400 630 1000 1600 2500 4000 6300 1000016000
Frequency (Hz) S o u nd po w e r (B A ) Fan Hardmount Softmount Decoupled BG 1500 RPM 1.00 1.50 2.00 2.50 3.00 3.50 4.00 4.50 5.00 5.50
100 160 250 400 630 1000 1600 2500 4000 6300 1000016000
Frequency (Hz) S o un d po w e r (B A ) Fan Hardmount Softmount Decoupled BG 2700 RPM 1.00 1.50 2.00 2.50 3.00 3.50 4.00 4.50 5.00 5.50
100 160 250 400 630 1000 1600 2500 4000 6300 1000 0 1600 0 Frequency (Hz) S o u nd pow e r ( B A ) Fan Hardmount Softmount Decoupled BG 2100 RPM 1.00 1.50 2.00 2.50 3.00 3.50 4.00 4.50 5.00 5.50
[image:7.595.128.464.455.739.2]The velocity maps illustrate the modal behaviour of the plate at low frequencies. The vibration shapes increase in complexity as frequency increases, and at frequencies around 1.5 kHz there are no longer a sufficient number of grid points to accurately capture the vibration shape. For this reason the acoustic radiation predictions will only be carried out for the low frequency range. Typically, the vibration excitation for a fan source shows peaks at the fundamental rotation frequency and its higher harmonics. Therefore it can be expected that the vibration magnitude of the plate is high when one of these excitation frequencies coincides with a resonance frequency of the plate.
5.3 Structurally radiated sound
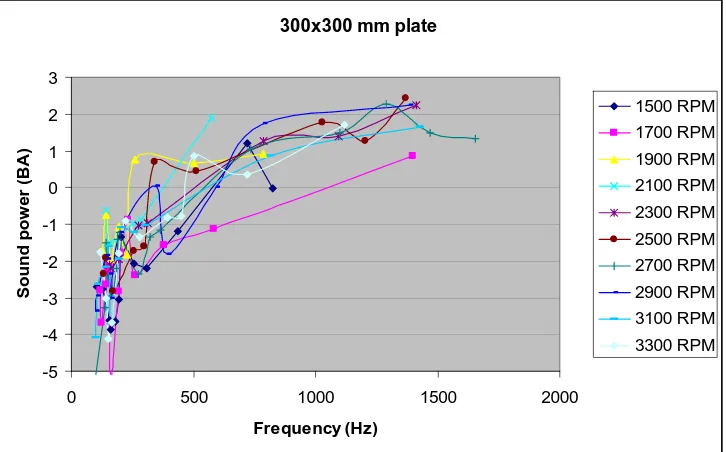
The radiated sound from structural vibrations as a function of frequency are shown in Figures 11, 12 and 13. The figures indicate that the structurally induced noise is lower than that of the pure fan noise. Even though the amplitudes of some of the low frequency vibrations are higher, the radiated sound is relatively low because of the low frequency and because of the additional A-weighting that was applied. In general, the radiated sound power is slightly higher for the larger plate sizes, although some exceptions exist because of the modal coupling that occurs at specific frequencies and fan speeds. For example, between 2700 and 2900 RPM there are some significant contributions that were also observed in the sound power experiments.
300x300 mm plate
-5 -4 -3 -2 -1 0 1 2 3
0 500 1000 1500 2000
Frequency (Hz)
S
ound pow
e
r (
B
A
)
[image:8.595.118.481.412.638.2]1500 RPM 1700 RPM 1900 RPM 2100 RPM 2300 RPM 2500 RPM 2700 RPM 2900 RPM 3100 RPM 3300 RPM
200x200 mm plate
-5 -4 -3 -2 -1 0 1 2 3
0 500 1000 1500 2000
Frequency (Hz)
S
oun
d p
o
w
e
r
(B
A
)
[image:9.595.116.482.79.307.2]1500 RPM 1700 RPM 1900 RPM 2100 RPM 2300 RPM 2500 RPM 2700 RPM 2900 RPM 3100 RPM 3300 RPM
Figure 12. Radiated sound power for 200x200 mm plate.
150x150 mm plate
-5 -4 -3 -2 -1 0 1 2 3
0 200 400 600 800 1000 1200 1400
Frequency (Hz)
S
o
un
d p
o
w
e
r (
B
A
)
1500 RPM 1700 RPM 1900 RPM 2100 RPM
2300 RPM 2500 RPM
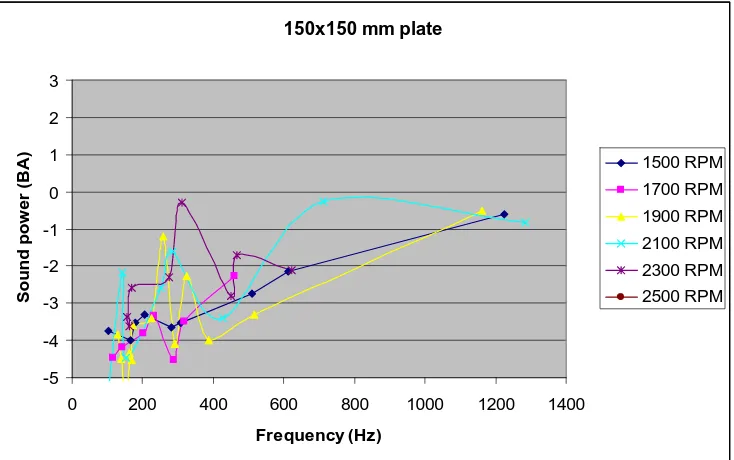
Figure 13. Radiated sound power for 150x150 mm plate.
[image:9.595.116.483.380.610.2]-2 -1 0 1 2 3 4
1000 1500 2000 2500 3000 3500
Fan speed (RPM)
S
o
u
nd powe
r up
t
o
1
.5
k
H
z
(
B
A
)
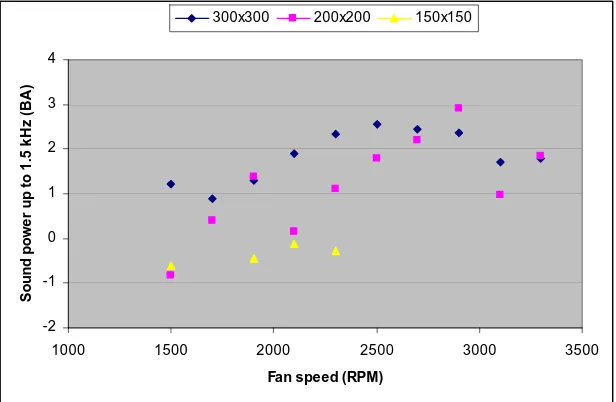
[image:10.595.144.452.93.294.2]300x300 200x200 150x150
Figure 14. Radiated sound power as a function of fan speed.
6 Conclusions
A methodology has been developed to quantify the contributions of the radiated sound from structural vibrations. Detailed surface velocity profiles are measured with a scanning Laser Doppler Vibrometer. The data is transferred to a numerical simulation package and the radiated sound power is calculated from the associated surface vibrations using a boundary element technique. In the case of an axial fan mounted on a plate, it is shown that the contribution of structurally radiated noise is very low compared to that of the airborne sound. Only in very specific cases is the structurally radiated sound of the same order of magnitude as the aero-acoustic fan noise. The structurally radiated sound is shown not to scale directly with the fan speed, as opposed to the aero-acoustic fan noise by itself.
Acknowledgements
References
1 Acoustics - Method for the measurement of airborne noise emitted by small airmoving devices, ISO
10302:1996, International Organization for Standardization, Geneva, Switzerland.
2 W. M. Beltman: Quantification and modelling of fan installation effects. Inter-Noise 2006, Honolulu,
Hawaii, December 3-6, 2006
3 Lee, M.; Stuart Bolton, J.; Yoo, T.; Ido,H.; Seki, K. (2005) “Fan Noise Control by Enclosure
Modification”, InterNoise 2005, Rio de Janeiro, Brazil.
4 Beltman, W.M. (2006) “Quantification and modeling of fan installation effects”, InterNoise 2006,
Honolulu, Hawaii, U.S.A.
5 Beltman, W.M.; de la Guardia, R; Cordova, J.A. (2007) “The acoustic amplification of system
enclosures using elementary noise sources”, Noise-Con 2007 conference, Reno, NV, U.S.A.
6 W.M. Beltman (2005) “Radiated noise from structural vibrations of a PC”, NoiseCon 2005,
Baltimore, U.S.A.
7 Polytec user manual, Polytec GmbH, 2008
8 LMS user manual, Virtual.Lab, LMS International, 2008. 9
Acoustics - Determination of sound power levels of noise sources using sound pressure -- Precision
methods for anechoic and hemi-anechoic rooms, ISO 3745:2003, International Organization for