A MICROFLUIDIC DEVICE FOR ULTRASONIC SEPARATION
PACS REFERENCE: 43.35.Ty
Hill1, Martyn; Harris2, Nicholas R.; Townsend1, Rosemary; Beeby2, Stephen P.; Shen1, Yijun; White2, Neil M.; Hawkes3, Jeremy J.
1
School of Engineering Sciences, 2Department of Electronics and Computer Science, University of Southampton,
Southampton, UK
Tel: +44 (0)23 8059 3075 Fax: +44 (0)23 8059 3053 E-mail: m.hill@soton.ac.uk
3
Cardiff School of Biosciences, Cardiff University
Cardiff CF10 3TL, UK (Now at DIAS, UMIST, Manchester, M60 1QD, UK)
ABSTRACT
This paper describes a microfabricated device designed to provide continuous flow filtration on a microfluidic scale. It uses ultrasound in the megahertz frequency range to concentrate particles at a single node within the flow. It has the potential to allow either clarified fluid or concentrated particle samples to be prepared and hence offers the possibility of a replacement for a centrifugal separator for microfluidic systems. It is primarily constructed using silicon and Pyrex, making it highly compatible with established microfabrication techniques. The modelling, design, fabrication and initial testing of the device are discussed, along with the potential for future developments in the area.
INTRODUCTION
Ultrasonic standing waves generate forces on particles within that standing wave which act towards nodes or antinodes of the standing wave [1]. This can be used to aggregate particles, to manipulate and fractionate particles, or to separate particles from the carrying fluid.
This paper describes a device which falls into the latter category, being a microfluidic flow through separator, and is an extension of previous work performed by Hawkes and Coakley at Cardiff University into similar devices [2, 3]. These devices were fabricated using traditional techniques, typically from layers of steel and glass. The aim of this work is to fabricate similar devices that are compatible with emerging microfluidic systems, and have the potential to replace conventional centrifugal separation systems for analysis on a microfluidic scale. A separator with the ability to clarify samples or concentrate particles within a sample has important potential applications in integrated microfluidic sensing systems and will be a MEMS device with the ability to concentrate, filter, and harvest particles, cells, and second phases from within a fluid.
DESIGN OF THE MICROFLUIDIC SEPARATOR
of the problems current problems in bonding bulk pzt to a silicon device. Figure 1 shows a schematic cross-section of the prototype.
Pyrex
Cavity
Silicon
In PZT Clean Dirty
Figure 1 Schematic cross-section of device
As in the Cardiff laminar flow filter [2], a fluid/particle mixture is drawn into the device through the port on the left of the figure. An acoustic standing wave of a half wavelength is maintained within the cavity and as the particles move through the field they migrate to the pressure node at the centre of the cavity. A fraction of the particle-free fluid can then be drawn from the “clean” outlet and the remainder of the fluid/particle mixture can be drawn from the final, dirty outlet. Such a scheme allows for a relatively small quantity of clarified fluid to be produced, but different geometries have the potential to increase the proportion of clarified fluid recovered, or alternatively to increase the concentration of the particles recovered from the “dirty” outlet.
Acoustic Modelling
Previous work [5] has allowed the characterization and validation of a multi-layered resonant structure, constructed in stainless steel, and this work has been extended to include the silicon/Pyrex construction described here.
P Z T Transducer
Silicondiaphragm
Fluidlayer
P y r e xreflector A d h e s i v e L a y e r
Figure 2 The structural diagram of the layered resonator system
The schematic of Figure 2 shows the structure of the layered resonator system used to model the micromachined ultrasonic separator, and is composed of a piezoelectric transducer, a layer of adhesive, a silicon layer, a filtration chamber filled with fluid, and a Pyrex reflector plate.
Data produced by Hawkes and Coakley [2] has shown the clearance of the stainless steel chamber against frequency. Modelling, using the method described by Hill and Wood [6] demonstrated that a good indication of actual filtration performance could be predicted by the product of the acoustic energy stored in the fluid and the driving frequency (the “energy frequency product”) [5]. The model was used to calculate the energy frequency product against frequency for the Cardiff cell, and this is shown, together with the experimental clearance data, in Figure 3.
2 2.2 2.4 2.6 2.8 3 3.2 3.4 3.6 3.8 4 0
0.2 0.4 0.6 0.8 1
F r e q u e n c y ( M H z )
[image:3.596.312.477.78.209.2]Clearance or Energy Frequency Product (Normalised)
Figure 3. Energy frequency product (solid line) and experimental clearance
data (dashed line).
0.1 0.15 0.2 0.25 0.3 0.35 0.2
0.4 0.6 0.8 1 1.2 1.4 1.6 1.8 2 2.2
C a v i t y D e p t h ( m m )
Stored Energy*frequency (peak) (J/s)
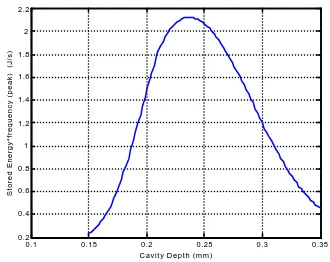
Figure 4 Effect of changing the cavity depth
In order to allow comparison with the performance of the stainless steel filter described in [2], the target cavity depth was in the region of 250ìm, to allow a nominal half-wave resonance of about 3MHz. Figure 4 shows the predicted variation in energy frequency product as the depth of the cavity etched into the Pyrex layer is varied. Based on these predictions, a cavity depth of 240ìm was selected.
2 2.2 2.4 2.6 2.8 3 3.2 3.4 3.6 3.8 4 0
0.5 1 1.5 2 2.5
F r e q u e n c y ( M H z )
Energy Frequency Product (J/s)
(a)
2 2.2 2.4 2.6 2.8 3 3.2 3.4 3.6 3.8 4 0
0.2 0.4 0.6 0.8 1 1.2 1.4 1.6 1.8
Frequency (MHz)
Energy Frequency Product (J/s)
(b)
Figure 5 Predictions of energy frequency product for (a) silicon and (b) steel devices.
If the predicted energy frequency curves for the silicon device are compared with those for the original stainless steel chamber (Figure 5), it can be seen that the curve for the silicon device, has a single dominant peak of slightly higher magnitude. Despite a wide tolerance on peak magnitudes due to uncertainties in material parameters, these simulated results suggest that a silicon-fabricated device has the potential to perform at least as well as the steel chamber.
Fluid Modelling
Computational fluid dynamics (CFD) is being used to investigate the fluid flow through the separator devi ce, principally to highlight flow phenomena which may be detrimental to the separating performance of the device. The software currently being used for this work is CFX 5.4.1, a commercially available, general purpose CFD package.
The region to be considered for the CFD modelling consists of the silicon/Pyrex section of the device, and excludes the block on which the silicon/Pyrex part is set, containing the relatively large (≤φ1mm) inlet and outlet feed channels.
[image:3.596.105.483.342.487.2]set of governing equations and the no-slip condition should be used to describe the fluid flow.[7, 8]
All preliminary CFD simulations have been completed in 2D to reduce computation time. This has the effect of making the flow domain infinitely wide; ignoring the wall effects either side of the flow and making it possible to apply theory pertaining to flow between parallel plates. Initial simulations have been used to optimise the mesh parameters used to create the 2D model and also demonstrate the short distance over which the flow becomes fully developed, typical with the flow rates and micron scale considered for the device.
The entry length, Le, downstream of which the flow is fully developed and the velocity profile remains constant, is described for laminar flow by [9]
Re
06
.
0
≈
d
L
eSo for example, where water flows at 0.2m/s between parallel plates 100µm apart, the entry length is
(
)
120
001
.
0
10
100
2
.
0
1000
06
.
0
06
.
0
2 6 2
=
×
×
×
×
=
≈
−µ
ρ
vd
L
e µm [image:4.596.188.414.390.516.2]This channel flow example has been modelled in CFD and Figure 6 shows the resulting velocity variation along the centre line and includes the theoretical entry length of 120µm calculated above, clearly correlating excellently with the CFD results where the velocity ceases to change.
Figure 6 CFD results of centre line velocity over inlet region
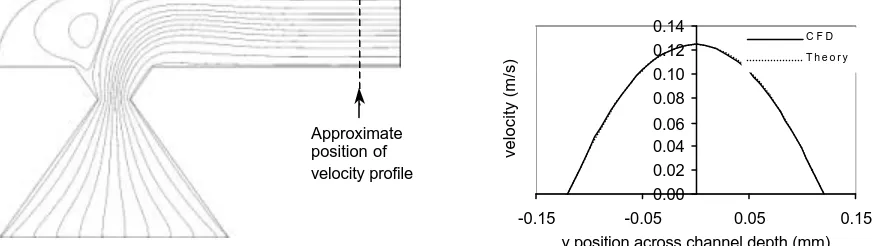
Further mesh dependency studies are required to improve the accuracy of the model and as an initial validation will use the above theoretical velocity profile in addition to experimental results. Initial results are good as Figure 7 indicates for the inlet region of the device.
Figure 7 CFD model of inlet section and resulting velocity profile
0.00 0.05 0.10 0.15 0.20 0.25 0.30 0.35
0.00 0.10 0.20 0.30 0.40
axial distance from inlet (mm)
velocity (m/s)
Entry region Developed region
0.00 0.02 0.04 0.06 0.08 0.10 0.12 0.14
-0.15 -0.05 0.05 0.15
y position across channel depth (mm)
velocity (m/s)
C F D T h e o r y
[image:4.596.92.528.604.727.2]Simulations using the separator geometry have illustrated the extent of separation regions in the flow as shown in Figure 7 for the device inlet region. This suggests a potential for solid particles in the flow to gather in these virtually stagnant regions and presents problems associated with the cleaning of the device between operations and the sudden release of a cluster of particles impeding the separation efficiency of the ultrasonic field and even causing clogging. The influence of these separating regions must be investigated through experiment and will result in recommendations for modifications to the inlet and outlet geometry.
CONSTRUCTION
Two types of device have been fabricated, one with double chamfered ports and one with single chamfered ports. In order to achieve this, double sided wafer processing was required. This was achieved using a double sided alignment process and standard wet KOH etching leaving chamfers at the angle of 54.7o. The chamber was then formed by etching a 1.7mm thick Pyrex wafer to the desired depth of 240µm. This was achieved with a 30 minute etch in 48% buffered Hydrofluoric acid using a chrome/gold mask (50nm and 500nm thick respectively) and Shipley S1818 resist in order to minimise pinholes. The silicon and Pyrex wafer were then anodically bonded together.
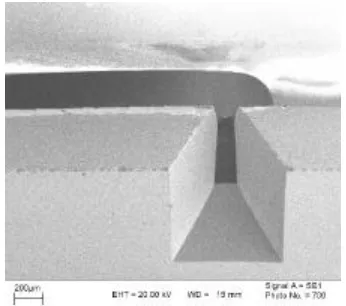
Figure 8 shows an SEM of a single chamfer port, and a section of the Pyrex cavity, while Figure 9 shows a photograph of the finished separator, mounted on a Perspex manifold, to allow easy connection of pipe work.
INITIAL TESTING
1 1.5 2 2.5 3 3.5 4 0
5 0 1 0 0 1 5 0 2 0 0 2 5 0 3 0 0 3 5 0 4 0 0 4 5 0 5 0 0
Impedance Magnitude (Ohms)
[image:5.596.105.278.202.355.2]F r e q u e n c y ( M H z )
Figure 10 Impedance of empty chamber (Modelled – solid line)
1 1.5 2 2.5 3 3.5 4 0
5 0 1 0 0 1 5 0 2 0 0 2 5 0 3 0 0 3 5 0 4 0 0 4 5 0 5 0 0
Impedance Magnitude (Ohms)
F r e q u e n c y ( M H z )
Figure 11 Impedance of full chamber (Modelled – solid line)
In order to test the accuracy of the model, impedance testing has been performed on the assembled prototype. Impedance represents a parameter that is relatively easy to measure experimentally, unlike other parameters such as energy frequency product, allowing partial verification of the model. Impedance measurements were taken using a Hewlett Packard
[image:5.596.315.493.204.359.2] [image:5.596.99.495.534.702.2]4192A frequency analyser, under PC control. Initially measurements were taken with both 0.5 and 1V excitation amplitudes, but no measurable difference was noted and so all subsequent measurements were taken at an excitation voltage of 1V.
Figure 10 shows the measured and modelled impedance of the empty chamber, and Figure 11 shows the results for a chamber filled with fluid. It should be noted that the above results have been modelled with an adhesive layer of 60ìm and damping characteristics throughout the device are estimated from the experimental data. The main features to note are that an extra peak appears at 3.1MHz for the full device, which is due to the intensity of the standing wave formed in the cavity. When the device is empty (full of air), the structure shown in Figure 2 effectively has the fluid and the Pyrex layer removed, hence the lack of a trace due to the cavity resonance in Figure 10. While the model predicts some of the main features of the impedance trace, there is fine detail which the model does not reflect, probably because it is restricted to one dimension. The adhesive layer thickness will be reduced in future prototypes and the elimination of the variability and uncertainty caused by the adhesive is a major motivation for using printed, rather than bulk, PZT in future designs.
CONCLUSIONS
A micromachined microfluidic ultrasonic separator has been modelled, designed and built using standard micromaching processes. The results from the model compare favourably with the results obtained from models of a previous separator built in stainless steel. Further work will test the devices and develop the concept to use a thick-film PZT actuator rather than the bulk PZT currently used.
ACKNOWLEDGMENTS
The authors with to thank the Engineering and Physical Research Council (EPSRC) for their financial support under grant number GR/R13333/01. We also gratefully acknowledge the Financial support given by Dstl and Microfiltrex Ltd.
REFERENCES
[1] M. Gröschl, "Ultrasonic separation of suspended particles - Part I: Fundamentals,"
Acustica, vol. 84, pp. 432-447, 1998.
[2] J. J. Hawkes and W. T. Coakley, "Force field particle filter, combining ultrasound standing waves and laminar flow," Sensors and Actuators B-Chemical, vol. 75, pp. 213-222, 2001.
[3] J. J. Hawkes, M. Groschl, H. Nowotny, S. Armstrong, P. Tasker, W. T. Coakley, and E. Benes, "Single half wavelength ultrasonic particle filter: Predictions of the transfer matrix multi-layer resonator model and expreimental filtration results.," Journal of the Acoustical Society of America, vol. 111, pp. 1259-1266, 2002.
[4] N. R. Harris, M. Koch, S. P. Beeby, N. M. White, and A. G. R. Evans, "Thick-Film printing of PZT onto silicon for micromechanical applications.," presented at Micromechanics Europe, Hardanger, Norway, 1998.
[5] M. Hill, Y. Shen, and J. J. Hawkes, "Modelling of layered resonators for ultrasonic separation.," Ultrasonics, vol. 40, pp. 385-92, 2002.
[6] M. Hill and R. J. K. Wood, "Modelling in the design of a flow-through ultrasonic separator," Ultrasonics, vol. 38, pp. 662-665, 2000.
[7] M. Gad-el-Hak, "The fluid mechanics of microdevices - The Freeman Scholar
Lecture," Journal of Fluids Engineering-Transactions of the Asme, vol. 121, pp. 5-33, 1999.
[8] J. Pfahler, J. Harley, H. Bau, and J. Zemel, "Liquid Transport in Micron and