UNIVERSIDAD DE VALLADOLID
ESCUELA DE INGENIERIAS INDUSTRIALES
Grado en Ingeniería en Organización Industrial
FEASIBILITY STUDY OF A SOCIAL HOUSING
ENERGY RETROFIT PROJECT
Autor:
Teixeira Luciano, Leandro Filipe
Responsable de Intercambio en la Uva:
Francisco Javier Rey Martínez
Universidad de Malta
TÍTULO: FEASIBILITY STUDY OF A SOCIAL HOUSING ENERGY RETROFIT PROJECT
ALUMNO: Leandro Filipe Teixeira Luciano FECHA: 24/06/2019
El objetivo principal es identificar la combinación más adecuada de medidas pasivas de acondicionamiento para mejorar el confort térmico y el rendimiento energético en bloque de viviendas sociales (BVS) en Malta. Se modeló un BVS utilizando el software dinámico DesignBuilder-EnergyPlus. Se utilizaron los modelos de confort adaptativo EN 15251 y ASHRAE para evaluar el confort térmico en el piso superior del BVS, demostrando que tiene los peores niveles de comodidad. Los resultados mostraron que el confort térmico adaptativo no se cumple. Sin embargo, una vez que se introducen todas las medidas pasivas de acondicionamiento se alcanzan los niveles de confort térmico adaptativo. El análisis financiero y macroeconómico resultaron ser negativos. Otros beneficios sociales, como la reducción de la pobreza energética, la mejora de la comodidad y el bienestar de los ocupantes y la reducción de las cargas máximas en la central eléctrica, la viabilidad global de renovar los BVS se vuelve más atractiva.
FEASIBILITY STUDY OF A SOCIAL HOUSING ENERGY
RETROFIT PROJECT
Leandro Filipe Teixeira Luciano
Institute for Sustainable Energy
University of Malta
FEASIBILITY STUDY OF A SOCIAL HOUSING ENERGY
RETROFIT PROJECT
Leandro Filipe Teixeira Luciano
A dissertation presented at the
Institute for Sustainable Energy of the University of Malta, Malta
in partial fulfilment of the requirements for the degree of
Bachelor of Industrial Engineering
at the
Universidad de Valladolid, Spain,
No portion of the work referred to in the dissertation has been submitted in support of an application for another degree or qualification of this or any other university or other institute of learning.
Signature of Student Name of Student
June 2019
1) Copyright in text of this dissertation rests with the Author. Copies (by any process) either in full, or of extracts may be made only in accordance with regulations held by the Library of the University of Malta. Details may be obtained from the Librarian. This page must form part of any such copies made. Further copies (by any process) made in accordance with such instructions may not be made without the permission (in writing) of the Author.
I
Abstract
II
Acknowledgements
I would like to thank my supervisor, Dr. Ing. Charles Yousif and my co-supervisor Ing. Damien Gatt for their continuous help and support. Certainly, without their support, leadership and knowledge sharing, this dissertation would not have been possible. Their presence, advice and critical comments throughout this study enabled me to improve my work.
III
Contents
Abstract ... I
Acknowledgements... II
Contents ... III
List of Figures ... VI
List of Tables ... XIII
List of Abbreviations ... XV
Introduction ...1
Literature Review...3
2.1 Energy consumption of buildings and relevant EU directives including Malta’s national priorities ... 3
2.2 Energy auditing and retrofit methodologies ... 5
Operational Rating energy auditing methodology ... 5
Energy performance benchmarking ... 6
Retrofit methodologies ... 7
2.3 Comfort analysis for naturally ventilated buildings and ways to avoid overheating in buildings ... 12
Introduction ... 12
Thermal Comfort ... 14
Humidity ... 22
Indoor Air Quality and ventilation ... 22
CBE Thermal Comfort Tool ... 23
Ways to avoid overheating in a building ... 26
Assessing overheating ... 28
2.4 Housing authority buildings retrofit measures and case studies ... 29
Similar local study ... 29
Housing retrofit studies in Mediterranean climate ... 30
More local studies ... 32
2.5 Housing authority and ERDF priority axis 4 ... 33
2.6 Energy simulation ... 34
2.7 Gaps in literature ... 37
Methodology ...38
3.1 Description and choice of building under study... 38
Why the building was chosen ... 38
Building fabric (U-Values) ... 40
3.2 Data Collection ... 40
Questionnaires ... 40
IV
Installation of Sensors ... 41
Statistical analysis and identification of the baseline energy consumption ... 41
3.3 Building Energy modelling of base (actual building) scenario ... 42
Use of software and why it was chosen ... 42
Use of questionnaires to understand typical equipment inside building ... 43
Questionnaire analysis ... 43
Floor choice level for analysis ... 43
Hourly calibration of simulated temperatures with actual logged data ... 43
Comfort analysis and comfort analysis approaches ... 44
Comfort assessment of the base (as is) building ... 45
3.4 Identification of retrofit measures ... 47
Identification of potential retrofit measures ... 47
Comfort analysis with all measures ... 51
Global sensitivity analysis using standardised beta coefficient to rank retrofit measures based on discomfort hours on summer and winter design weeks ... 51
3.5 Re-evaluation of thermal comfort based on the results of the sensitivity analysis ... 52
3.6 Financial analysis ... 52
Financial calculation using NPV, Payback period and financial global cost .... 53
Macroeconomic global cost calculation ... 54
Results and Discussion ...55
4.1 Questionnaires and data collected from the dwellings ... 55
4.2 Baseline scenario energy consumption pie-chart ... 55
4.3 Questionnaires statistical analysis and calibration ... 56
Questionnaires statistical analysis ... 56
Hourly temperature Calibration ... 59
4.4 Comfort plots for the current building envelope with no mechanical heating and cooling59 Discussion for the current building envelope with no mechanical heating and cooling 69 4.5 Comfort analysis for the scenario with all passive retrofit measures implemented .. 70
Discussion for the scenario with all passive retrofit measures implemented .... 79
4.6 Global sensitivity analysis ... 79
Discussion for the Global sensitivity analysis ... 83
4.7 Comfort analysis plots performed removing the least important measures one by one 84 4.8 Financial and Macroeconomic analysis results ... 95
Discussion for the Financial and Macroeconomic analysis ... 100
V
5.1 Further research ... 103
References ...104
Appendix 1 ...110
VI
List of Figures
Figure 1: Malta's National Renewable Energy Action Plan [7] ... 4
Figure 2: Operational rating energy auditing methodology [15] ... 6
Figure 3: Key phases in a sustainable building retrofit programme [21] ... 7
Figure 4: Key elements influencing building retrofits [21] ... 9
Figure 5: Main building retrofit technologies [21] ... 10
Figure 6: Cost versus environmental benefits (CO2 emissions reduction) of the energy hierarchy [21] ... 11
Figure 7: The nZEH strategies [24] ... 11
Figure 8: Different indoor environmental parameters [26] ... 13
Figure 9: PPD/PMV Thermal Comfort Graph [28] ... 16
Figure 10: Psychometric chart comfort analysis (PMV/PPD Model) for Malta [34] ... 17
Figure 11: Design Values for the indoor operative temperature for buildings without mechanical cooling systems as a function of the exponentially weighted running mean of the outdoor temperature [25] ... 19
Figure 12: ASHRAE 80% thermal acceptability adaptive comfort model and M. Vellei et al. model for RH impact on the ASHRAE Adaptive Comfort Model [36] ... 21
Figure 13: CBE Thermal Comfort Tool - EN 15251 PMV method [38] ... 24
Figure 14: CBE Thermal Comfort Tool – EN 15251 adaptive comfort method [38] .. 25
Figure 15: CBE Thermal Comfort Tool - ASHRAE adaptive comfort method [38] ... 25
Figure 16: Sources of heat gain [40] ... 27
Figure 17: Potential measures to minimise heat gains [40] ... 27
Figure 18: Hot spell in April [39] ... 28
Figure 19: Hot spell in July [39] ... 29
Figure 20: Relationship between different energy models [58] ... 35
Figure 21: Building energy model methodologies [58] ... 36
Figure 22: Żabbar location and 3D case study building ... 39
Figure 23: Building distribution and building blueprint ... 39
Figure 24: HOBO MX Temp/RH Data Logger (MX1101) ... 41
Figure 25: Building model on DesignBuilder ... 45
Figure 26: Simplified top floor model on DesignBuilder and top floor plan showing dwellings’ configuration ... 46
Figure 27: Dwellings and zones for each orientation ... 46
Figure 28: EPS Insulation proposed ... 49
VII
VIII
IX
X
XI
XII
XIII
List of Tables
Table 1: Description of the applicability of the categories used [25] ... 14
Table 2: 7-Point thermal sensation scale [25] ... 15
Table 3: Recommended categories for design of mechanical heated and cooled buildings [25] ... 16
Table 4: Examples of recommended design values of the indoor temperature for design of buildings and HVAC systems [25] ... 17
Table 5: Recommended design criteria for the humidity on occupied spaces[25] ... 22
Table 6: Basic required ventilation rates for diluting emissions from people for different categories [25] ... 23
Table 7: Basic required ventilation rates for building emissions [25] ... 23
Table 8: Building envelope properties and materials ... 40
Table 9: Retrofit measures considered and their properties ... 48
Table 10: Blind/slat properties ... 49
Table 11: Prices of each potential retrofit measure [63] ... 54
Table 12: MLR Significant variables out of 26 observations ... 57
Table 13: Discomfort - Comfort answers percentages per floor level ... 57
Table 14: Temperature statistical calibration indicators for the bedroom in which the data logger was installed (Bedroom 1 B) ... 59
Table 15: Humidity statistical calibration indicators for Bedroom 1B ... 59
Table 16: Base Comfort analysis codification ... 59
Table 17: Base Comfort analysis and implementation of potential retrofit measures codification ... 70
Table 18: Standardized Coefficients Beta for the Summer design week for the EN 15251 Category II discomfort hours ... 80
Table 19: Standardized Coefficients Beta for Summer design week for the ASHRAE 80% acceptability adaptive comfort model ... 81
Table 20: Standardized Coefficients Beta for Winter design week for heat loads ... 82
Table 21: Base Comfort analysis and implementation of potential retrofit measures, all retrofit measures without façade insulation and all retrofit measures without double glazing codification ... 85
Table 22: Actual Building with A/C vs Building with All measures per orientation ... 95
Table 23: Actual Building with A/C vs Building with All measures + A/C per orientation ... 96
XIV
XV
List of Abbreviations
A/C Air Conditioner
AECD Annual Electric Consumption per Dwelling
ASHRAE American Society of Heating, Refrigerating and Air-Conditioning Engineers
BRB Building Regulation Board CBE Center for the Built Environment CBSA Computer Based Simulation Audit
CIBSE Chartered Institution of Building Services Engineers CV(RMSE) Coefficient of Variance of the Root Mean Square Error DHW Domestic Hot Water
DPP Discount Payback Period ECMs Energy Conservation measures
EC Energy Consumption
EE Energy Efficient
EED Energy Efficiency Directive EI Effectiveness Index
EPBD Energy Performance of Buildings Directive EPI Energy Performance Indicator
EPS Expanded Polystyrene Standard ERDF European Regional Development Fund
EU European Union
GDPR General Data Protection Regulation
HP Heat Pumps
HVAC Heating, Ventilation and Air Conditioning IAQ Indoor Air Quality
IET Indoor Thermal Environment IRR Internal Rate of Return
XVI
MEPRS Minimum Energy Performance Requirements MLR Multiple Linear Regression
NCM National Calculation Methodology NEEAP National Energy Efficiency Action Plan NMBE Normalized Mean Bias Error
NPV Net Present Value
NREAP National Renewable Energy Action Plan NZEB Nearly Zero Energy Building
nZEH near Zero Energy Home
PB Payback
PL Plug Loads
PMV Predicted Mean Vote
PPD Predicted Percentage of Dissatisfied PV Photovoltaic System
RE Renewable Energy
RED Renewable Energy Directive RH Relative Humidity
SA Standard Audit
SPP Simple Payback Method/Period T&C Test and Commissioning
VAT Value Added Tax
WH Water Heater
1
Introduction
The building sector is responsible for the 40% of EU’s energy consumption. By 2050, the EU aims to reduce up to 90% of the greenhouse gas emissions in the building sector, but around 90% of EU’s buildings were built before 1990 and the renovation rate is still very low (1 – 2% per year) [1][2]. However, the building sector is adopting the low-carbon economy roadmap [3]. The energy performance of building is covered by the Energy Performance of Building Directive (EPBD) [4] and the Energy Efficiency Directive (EED) [5]. According to the EPBD, all new buildings and buildings to undergo major renovation are to be nearly zero energy buildings by the end of 2020. By the end of 2020, the EED has established EU measures to achieve its 20% energy efficiency objective. Nonetheless, at present time, the EED from 2012 is been revised and the energy efficiency objective will increase from 20% in 2020 to 32.5% in 2030 [6].
The new EPBD of 2018 has shifted its focus from new buildings to deep renovation of existing buildings, together with energy use of appliances, lighting and healthy indoor climate, requiring EU member states to establish long-term renovation strategies, aiming at decarbonising the national building stocks by 2050 and reach the Nearly Zero Energy Building objective (NZEB).
On the other hand, Malta has its own specific strategies, encouraging the use of renewable energy, targeting a 10% of renewable energy, and improving energy efficiency in buildings by 2020 [7][8].
Technical Document F [9][10] stipulates the minimum energy performance for buildings in Malta, setting the minimum requirements for building services through a cost-optimal analysis. However, no guidelines have been specified to successfully energy retrofit housing buildings in practice.
2
actual energy performance regulations in buildings, so thermal comfort cannot be assured as the roofs are not insulated and many external walls are single file.
Thus, this project will also address a very important issue - energy poverty. Tackling energy poverty brings about multiple benefits, including less money spent by governments on health, reduced air pollution, better comfort and wellbeing, improved household budgets, and increased economic activity.
Once the lessons learned from this project are established and the most adequate retrofit measures established, this project can be replicated with relative ease to other housing building stocks. In addition, any schemes for the housing sector promoting energy efficiency can also be based on the most effective and practical measures learnt from this project.
Renovation of such buildings will set a best-practice example to other entities and will enhance the social corporate responsibility of the Housing Authority, by contributing towards the reduction of carbon emissions and enhancing the quality of life of social housing tenants. This dissertation answers the following research questions:
• Do typical social housing apartments in Malta, built prior to minimum energy
performance regulations, comply with thermal comfort standard requirements?
3
Literature Review
2.1
Energy consumption of buildings and relevant EU directives
including Malta’s national priorities
In 2016, the building sector was responsible for 40% of EU’s energy consumption, 36% of EU’s CO2 emissions and 55% of EU’s electricity consumption. Old buildings generally use more energy than new buildings. Currently, 90% of EU’s buildings were built before 1990 and the renovation rate is still very low with the result that energy efficiency can still be improved [1]. By 2050, the EU aims to reduce up to 90% of the greenhouse gas emissions in the building sector, through the adoption of clean technologies (low-carbon economy roadmap) [3], when compared to the 1990 levels [2].
4
Malta has its own specific targets as required by both EPBD and EED, encouraging the use of renewable energy and improving energy efficiency in buildings by 2020:
• To comply with the EED, the National Energy Efficiency Action Plan developed for Malta (NEEAP for Malta) a target saving 1.032 GWh over the period 2014-2020 [12].
• To comply with the Renewable Energy Directive (RED) [13], Malta prepared
the National Renewable Energy Action Plan (NREAP for Malta), targeting a 10% of renewable energy, as seen in Figure 1 [7].
• All new buildings and buildings undergoing major renovation must be NZEB by
the end of 2020 as detailed in the Nearly Zero Building’s Plan for Malta [8], which is in accordance with the EPBD.
Figure 1: Malta's National Renewable Energy Action Plan [7]
5
rating approach, as seen in Technical Document F. Part 1 [9], [14]. On the other hand, Technical Document F, Part 2 [10] sets the minimum requirements for building services.
Despite the setting out of these requirements, actual guidelines to successfully energy retrofit housing buildings in practice and when based on operational energy performance have not yet been set. To enable such guidelines a typical housing block must be carefully studied in practice and evaluated via an energy auditing approach.
2.2
Energy auditing and retrofit methodologies
According to ISO 50002 [15], Energy Audit is defined as the “Systematic analysis of energy use and energy consumption of audited objects, in order to identify, quantify and
report on the opportunities for improved energy performance”.
Energy auditing as defined in ISO 50002, bases the analysis directly on the actual “operational” energy rating of the building.
Operational Rating energy auditing methodology
Operational Rating as an energy auditing methodology consists, as described in ISO 50002, of the following steps (Figure 2):
• Energy audit planning: Planning means defining the purpose of the audit choosing the relevant criteria to be gather from the building and dwellings.
• Opening meeting: Meeting similar to a Project Charter [16] where the different prospective parties are introduced to the audit aims and limits, while also reaching an agreement related to other important details.
• Data collection: The auditor analyses all the data to be gathered, organize and record according to the audit objectives.
• Measurement plan: The auditor and other parties must agree on different issues to gather on-site data, such as the measurement time and equipment used.
• Conducting the site visit: The person in charge of the facility/building/dwelling must give all necessary details to the auditor.
6
• Energy audit reporting: The auditor confirms that the energy auditing requests have been met and applicable measures have been identified.
• Closing meeting: Meeting realized once the auditing is finalized. The energy saving plans can be discussed from an economic point of view being able to quantify and rank all energy saving plans that can be adopted.
Figure 2: Operational rating energy auditing methodology [15] It is important to say that ISO 50002 describes three more forms of auditing:
• Type 1: Auditing more suitable for small facilities
• Type 2: Auditing where technical specifications in detail are required.
• Type 3: Once Type 1 and Type 2 have been done, auditing requires prospects
with excessive cost and risk.
Energy performance benchmarking
7
identifies the potential opportunities of energy savings once you compare the actual energy consumption. The most common used EPI is the kWh/m2·year.
Retrofit methodologies
Retrofitting an existing building stock is not mandatory so far, even though only between 1.0% and 1.5% in the building sector are new buildings [18], [19]. This means, around 80% of the energy consumption by 2050 will be influenced by existing building stock and between one to over four centuries will be necessary to improve the building stock to the current new construction’s energy level [20]. Thus, retrofitting existing buildings is necessary for achieving EU Energy and Climate Change Directive’s targets. It is a considerable challenge in the energy building sector to reduce energy consumption meanwhile reducing/eliminating greenhouse gases and being cost effective for the building and occupants.
There are sundry techniques for an effective retrofit project. Cooper, Daly and Ledo’s article [21] set retrofitting process of a building into five phases (Figure 3).
Figure 3: Key phases in a sustainable building retrofit programme [21]
• Phase I: ‘Project Setup and Pre-retrofit Survey’. The extension of the project and project’s targets are defined. It is common to use a pre-retrofit survey to better understand the building operational problems and the main occupants’ solicitudes. Frequently, the survey is assigned to Energy Service Companies, which are both responsible for planning and retrofitting the building.
• Phase II: ‘Energy Auditing and Performance Assessment’. As described before,
8
conservation measures (ECMs) can be implemented. There are different energy audits, ranging from ‘Walk Through Audit’ (WTA), ‘Standard Audit’ (SA), and the ‘Computer Based Simulation Audit’ (CBSA). For CBSA, the building is designed on a computer-based model, which replicates the energy consumption of the real building, considering the building physical condition and orientation for its calculation. The computer-based model is retrofitted with energy conservation measures for a simulation of what is expected on the renovated building energy consumption.
• Phase III: ‘Identification of Retrofit Options’. Thanks to CBSA, various retrofits
can be simulated and synthesized into the ones who fit best the extension of the project, performing a compelling economic analysis and risk assessment.
• Phase IV: ‘Site Implementation and Commissioning’. The retrofitting measures
considered will be implemented on-site and Test and Commissioning (T&C) is then employed, ensuring that the systems operate in an optimal manner.
• Phase V: ‘Validation and Verification’. The last phase validates and verifies the
expected energy savings. Maintenance and Verification (M&V) [22], [23] can be used to verify energy savings.
It is recommended to carry out a post occupancy survey to ascertain if the building occupants are satisfied with the overall retrofit results.
9
Figure 4: Key elements influencing building retrofits [21]
Building retrofit technologies can be classified into three groups (Figure 5):
• Supply side management: Use of renewable energy technologies, as
photovoltaics or wind power systems, to generate green energy and the use of electrical systems retrofit.
• Energy consumption patterns: Management and change of human factors.
• Demand side management: Can be classified into two different strategies.
o Heating and cooling demand reduction through retrofitting building fabric and other advanced technologies as windows shading.
10
Figure 5: Main building retrofit technologies [21]
Different studies had been carried out for Malta on different building retrofit technologies, particularly on the supply side management and energy efficient equipment and low energy technologies due to its few energy resources and climate. Section 2.4 delves deeper into more detailed information about different retrofit technologies and energy efficiency measures used in Malta.
11
Figure 6: Cost versus environmental benefits (CO2 emissions reduction) of the energy hierarchy [21]
Malta is a country with limited land and energy resources. That is why it is so important to consider the energy hierarchy of priorities, when improving the energy performance of buildings. The near Zero Energy Home (nZEH) strategies [24] shown in Figure 7 describe different strategies according to the type of energy resources and their use and cost.
12
• First stage: ‘Be Lean’ strategy focuses on reducing energy demand as result of
an effective and efficient building design and retrofit (energy efficient equipment and low energy technologies).
• Second stage: ‘Be Clean’ strategy focuses on using efficiently energy systems to
reduce the energy consumption, when the measures taken in ‘Be Lean’ are not enough.
• Third stage: ‘Be Green’ strategy focuses on using renewable energies fulfilling
the prior stage.
Renewable energies depend on location, land and natural resources. That is why Malta should only follow ‘Be Green’ strategies when the two prior stages are carried out, evaluated and implemented; that means, assuring energy efficiency and thermal comfort for occupants.
2.3
Comfort analysis for naturally ventilated buildings and
ways to avoid overheating in buildings
Introduction
13
Figure 8: Different indoor environmental parameters [26]
The Standard EN 15251 states: “An energy declaration without a declaration related to the indoor environment makes no sense. Therefore, there is a need for specifying criteria for the indoor environment for design, energy calculations, performance and operation of buildings”.
Besides environmental conditions and the build-up of the building, there are individual conditions affecting comfort, such as individual metabolic rate and the type of clothing
used [27]. In order to evaluate thermal comfort, the EN ISO 7730 [28] and the CEN CR 1752 [29] form the backbone. These norms define the process to be followed
to determine and interpret thermal comfort using the predicted mean vote (PMV) and the predicted percentage of dissatisfied (PPD) indices, as determined by Fanger [30]. EN 15251 helps defining and establishing the main parameters to be used in building energy calculation and long-term evaluation of the indoor thermal environment (IET).
14
The recommended input values differ according to four different categories, shown in Table 1:
Table 1: Description of the applicability of the categories used [25]
Thermal Comfort
Thermal Comfort has been defined as “that condition of mind that expresses satisfaction with the thermal environment and is assessed by subjective evaluation” [31].
Reaching NZEB targets is an urgency. Half of the energy used in buildings is due to heating, ventilation and air conditioning (HVAC) energy consumption [32].
For Thermal comfort EN 15251 defines two models which are the PMV/PPD model and the adaptive comfort model. The PMV/PPD model is applicable to mechanically heated and cooled spaces, while the adaptive comfort model should be used to assess comfort in buildings without mechanical cooling, that is naturally ventilated.
2.3.2.1 Mechanically cooled and heated buildings – PMV/PPD model
15
The criteria for the ITE shall be based on the thermal comfort indices:
o PMV: “Predicted Mean Vote is and index that predicts the mean value of the votes of a large group of persons on the 7-point thermal sensation scale given in Table 2, based on the heat balance of the human body” [28]
o PPD: “Predicted Percentage Dissatisfied is an index that establishes a quantitative prediction of the percentage of thermally dissatisfied people who feel too cool or too warm. Thermally dissatisfied people are those who will vote hot, warm, cool or cold on the 7-point thermal sensation scale given in Table 2.” [28]
Table 2: 7-Point thermal sensation scale [25]
Both criteria were proposed by Povl Ole Fanger [30], by which he succeeded in explaining that the sensation experienced by a person was a function of the physiological strain imposed on him/her by the environment. Relating both criteria he was able to predict what comfort vote would arise for different environmental conditions.
Having the PMV value, we can calculate PPD using the equation (1) below.
𝑃𝑃𝐷 = 100 − 95 ∗ exp(−0.03353 · 𝑃𝑀𝑉4− 0.2179 · 𝑃𝑀𝑉2) (1)
16
Figure 9: PPD/PMV Thermal Comfort Graph [28]
According to the different categories we can table (Table 3) the different ranges for the PMV which complies with EN 15251.
Table 3: Recommended categories for design of mechanical heated and cooled buildings [25]
17
Table 4: Examples of recommended design values of the indoor temperature for design of buildings and HVAC systems [25]
The comfort range of a building for both summer and winter based on the PMV/PPD method can be visualised via a psychometric chart. Tools such as Climate consultant can be used to show both the comfort range hourly values of climate data for a typical year on the same psychometric chart. This plot will enable architects and engineers to identify the most suitable passive and active measures to satisfy comfort for a specific climate. Figure 10 shows a psychometric climate plot for Malta and the best measures identified by Climate consultant [33] to achieve comfort.
18
2.3.2.2 Buildings without mechanical cooling – EN 15251 Adaptive Comfort Model
“Adaptive thermal comfort models have become widely accepted and have been
increasingly used in recent years despite the fact that model differences in regulatory documents and minor uncertainties in applications still do exist” [35]. The Adaptive Comfort Model of the European Standard EN 15251 is employed for estimating thermal comfort in buildings without mechanical cooling. EN 15251 adaptive comfort model is not influenced by humidity or occupants’ metabolic rate and clothing. The comfort temperature according to this model is a function of the outdoor running mean temperature.
Thermal adaptation and prediction are strongly related to outdoor climatic conditions and human beings’ tendency to adapt to changes in climate.
Due to the nature of this study, it is appropriate to state that all apartments do not have constant mechanical cooling conditions. In this case, summer temperatures are chiefly used for the provision of passive thermal controls (e.g. solar shading, opening windows, etc) avoiding overheating of the building when needed.
19
Figure 11: Design Values for the indoor operative temperature for buildings without mechanical cooling systems as a function of the exponentially weighted running mean of the outdoor temperature
[25]
𝛩𝑟𝑚= 𝑂𝑢𝑡𝑑𝑜𝑜𝑟𝑅𝑢𝑛𝑛𝑖𝑛𝑔𝑚𝑒𝑎𝑛𝑇𝑒𝑚𝑝𝑒𝑟𝑎𝑡𝑢𝑟𝑒℃
𝛩𝑜= 𝐼𝑛𝑑𝑜𝑜𝑟𝑐𝑜𝑚𝑓𝑜𝑟𝑡𝑡𝑒𝑚𝑝𝑒𝑟𝑎𝑡𝑢𝑟𝑒℃
The equations representing the lines for Category I, Category II and Category III in Figure 11 are:
Category I 𝑈𝑝𝑝𝑒𝑟𝑙𝑖𝑚𝑖𝑡:𝛩𝑖𝑚𝑎𝑥 = 0.33 · 𝜃𝑟𝑚+ 18.8 + 2 (2)
𝐿𝑜𝑤𝑒𝑟𝑙𝑖𝑚𝑖𝑡:𝛩𝑖𝑚𝑖𝑛 = 0.33 · 𝜃𝑟𝑚+ 18.8 − 2 (3)
Category II 𝑈𝑝𝑝𝑒𝑟𝑙𝑖𝑚𝑖𝑡:𝛩𝑖𝑚𝑎𝑥 = 0.33 · 𝜃𝑟𝑚+ 18.8 + 3 (4)
𝐿𝑜𝑤𝑒𝑟𝑙𝑖𝑚𝑖𝑡:𝛩𝑖𝑚𝑖𝑛 = 0.33 · 𝜃𝑟𝑚+ 18.8 − 3 (5)
Category III 𝑈𝑝𝑝𝑒𝑟𝑙𝑖𝑚𝑖𝑡:𝛩𝑖𝑚𝑎𝑥 = 0.33 · 𝜃𝑟𝑚+ 18.8 + 4 (6)
𝐿𝑜𝑤𝑒𝑟𝑙𝑖𝑚𝑖𝑡:𝛩𝑖𝑚𝑖𝑛 = 0.33 · 𝜃𝑟𝑚+ 18.8 − 4 (7)
20
2.3.2.3 Buildings without mechanical cooling – ASHRAE Adaptive Comfort Model
ASHRAE also defines an adaptive comfort model. Like the EN 15251 model, for the ASHRAE model, the operative comfort temperature (toc) is a function of the outdoor running mean temperature (tout). Two comfort categories are defined as follows:
90% Thermal acceptability:
𝑈𝑝𝑝𝑒𝑟𝑙𝑖𝑚𝑖𝑡:𝑡𝑜𝑐 = 0.31 · 𝑡𝑜𝑢𝑡+ 17.8 + 2.5 (8)
𝐿𝑜𝑤𝑒𝑟𝑙𝑖𝑚𝑖𝑡:𝑡𝑜𝑐 = 0.31 · 𝑡𝑜𝑢𝑡+ 17.8 − 2.2 (9) 80% Thermal acceptability:
𝑈𝑝𝑝𝑒𝑟𝑙𝑖𝑚𝑖𝑡:𝑡𝑜𝑐 = 0.31 · 𝑡𝑜𝑢𝑡+ 17.8 + 3.5 (10) 𝐿𝑜𝑤𝑒𝑟𝑙𝑖𝑚𝑖𝑡:𝑡𝑜𝑐 = 0.31 · 𝑡𝑜𝑢𝑡+ 17.8 − 3.5 (11)
21 Toc RH > 60%:
𝑈𝑝𝑝𝑒𝑟𝑙𝑖𝑚𝑖𝑡:𝑡𝑜𝑐𝑅𝐻>60% = 0.53 · 𝑡𝑜𝑢𝑡+ 12.85 + 2.84 (12) 𝐿𝑜𝑤𝑒𝑟𝑙𝑖𝑚𝑖𝑡:𝑡𝑜𝑐𝑅𝐻>60% = 0.53 · 𝑡𝑜𝑢𝑡+ 12.85 − 2.84 (13) Toc 40% <RH ≤60%:
𝑈𝑝𝑝𝑒𝑟𝑙𝑖𝑚𝑖𝑡:𝑡𝑜𝑐40%<𝑅𝐻≤60% = 0.53 · 𝑡𝑜𝑢𝑡+ 14.16 + 3.7 (14)
𝐿𝑜𝑤𝑒𝑟𝑙𝑖𝑚𝑖𝑡:𝑡𝑜𝑐40%<𝑅𝐻≤60% = 0.53 · 𝑡𝑜𝑢𝑡 + 14.16 − 3.7 (15)
Toc RH ≤40%:
𝑈𝑝𝑝𝑒𝑟𝑙𝑖𝑚𝑖𝑡:𝑡𝑜𝑐𝑅𝐻≤40%= 0.52 · 𝑡𝑜𝑢𝑡 + 15.23 + 4.40 (16)
𝐿𝑜𝑤𝑒𝑟𝑙𝑖𝑚𝑖𝑡:𝑡𝑜𝑐𝑅𝐻≤40%= 0.52 · 𝑡𝑜𝑢𝑡 + 15.23 − 4.40 (17)
As seen in Figure 12, the operative comfort temperatures are higher and steeper than those predicted by the ASHRAE 80% thermal acceptability adaptive comfort model. The operative comfort temperatures are lower when the RH is high and higher when the RH is low. The smallest temperature acceptability range for the impact of RH corresponds to the high RH, meanwhile, the acceptability range for medium RH is equal to the ASHRAE 80% acceptability range.
22 Humidity
Humidity does not factor in the ASHRAE and EN 15251 adaptive comfort models, which is a main limitation of this model, given that the role of humidity on comfort is well documented [36]. Besides, long term high indoor humidity could cause microbial growth. On the other hand, very low humidity causes irritation and dryness of air ways and eyes. Thus, humidification and dehumidification are needed for long periods of time and when needed according to Table 5.
Table 5: Recommended design criteria for the humidity on occupied spaces[25]
Indoor Air Quality and ventilation
One important factor is the IAQ expressed as CO2 concentration and the appropriate level of ventilation. The required ventilation is based on comfort and health criteria, where humidity and thermal comfort gain importance.
In design of buildings, one requires to take into consideration two flow rates (l/s, pers):
• Ventilation for pollution caused by occupants, qA
• Ventilation for pollution caused by the building and systems, qB
23
Table 6: Basic required ventilation rates for diluting emissions from people for different categories
[25]
The ventilation rate for the building emissions, qB, can be seen in Table 7. Table 7: Basic required ventilation rates for building emissions [25]
Total Ventilation rate needed for a room is calculated according to:
𝑞𝑡𝑜𝑡 = 𝑛 · 𝑞𝐴+ 𝐴 · 𝑞𝐵 (18) 𝑞𝑡𝑜𝑡 = 𝑡𝑜𝑡𝑎𝑙𝑣𝑒𝑛𝑡𝑖𝑙𝑎𝑡𝑖𝑜𝑛𝑟𝑎𝑡𝑒𝑜𝑓𝑡ℎ𝑒𝑟𝑜𝑜𝑚, 𝑙/𝑠
𝑛 = 𝑑𝑒𝑠𝑖𝑔𝑛𝑣𝑎𝑙𝑢𝑒𝑓𝑜𝑟𝑡ℎ𝑒𝑛𝑢𝑚𝑏𝑒𝑟𝑜𝑓𝑡ℎ𝑒𝑝𝑒𝑟𝑠𝑜𝑛𝑠𝑖𝑛𝑡ℎ𝑒𝑟𝑜𝑜𝑚
𝑞𝐴 = ventilationrateforoccupancyperperson,
𝑙 𝑠. pers
𝐴 = 𝑟𝑜𝑜𝑚𝑓𝑙𝑜𝑜𝑟𝑎𝑟𝑒𝑎, 𝑚2
𝑞𝐵 = 𝑣𝑒𝑛𝑡𝑖𝑙𝑎𝑡𝑖𝑜𝑛𝑟𝑎𝑡𝑒𝑓𝑜𝑟𝑒𝑚𝑖𝑠𝑠𝑖𝑜𝑛𝑠𝑓𝑟𝑜𝑚𝑏𝑢𝑖𝑙𝑑𝑖𝑛𝑔,𝑙
𝑠. 𝑚
2
CBE Thermal Comfort Tool
24
complies with both EN 15251 and ASHRAE adaptive comfort models. For the EN 15251 with this tool one can select one of the methods mentioned; for PMV Method, one just needs to know the operative temperature, the local air speed, humidity, metabolic rate and clothing level (Figure 13), in the other hand, for the EN 15251 adaptive comfort model, one will need to know the operative temperature, the outdoor running mean temperature and the air speed (Figure 14). For the ASHRAE adaptive comfort model one will need to know the operative temperature and the prevailing mean outdoor temperature (Figure 15).
25
Figure 14: CBE Thermal Comfort Tool – EN 15251 adaptive comfort method [38]
26
Ways to avoid overheating in a building
Mediterranean regions can lead to uncomfortable conditions, especially during spring and summer time, if suitable measures are not taken to improve comfort. This condition is known “as ‘overheating’, i.e. the indoor environment would become hotter than is desirable, comfortable or sometimes even tolerable” [39].
Generally, occupants want to satisfy their thermal comfort in the building establishing the optimum conditions without using any mechanical device or active energy systems. Discomfort can be understood in two ways:
• Discomfort due to high thermal conditions – Overheating.
• Discomfort due to air freshness – Ventilation systems.
Reducing the occupants’ discomfort can be done by designing or retrofitting energy efficient buildings.
The main sources of heat come from internal gains but more importantly from solar gains through the building’s fabric envelope and glazing, which increases the indoor temperature. Nevertheless, dwelling characteristics are also important. Location, orientation, ventilation, design and construction are five different factors considered when analysing thermal comfort, placing the sensors and deciding what solutions can be made to reduce discomfort or better to attain comfort.
Preventive measures to existing buildings (Figures 16, 17) rather than the design of new ones [40] are:
• Thermal insulation to the walls and loft.
• Shading, reflection and protection.
• Ventilation
o Mechanical systems: fans, air conditioning, etc.
27
Figure 16: Sources of heat gain [40]
28 Assessing overheating
“In order to assess whether an existing building is overheating or uncomfortable, the upper limit of the indoor comfort temperature needs to be known for that day” [39]. It is recognised that noticeable variations of outdoor temperatures can occur in periods of times shorter than a month. The adaptive method suggests that comfort depends on very recent thermal experience, i.e. comfort temperature depends on the daily running mean outdoor temperature (weighted average outdoor temperature over the past few days) in relation to today’s running mean outdoor temperature. According to this, a sudden warm spell is more uncomfortable when there is not a steady build-up of warmer condition. When the running mean outdoor temperature has been low for several days and a sudden warm spell occurs, the odds of feeling uncomfortable are higher (Figure 18) than when the running mean outdoor temperature has been high (Figure 19).
29
Figure 19: Hot spell in July [39]
Therefore, we can plot, for an existing building, the indoor comfort temperature versus the running mean outdoor temperature with the upper limit of comfort temperature band, as we can see in Figure 14.
When the indoor comfort temperature of the day exceeds the upper limit of comfort temperature band, we could say that the existing building is overheated; hence the temperatures are ‘too hot’ for most people, i.e. uncomfortable.
2.4
Housing authority buildings retrofit measures and case
studies
Similar local study
30
stood out from the others; the solar water heating resulted to have the best NPV (42,920 €) and a payback period of 4 years; the second best NPV rated (33,593 €) was the roof insulation with a payback period of 2 years and the third best NPV rated (19,637 €) was the double glazing with a payback period of 3 years. It is important to mention that a photovoltaic system (PV) had the fourth best NPV but the payback (PB) period is 20 years in 2010. Naturally, for this last measure, the prices of solar photovoltaics have dropped significantly, and this implies that installing solar photovoltaics could have a very attractive rate of return in 2019/2020, when compared to 10 years ago. There were also different measures with a negative NPV after 20 years, such as louvred windows, due to the high cost of the louvred window itself.
In this study, the energy saving of the new building block was estimated, given that no energy consumption data existed. Nevertheless, given that the electricity tariffs today are much cheaper than those in 2010 (by a factor of 1.5), it is imperative that the payback periods for all energy efficiency measures could be different from those in 2010.
Housing retrofit studies in Mediterranean climate
Lizana et al. [42] performed a multi-criteria assessment to derive on an energy Effectiveness Index (EI) for each measure or package of measures that considers the environmental, economic and social variables for all the stakeholders, which include the user, the public promotor and the private promotor. Therefore, this assessment considers more criteria for decision making than the EPBD cost-optimal method, which is only concerned with primary energy savings and life-cycle costings. The different measures were applied on a southern Spanish building from the 1950s. It was found that heat pumps have the potential of reducing up to 45% of the building’s CO2 emissions with a payback period of 6 years. Most passive retrofit measures, including shading elements and installation of high efficiency windows, were found to have a resulting high payback period of 15 years or more .The paper also provides a detailed literature review of the different assessment measures adopted by other studies, to identify the effectiveness of the other energy efficiency retrofit measures.
31
improving insulation on external framework and double glazing, solar radiation and solar control using sliding, folding and fixed slat systems, movable shading devices and thermal envelope insulation with ceramic or metal finish. Not only energy consumption and savings were analysed, but thermal comfort was also taken into account using the adaptive models defined by Auliciems and Szokolay [46]. Thermal comfort was improved by reducing the gap between the indoor temperature and the comfort temperature band, mainly through the improvement in U-values of each building envelope element.
Santamaría et al. [47], performed an energy and economic assessment of dwellings in Mediterranean climates also using Design Builder. The different retrofit measures studied included a façade restored by inner cladding, internal roof and ground insulation, double-glazed windows and insulated aluminium frames and an efficient use of terraces as solar collectors. As in Yousif et al. [41], NPV is also analysed for each measure. Finally, the best comparative results were found to be an insulation system on the external envelope with a payback period of 19 years and an insulation system for the internal side of the building with a payback period of 15 years. These settings get the highest energy and economic savings and when giving a more detailed analysis, the inner insulation is more profitable than those on the external side of the envelope due to the lower cost that this entails. This study also highlights that installation of solar protection in that specific building is not profitable due to the lower percentage of façades with south and west components.
32
Desogus et al. [49], studied the feasibility of heavy thermal upgrades on different buildings in the Mediterranean climate, proving that different energy efficiency retrofit measures are not completely cost-effective as far as payback time is concerned, unless national subsidy policies are implemented to improve the economic return on the investment. For this, Desogus et al. propounded two different scenarios and assessed the different NPV obtained with and without national subsidy policies.
Blázquez et al. [50], focused their study on how important calibration is on simulations of building energy models, to allow a better approach to the current environmental conditions and to predict and optimise the different energy retrofit measures to implement. In order to implement the information recorded in situ, software such as DesignBuilder allows the energy model to be supplemented with a complete description of the internal loads and user’s profile. For this, reducing the number of uncertain parameters improves the precision of the calibration. More information is developed in Section 2.6.
More local studies
Manz et al. [35], performed an energy simulation with the computer program WUFI®Plus. The study analysed the thermal comfort of different passive energy retrofit measures in the Maltese archipelago following the adaptive thermal comfort model from the European standard EN 15251. The U-value of different building elements was considered. The study concluded that in an energy efficient well-designed building, that is equipped with double glazing, decent insulation, different shading devices and natural night ventilation, natural night ventilation in summer could be the most effective strategy, although it has its limitations such as the low temperature difference between outdoor temperatures and indoor temperature, as well as the low speed of wind in summer and the level of humidity, which depends on the wind direction. For the case of low wind speed, the paper proposes to assist natural ventilation by adding mechanical ventilation
33
of CO2 emissions with a payback period of approximately 9 years. Most of the CO2 savings were achieved from the main energy consumer, Domestic Hot Water. Therefore, using renewable energies for producing hot water should be considered such as solar heating, heat pumps or ground source heat pumps. The study also noted that using liquified petroleum gas for cooking instead of electricity can already result in a significant reduction in CO2 emissions, despite no reduction in site energy demand.
Another study from Gatt and Yousif [52] on a primary school building in Malta was modelled in DesignBuilder in order to meet the Minimum Energy Performance Requirements (MEPRS) defined by the EPBD, using the Net Present Value point of view. Achieving comfort using the EN 15251 adaptive thermal comfort was also considered in their conclusions. Different retrofit technologies were carried out; convective heaters were replaced with infra-red radiative panel heaters, photovoltaic solar modules were installed, the swimming pool’s energy was reduced with an automated pool cover and air to water heat pumps coupled with a solar thermal heating system, while electrical storage water heaters were replaced by instant water heaters in the bathrooms. Other measures such as wall insulation and light dimming using photocells were installed although they had lower economic impact, as reflected in their NPV results but these were applied to compare their actual performance with the Energy Plus simulation results.
2.5
Housing authority and ERDF priority axis 4
34
public sector are encouraged to increase the share of renewable energy sources, energy saving, energy efficiency systems and buildings thanks to the measures seen in priority axis 4 to contribute towards EU 2020 and national targets. Under the Investment Priority, Government will aid with retrofitting measures for renewable energy and energy efficient systems for retrofitting to minimize energy demand, and hence carbon emissions.
2.6
Energy simulation
Energy modelling has become an important tool for building design. Different energy calculation methods can range from simple benchmarking models to dynamic models as shown in Figure 21.
Benchmarking methods use the building area and tabulated data to carry out a basic analysis. Degree-day methods assume heat load to be linearly related to external air temperature. The bin method uses frequency distribution for different discrete temperature classes. Quasi-steady state determines useful heat gains for each period of calculation. Lumped parameter models simplify a room to a small network of resistances and capacitances, to evaluate the different temperature nodes of the room. The last method, dynamic thermal simulation is an hourly/sub-hourly time step method applied via commercially available software tools. It is the most complex method due to the number of influencing variables in the simulation such as the heating and cooling loads, internal gains and heat transmissions, the structure and occupancy of the building.
35
CIBSE Guide A [56] and CIBSE Guide L [57] recommends using dynamic thermal modelling to predict energy demand to ensure suitable design strategies for the most effective solution to satisfy differing needs. Such needs include complying with national and regional standards, minimizing greenhouse gas emissions and minimizing cost in use. Dynamic modelling is however more time consuming and computationally expensive than simpler modelling tools.
Despite their benefits in sustainable building design, energy modelling tools have their limitations; all models are always a simplified view of the reality, occupants never operate as expected, weather conditions are assumed when there is no approach or data collected, calculation software packages use different algorithms providing different results [58]. It is therefore important and useful to subdivide models depending on the focus, namely, determine zone energy demands, determine fuel demand and determine carbon emissions as seen in Figure 20.
Figure 20: Relationship between different energy models [58]
36
Figure 21: Building energy model methodologies [58]
In order to gain confidence of the suitability in the analysis method proposed when undertaking an energy retrofit project, the building energy model under study should be calibrated with actual measured energy consumption data. Calibration involves observation of changes in simulation output when simulation input is modified, in order to identify the set of inputs leading to simulation outputs that match measured building performance. Calibrating a model can be a complex and time-consuming endeavor, because of its uncertain nature. In fact, the approach in identifying the discrepancy between the results of model and the actual data are not always possible and database used from the software can sometimes be farfetched or poorly implemented. According to the ASHRAE Handbook [59], the quality of a calibration is often evaluated in terms of statistical indicators, the normalized mean bias error (NMBE) and the coefficient of variance of the root mean square error (CV(RMSE)).
𝑁𝑀𝐵𝐸 = ∑(𝑉𝑎𝑐𝑡𝑢𝑎𝑙−𝑉𝑚𝑜𝑑𝑒𝑙𝑒𝑑)
(𝑁−1)·𝑀𝑒𝑎𝑛(𝑉𝑎𝑐𝑡𝑢𝑎𝑙)· 100% (19)
𝐶𝑉(𝑅𝑀𝑆𝐸) =
√∑(𝑉𝑎𝑐𝑡𝑢𝑎𝑙−𝑉𝑚𝑜𝑑𝑒𝑙𝑒𝑑)2
𝑁−1
𝑀𝑒𝑎𝑛(𝑉𝑎𝑐𝑡𝑢𝑎𝑙) · 100% (20)
𝑉𝑎𝑐𝑡𝑢𝑎𝑙 = 𝑝𝑎𝑟𝑎𝑚𝑒𝑡𝑒𝑟′𝑠𝑚𝑒𝑎𝑠𝑢𝑟𝑒𝑑𝑜𝑟𝑚𝑒𝑡𝑒𝑟𝑒𝑑𝑣𝑎𝑙𝑢𝑒𝑓𝑜𝑟𝑒𝑎𝑐ℎ𝑡𝑖𝑚𝑒𝑠𝑡𝑒𝑝
37
The model can be considered calibrated if NMBE < 10% and CV(RMSE) < 30% for hourly data and if NMBE < 5% and CV(RMSE) < 15% when monthly data are used.
2.7
Gaps in literature
From the literature review, studies on energy retrofit projects for the housing sector have never been performed using state of the art dynamic simulation tools for the Maltese climate. While one study [41] performed research on different measures that can be implemented in new rather than retrofitted housing stock buildings, the study lacks the use of simulation tools for accurately estimating energy savings from the proposed energy efficiency measures. The study also did not delve into internal thermal comfort improvements, once the different measures were applied. Most studies for overseas Mediterranean buildings also focus on the sustainable design of new buildings, instead of energy performance and thermal comfort improvement in existing housing buildings. Furthermore, the previous study is more than 10 years old and the financial estimates do not reflect the current energy prices and capital cost of the different retrofit measures.
38
Methodology
3.1
Description and choice of building under study
Why the building was chosenThe social housing building is located in the locality of Żabbar, Malta; more specifically, at Fewdu street (Figure 22). The building consists of four blocks of houses (A, B, C, D), with a total of five floors for each block and two apartments on each floor, which makes up a total of 40 dwellings (10 dwellings per block). Different reasons this building was chosen for analysis is because of the following:
• This is a typical housing stock block built in the 1990s prior to
establishment of energy performance guidelines or regulations. There are many such housing blocks that were built during that period. Thus, this building can serve as pilot project with respect to energy retrofitting, which can be replicated for the other buildings.
• The building is symmetrically constructed (Figure 23), in all cardinal
directions within an angle of ±65°; this enables a full study of each dwelling depending on which direction it is facing.
• Due to favourable configuration, one can compare the impact of
energy performance and comfort for each combination of orientation and floor level (ground floor, middle floor and top floor), using occupants’ feedback from questionnaires, operational energy performance data, on-site measurements and simulated data. On site measurements for 15 dwellings in total were also carried out1 to gather relative humidity and dry bulb temperature every 10 minutes.
1 For the following dwelling, the on-site temperature and relative humidity was recorded on a sub-hourly
39
Figure 22: Żabbar location and 3D case study building
40 Building fabric (U-Values)
The building has the following envelope properties (table 8). The U-values were calculated using the standard methodology of ISO 6946:2017 [60]
Table 8: Building envelope properties and materials
Original building envelope U-Value (W/m2K) External Wall (façade), made up of double limestone block
with an air gap 1.58
External Wall (interior courtyard), made up of single
limestone block 2.8
Interior Walls, made up of single limestone 2.1 Glazing, single clear glazing with aluminium frame (6mm) 5.78
Roof (uninsulated) 2.0
Floor (uninsulated) 1.57
3.2
Data Collection
Questionnaires41 Electricity and water bills
The data collected from the electricity and water bills were inputted on a spreadsheet for analysis. The collection of raw data is shown in Appendix 1.
Installation of Sensors
A total of 15 HOBO MX Temp/RH Data Loggers (MX1101) [61] (Figure 24),were used to gather relative humidity and temperature every 10 minutes. These sensors were primarily located in the bedrooms of the dwellings under study.
Figure 24: HOBO MX Temp/RH Data Logger (MX1101)
Due to the limitation of time, only one month of data was used to calibrate the software DesignBuilder simulation software based on hourly temperature readings (see Section 2.6). However, this was enough to attain an acceptable level of confidence in the modelling results.
Statistical analysis and identification of the baseline energy consumption
The annual energy consumption can be divided into three main sources of significant energy consumption: heating and cooling energy consumption, domestic hot water (DHW) energy consumption and others (lighting, plug loads, appliances).
42
and cooling energy consumption, questionnaire data is used to quantify the number of dwellings using air-conditioners and therefore estimate their energy consumption. The “others” (lighting, plug loads and appliance) energy consumption were automatically derived by subtracting the space heating, cooling and DHW energy consumption from the total consumption.
The annual DHW energy consumption (EC) was calculated following the equation:
𝐷𝐻𝑊𝐸𝐶 =
𝑁º𝑂𝑐𝑐𝑢𝑝𝑎𝑛𝑡𝑠·𝐷𝐻𝑊𝑐𝑜𝑛𝑠𝑢𝑚𝑒𝑑𝑝𝑒𝑟𝑜𝑐𝑐𝑢𝑝𝑎𝑛𝑡·(𝑇𝑓−𝑇𝑖)·𝑁º𝑑𝑎𝑦𝑠·∁·𝛼𝐷𝐻𝑊𝑠𝑦𝑠𝑡𝑒𝑚𝑒𝑓𝑓𝑖𝑐𝑖𝑒𝑛𝑐𝑦 (21)
𝑇𝑓 = 𝐴𝑣𝑒𝑟𝑎𝑔𝑒𝑇𝑒𝑚𝑝𝑒𝑟𝑎𝑡𝑢𝑟𝑒𝑎𝑓𝑡𝑒𝑟ℎ𝑒𝑎𝑡𝑖𝑛𝑔 ≈ 60°𝐶
𝑇𝑖 = 𝐴𝑣𝑒𝑟𝑎𝑔𝑒𝑇𝑒𝑚𝑝𝑒𝑟𝑎𝑡𝑢𝑟𝑒𝑏𝑒𝑓𝑜𝑟𝑒ℎ𝑒𝑎𝑡𝑖𝑛𝑔 ≈ 20°𝐶
∁= 𝑊𝑎𝑡𝑒𝑟ℎ𝑒𝑎𝑡𝐶𝑎𝑝𝑎𝑐𝑖𝑡𝑦(𝐽𝑜𝑢𝑙𝑒𝑠/𝑘𝑔)
𝛼 = 𝑐𝑜𝑛𝑣𝑒𝑟𝑠𝑖𝑜𝑛𝑓𝑎𝑐𝑡𝑜𝑟𝑓𝑟𝑜𝑚𝐽𝑜𝑢𝑙𝑒𝑠𝑡𝑜𝑘𝑊ℎ = 2,77778 · 10−7
3.3
Building Energy modelling of base (actual building)
scenario
Use of software and why it was chosen
43
thermophysical properties of materials, occupancy, subjective data and the performance of systems influenced by the internal and external environmental conditions.
Use of questionnaires to understand typical equipment inside building
Questionnaires were used to understand which variables tend to be similar or different between dwellings. Twelve variables were determined to analyse energy performance in terms of equipment and building operation. Questionnaires were also used to see how comfortable the occupants were during summer and winter periods.
Questionnaires led to the conclusion that approximately half of the dwellings have an air conditioner (A/C) that could only improve comfort in the room where it is located.
Questionnaire analysis
In order to assess the questionnaires and see what variables are the most significant, a Multiple Linear Regression (MLR) with the annual consumption as dependent variable was analysed in the program STATGRAPHICS Centurion 18 (Version 18.1.06, 64-bits). The Homogeneity of Variance Hypothesis, the Normality Hypothesis and the Independence Hypothesis were tested.
Floor choice level for analysis
The comfort feedback from the questionnaires was analysed to determine which floor (top, middle, or ground/bottom) has the highest discomfort among the occupants and which requires to be prioritised for this study. Top floor resulted to have a 100% of discomfort among the occupants. Thus, this floor was given priority and analysed for this study.
Hourly calibration of simulated temperatures with actual logged data
44
data was available for the study. According to Section 2.6, to gain confidence of the suitability in the analysis method proposed when undertaking an energy retrofit project, the building energy model should be calibrated with actual measured data. The measured temperature data was compared to hourly simulated data. Calibration was validated on an hourly resolution using NMBE and CV(RMSE) criteria explained in the ASHRAE Handbook [59]. According to ASHRAE when undertaking hourly calibration if the resulting NMBE < 10% and CV(RMSE) < 30%, the model can be considered calibrated. For calibration, the actual outdoor weather data for the period analyzed was considered.
Comfort analysis and comfort analysis approaches
The comfort assessment is divided in two general scenarios, according to the seasons simulated. The assessment was carried out for the most extreme typical week of winter and summer, called design week2. These weeks were automatically determined by EnergyPlus for a typical meteorological year for Malta. It is assumed, that if comfort is satisfied during these weeks, the building will also be comfortable throughout the whole year.
As reviewed in the literature, the adaptive comfort versus the PMV/PPD comfort model was used for analysis, as the aim of this study was achieving thermal comfort using no mechanical means for heating, cooling or ventilation.
In order to assess thermal comfort with the considered adaptive model standards (EN 15251, ASHRAE and M. Vellei et al. [36] model) simulations were carried out using no mechanical means for heating, cooling or ventilation both for the summer and winter design weeks.
In the Summer period, occupants tend to open windows in order to improve their comfort. When running the building simulation for Summer design week, two approaches were considered, to identify the sensitivity of opening windows in summer. For the first approach, the “Summer design week with Windows Closed” considered that all windows remain closed independent of the temperatures outside and inside the dwelling. In the second approach, the “Summer design week with Windows Open”,
2 Simulated summer design week: 13/07/2002 - 20/07/2002.
45
windows were opened when the temperature outside is lower than the temperature inside the dwelling´s room and the operation schedule of the room allows it. For winter, only the approach with windows closed was considered given that occupants ensure that heat losses to the outside air is minimised.
Comfort assessment of the base (as is) building
The building has been modelled in DesignBuilder (Figure 25).
Figure 25: Building model on DesignBuilder
46
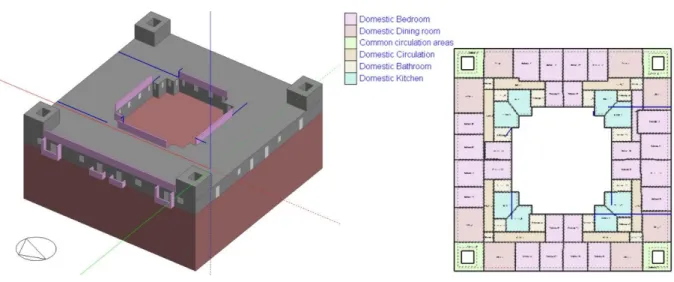
Figure 26: Simplified top floor model on DesignBuilder and top floor plan showing dwellings’ configuration
All dwellings have 3 bedrooms, 2 bathrooms, 1 dining room, 1 kitchen and 1 indoor corridor as seen in Figure 27.
Figure 27: Dwellings and zones for each orientation
For the simulations carried out, different aspects have been considered: the occupancy schedule per room is based on the default setting by DesignBuilder that utilises the UK national calculation methodology (NCM).
47
higher than the outside and when the room is occupied. The building does not make use of mechanical ventilation for air changes.
The dwelling floor is considered adiabatic, to improve simulation computation time. This assumption was validated given that the floor is internal and therefore the heat gains and heat losses from the apartments below operating with the same schedule can be neglected.
When collecting the simulated data, all rooms were analysed except for the indoor corridor, as displayed in Figure 27. The rooms analysed are Bedroom 1A, Bedroom 1B, Bedroom 1C, Bathroom 1A, Bathroom 1B, Kitchen and Dining.
Hourly data is collected for each design week. The data collected is the zone operative temperature, the zone air relative humidity, the zone thermal comfort ASHRAE 55 adaptive model, running average outdoor air temperature and the zone thermal comfort EN 15251 adaptive model temperature. This data was plotted to analyse comfort for both the EN 15251 and ASHRAE adaptive comfort models. All EN 15251 categories were considered while ASHRAE 80% acceptability model was used.
Another model, M. Vellei et al. [36], that also considers the impact of relative humidity on ASHRAE adaptive comfort was also used, given the high relative humidity levels found in Malta.
Once the comfort analysis was done, potential retrofit measures were considered to improve comfort.
3.4
Identification of retrofit measures
Identification of potential retrofit measures
![Table 3: Recommended categories for design of mechanical heated and cooled buildings [25]](https://thumb-us.123doks.com/thumbv2/123dok_es/6251104.189249/40.892.316.632.677.998/table-recommended-categories-design-mechanical-heated-cooled-buildings.webp)