Introduction
Agricultural intensification has led to a drastic transformation of the landscape, soil depletion and the acceleration of irreversible erosion processes (Sans, 2007).
Agriculture can alter natural systems basically in 2 ways:
a) through direct effects on biological diversity in general (e.g., Fahrig, 2003; Firbank et al., 2008) and amphibian diversity in particular (e.g., Hecnar and M’Closkey, 1998; Peltzer et al., 2006), such as habitat loss and creation of isolated fragments by conversion of natural habitats to arable land (e.g., Joly et al., 2001; Grau et al., 2005), and
b) through indirect effects, particularily the deleterious
Reproductive activity of anurans in a dominant agricultural landscape from
central-eastern Argentina
Actividad reproductiva de anuros en un paisaje dominantemente agrícola del centro-este de
Argentina
Laura C. Sanchez1 , Paola M. Peltzer1, Rafael C. Lajmanovich1, Adriana S. Manzano2, Celina M. Junges1
and Andrés M. Attademo1
1Consejo Nacional de Investigaciones Científicas y Técnicas y Facultad de Bioquímica y Ciencias Biológicas, Universidad Nacional del Litoral,
Paraje el Pozo s/n (3000), Santa Fe, Argentina.
2Universidad Autónoma de Entre Ríos y Centro de Investigación Científica y Transferencia de Tecnología a la Producción. Materi y España s/n
(3105), Diamante, Entre Ríos, Argentina. [email protected]
Abstract. Agriculture can modify natural systems through habitat loss and fragmentation, as well as through the effect of agrochemicals on biological traits such as reproduction. We studied anuran diversity and reproduction of assemblages from 3 sites with different degrees of agricultural activities (an agroecosystem, a transitional area, and a natural forest) located in Entre Ríos province (Argentina). We conducted several field surveys during 2 soybean-cropping periods from November 2006 to April 2008. A total of 23 anuran species were identified. Richness, evenness and diversity differed among sites. No range-abundance models were statistically adequate to describe the distribution of abundances within the agroecosystem, whereas the anuran species from the other 2 sites fitted the normal logarithmic model. The location and substrates used for nuptial calling in ponds, as well as the reproductive periods of anuran species varied among sites. These findings might respond to a combination of factors, such as anuran composition, species abundances, availability of reproductive microhabitats, and variation of microclimatic characteristics among sites, the agroecosystem being the most different anuran reproductive community. Finally, our results suggest that agricultural land use have adverse effects on the reproduction of anurans in central-eastern Argentina.
Key words: breeding activity, amphibians, agroecosystem, Entre Ríos, Argentina.
Resumen. La agricultura puede modificar los sistemas naturales mediante la fragmentación y pérdida de hábitat, como también debido al efecto de los agroquímicos sobre rasgos biológicos tales como la reproducción. Se estudió la diversidad y la reproducción en 3 comunidades de anuros provenientes de sitios con distintos grados de actividad agrícola (un agroecosistema, una área de transición y un bosque natural) de la provincia de Entre Ríos (Argentina). Se realizaron inspecciones a campo durante 2 periodos entre la siembra y la cosecha de soja, desde noviembre de 2006 hasta abril de 2008. Se identificaron 23 especies de anuros. La riqueza, la equitatividad y la diversidad difirieron entre sitios. La distribución de abundancias dentro del agroecosistema no se ajustó a ningún modelo rango-abundancia. La ubicación y los sustratos utilizados para vocalizar por las especies como también sus periodos reproductivos variaron entre sitios. Estos resultados podrían responder a una combinación de factores tales como composición de anuros, abundancia de las especies, disponibilidad de microhabitats reproductivos y variaciones microclimáticas entre sitios, siendo el agroecosistema la comunidad reproductiva más diferente. Finalmente, se sugiere que el uso de la tierra para la agricultura tendría efectos adversos sobre la reproducción de los anuros en el centro-este de Argentina.
Palabras clave: periodos reproductivos, anfibios, agroecosistema, Entre Ríos, Argentina.
impact of the use of agrochemicals on wildlife (e.g., Smith et al., 2000; Khan and Law, 2005). We still lack a solid understanding of the consequences of the many forms of structural habitat change for amphibians, as well as the effect of more indirect factors (Gardner et al., 2007).
Agricultural activities have been associated with declines of amphibian populations (Sparling et al., 2001; Davidson and Knapp, 2007). Several species breed within or around agricultural areas that are usually exposed to pesticides, and consequently, their larvae may come in contact with these contaminants at some point in time during their development (Peltzer et al., 2003, 2006). Accordingly, adults exposed to xenobiotics with endocrine disruptive activity have shown evidence of reproductive dysfunction, such as testicular dysgenesis in males (sex reversal, skewed sex ratios, hermaphrodites, intersex gonads, disrupted spermatogenesis, altered testicular morphology and gonadal development) (e.g., Edwards et al., 2006; Hayes et al., 2010), and delayed oviposition, increased egg size and decreased egg fertility in females (Pickford and Morris, 2003).
Despite the need to know if amphibian breeding biology is affected in areas exposed to pesticides, little is known about breeding activity in agricultural landscapes (Knutson et al., 2004). In central-eastern Argentina, glyphosate-tolerant-soybean (Glycine max L.) is the dominant crop, with pesticides generally applied in spring and summer, during the amphibian breeding period (Peltzer and Lajmanovich, 2007). Field evidence indicates that runoff and pesticide drift alter temporary and permanent ponds adjacent to agroecosystems, which are essential sites for anuran reproduction (Peltzer et al., 2008).
The aim of this study was to provide baseline data on the diversity and reproduction of anuran assemblages in sites with different degrees of agricultural activity in Argentina: an agroecosystem, a transitional area without agriculture but adjacent to monoculture zones, and a natural forest site.
Materials and Methods
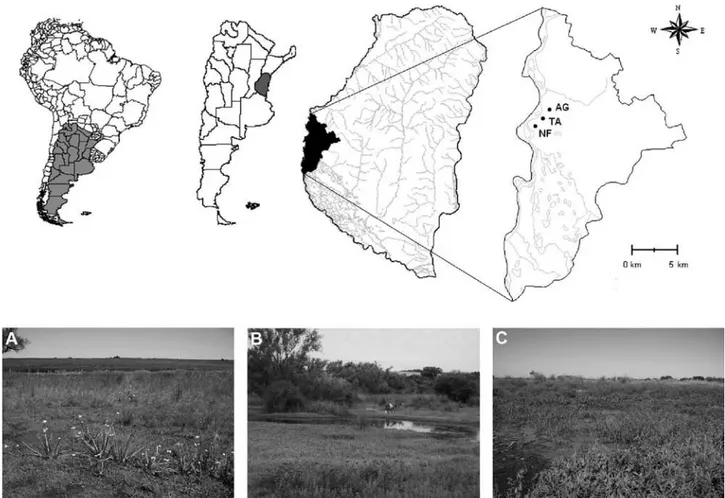
Study area. The study area selected is one of the most important agricultural systems in Argentina. It is located in the central-eastern part of the country, to the south-west of the Entre Ríos province. Three different sampling sites were chosen: an agroecosystem, a transitional area, and a natural forest (Fig. 1). The agroecosystem site (AG) is a field cultivated with soybean (Glycine max (L.) Merril) situated in Diamante department (23 ha; 32º06’12.3” S, 60º37’17.5” W). The soybean field is under direct seeding (soybean in spring-summer, and wheat in autumn-winter), with at least 5 years of activity. Soybean is sown in
November/December and harvested in March/April. A natural water course crossing the soybean field forms a small wetland (0.5 ha).
The transitional area (TA; 32º07’17.6” S, 60º38’02.2” W) is located between the agroecosystem and the natural forest site; because of its slope, this site is directly exposed to the pluvial runoff from the soybean fields. The transitional area selected was located in the continental zone of the Pre-Delta National Park (PDNP). The PDNP is a wetland reserve (2 458 ha), belonging to the Paraná River floodplain, close to the mouth of Paraná Delta, which includes a continental zone as well as several islands (Aceñolaza et al., 2004). This reserve is 2 km away from the agroecosystem.
The natural forest site selected (NF; 32º07’30.7” S, 60º38’11.6” W), the most pristine area within the PDNP, was located in the island region of PDNP. This sector is preserved from human impact and no exposure to direct runoff of agrochemicals is expected. The lower zones in NF site showed a typical vegetation of flooding areas (Aceñolaza et al., 2004).
Field survey periods. We conducted field surveys during the anuran breeding season in the study region (Peltzer and Lajmanovich, 2007). Surveys comprised 2 sampling periods: a) first period: from November 2006 to May 2007, and b) second period: from December 2007 to April 2008. These 2 periods also coincided with the soybean sowing and harvest periods (Quintana and López Anido, 2010). The methodology used for each study objective is explained below.
Breeding activity of anuran species. Three aquatic habitats, 1 per site, were studied. The AG water body was a permanent pond formed by a natural water course that crosses the field. The TA water body was a permanent pond, and the NF water body was a semi permanent pond (Table 1). In all cases, the vegetation of flooded areas was the typical vegetation of aquatic ecosystems (Aceñolaza et al., 2004).
To record calling activities, 4 searches were made per month across all ponds between twilight (19:00 h) and midnight (24:00 h), spending at least 1.5 hour at each site. A scoring criterion (calling index) was established for the types of male calling per species: 1= individual calls are not overlapping; 2= calls are overlapping, but individuals are still distinguishable; 3= numerous individuals can be heard, chorus is constant and overlapping (U.S. EPA, 2002). The calling activity of those species that did not vocalize at the selected sites was monitored in a qualitative way, according
to Bertoluci and Rodrigues (2002). For each anuran male detected in calling activity, we recorded the following variables: location in the pond (centre, edge, flooded land periphery, land periphery), type of substrate (e.g., grasses, caves, marsh plants, trees, bare soil), and height in the vegetation (measured with a stick in cm). Moreover, to analyze the influence of environmental variables over Figure 1. Location of study sites in Diamante, south-western Entre Ríos province, central-eastern Argentina, southern South America. A), agroecosystem (back) and wetland formed by the natural water course (front). B), pond of the transitional area, with the agroecosystem at the back, on the hill. C), water body in the natural forest site, in the island region, and at the bottom, the ridges with remnant riparian forest. AG, agroecosystem; TA, transitional area; NF, natural forest.
Table 1. Characteristics of the aquatic sites studied (mean ± standard deviation) in agroecosystem (AG), transitional area (TA) and natural forest (NF) sites
Location of
water body Length (m) Width (m) depth (cm)Maximum
AG 153.40 ± 5.77 38.80 ± 4.58 32.20 ± 6.09
TA 80.80 ± 14.66 54.20 ± 10.92 36.80 ± 6.58
calling activity of males, we considered 3 environmental variables: 1) mean monthly river level (obtained from Prefectura Naval Argentina Sede Diamante, 3 km from the studied sites), 2) mean monthly air temperature, and 3)
mean monthly rainfall (both obtained from the automatic meteorological station of CICYTTP-CONICET, Diamante City, 6 km from the study area). During these nocturnal surveys, a visual category was also established (visual index): 1= 1 to 3 individuals can be seen; 2= 4 to 10 individuals can be seen; 3= more than 10 individuals can be seen.
Additionally, to complete the analysis of breeding activity of anuran species, we considered the results of the searches of tadpoles previously described as evidence of reproduction. The number of sample points during the search of tadpoles and the number of record points in the audio-visual nocturnal surveys were determined according to pond length. For this purpose, we developed our own formula:
Number of points= (MTL + ecotone x 2)/ point diameter
where MTL value is maximum total length of the water body; the ecotone considered was 10 m; and the point diameter was 10 m to avoid recording the same individual twice. Transitional zones between terrestrial and aquatic ecosystems (ecotones) are areas through which surface and subsurface hydrology connects water bodies with their adjacent uplands (Zaimes et al., 2010). These typically exhibit characteristics quite different from the adjacent vegetation types (Clary and Medin, 1999). In our study, the ecotone considered was 10 m, according to the width of the terrestrial-aquatic transition occupied by distinctive vegetation.
The tadpoles that could not be identified in the field were collected and reared in the laboratory until metamorphosis. Then, tadpoles were euthanized and fixed according to the guidelines of ASIH et al. (2004) for further identification. The remaining tadpoles were released at the collection site.
Data analysis. Anurans captured in pitfall traps were standardized according to trapping effort (i.e., anurans/ trap), following the criterion of Fitzgerald et al. (1999). Diversity (H) was calculated by Shannon-Weaver diversity index (Shannon and Weaver, 1949), using natural logarithms. Evenness (E) was calculated using Magurran’s equation (Magurran, 1988). Richness (S) was estimated as the number of species that occurred in each site (Moreno, 2001). To compare species richness, diversity and evenness among sites, regardless of the sample size, the rarefaction model proposed by Sanders (1968) and corrected by Hurlbert (1971) and Simberloff (1972) was
used. The samples were rarefied to the smallest sample size. The richness, diversity and evenness values were obtained for 13 abundance classes (50, 100, 150, 200, 250, 300, 350, 400, 450, 500, 550, 600, and 649 individuals). Subsequently, the values were compared among sites with the non-parametric Kruskall-Wallis test (HKW, following
Duré et al., 2008), and multiple comparisons (in pairs), which are based on differences between the means of the ranges, as described in Conover (1999).
To assess anuran abundance, adults, juveniles and tadpoles recorded with the 3 field methods were considered (pitfall traps, nocturnal searches, and searches of tadpoles). For the case of anuran abundance recorded during nocturnal searches, we estimated the calling rank and visual rank by summing the calling and visual indices recorded for each species at each site (following Pope et al., 2000).
Community composition for each site was characterized by means of the rank-abundance models. These models have been used to assess the degree of habitat disturbance and to determine the successional stage (Aguirre Calderón et al., 2008). For each site, we investigated which of the most common models (geometric, logarithmic, normal logarithmic, and broken stick) presented the best fit to the observational data by means of the Chi-square test (Duré et al., 2008) using PAST software (Hammer et al., 2001). A p> 0.05 value was used as a criterion for accepting the null hypothesis, i.e., that the distribution is consistent with the tested model (Magurran, 1988).
To classify the reproductive modes, we used Lavilla classification (2004) for Argentine anurans, and the generalized reproductive modes according to Duellman and Trueb (1986) and Haddad and Prado (2005).
We calculated the microhabitat breadth (Bj) with regard to call substrates according to Levins (1968) and
Heyer (1976), using the following formula: Bj= ΣPij 2,
where Bj is the amplitude of the microhabitat of species j. The smaller values indicate greater niche breadth. Pij is the proportion of the species j that was observed calling in microhabitat i, i.e., the proportion of calling individuals recorded in each microhabitat used by the species with respect to all of the observations (Pij= nij/Nj). Likewise, we considered the location of each species in the pond; type of substrate and height in the vegetation to calculate the frequency distribution of anuran vocalization sites, according to Rossa-Feres and Jim (2001).
the formula: CJ= j /(a + b - j), where j are the reproduction
evidences shared by the 2 species considered, a are the reproduction evidences found in species A, and b are the reproduction evidences in species B. Then, we calculated the associated distance index as 1-CJ. Finally, the distance
matrix was employed to run the PCoA with InfoStat demo/ Profesional (Infostat, 2006) using Euclidean distances.
To test the association among environmental variables and number of species with calling males per month, we performed Spearman correlation (rs), because data were not normal (following Afonso and Eterovick, 2007). A non-parametric Friedman test was used to compare the mean monthly calling activity (average calling indices recorded per month) among sites (AG, AT, AP), for each species. When necessary, we performed a posteriori multiple comparisons with a significance level of 0.05 (Conover, 1999).
Finally, to assess the similarity of reproductive anuran assemblages, a cluster analysis was performed. The original matrix considered all evidences of reproduction across the studied sites (AG, TA and NF). We used the unweighted pair group method (Upgma) based on Jaccard similarity index. The software used was InfoStat demo/Profesional (Infostat, 2006).
Results
Composition and diversity of anuran communities. A total of 23 anuran species belonging to 11 genera of 5 families were found at the study sites. Some species were exclusively recorded in AG (Pseudopaludicola falcipes) or NF (Hypsiboas raniceps). Two species were detected both in AG and TA (Bufo arenarum and Odontophrynus americanus) and other 6 species occurred in both TA and NF (B. schneideri, H. punctatus, Pseudis limellum, Scinax acuminatus, S. berthae, and Trachycephalus typhonius). The remaining 13 species were present in all the sites (Tables 2, 3).
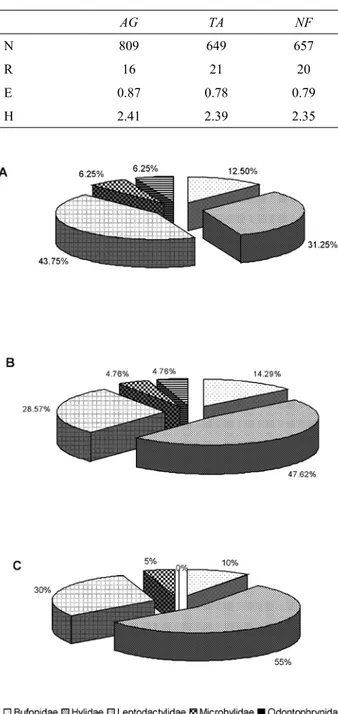
In each of the 3 sites studied, Hylidae and Leptodactylidae were the main families present (Table 3). Hylidae showed the greatest variation in species occurrence among sites, with 5 species recorded in AG (31.25%), 10 in TA (47.62%) and 11 in NF (55.00%). Seven species of the family Leptodactylidae were recorded in AG and 6 in TA and NF, which accounted for 43.75% of those species recorded in AG, 28.57% in TA, and 30% in NF. On the other hand, 2 species of Bufonidae were present in AG (12.50%), 3 in TA (14.29%), and 2 in NF (10%). The families Microhylidae and Odontophrynidae had the lowest representation, each one with a single species. The former family was present in the 3 sites, and the latter, in only AG and TA (Fig. 2).
The number of species was significantly different among sites (Table 2; HKW= 14.70, p= 0.0006). Richness
was significantly lower in AG than in TA and NF sites Table 2. Summary of anurans’ total estimated abundance (N), richness (R), evenness (E) and diversity (H) in agroecosystem (AG), transitional area (TA) and natural forest (NF) sites, south-western Entre Ríos province, Argentina
AG TA NF
N 809 649 657
R 16 21 20
E 0.87 0.78 0.79
H 2.41 2.39 2.35
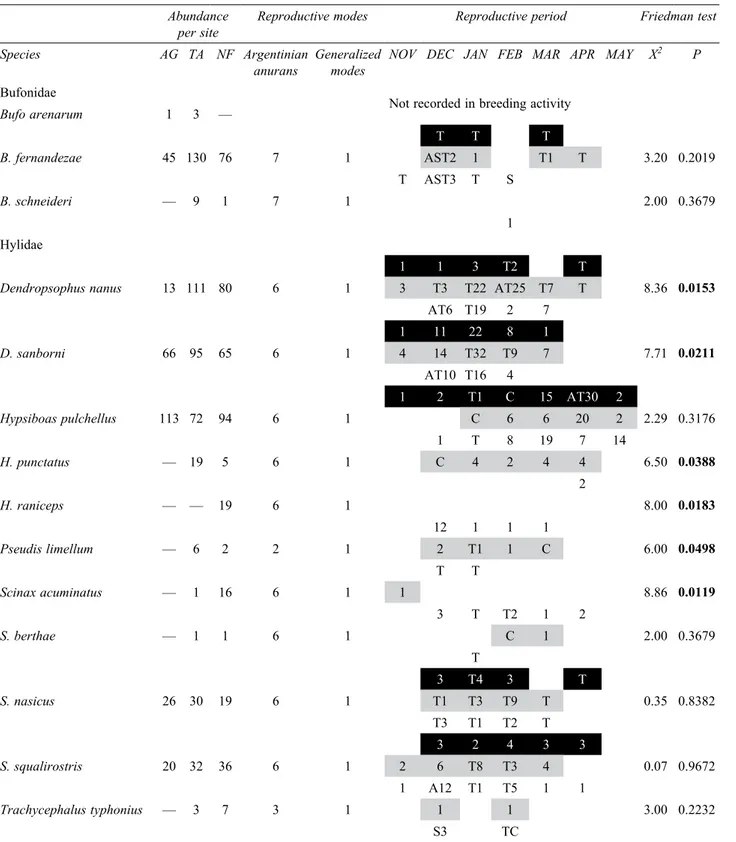
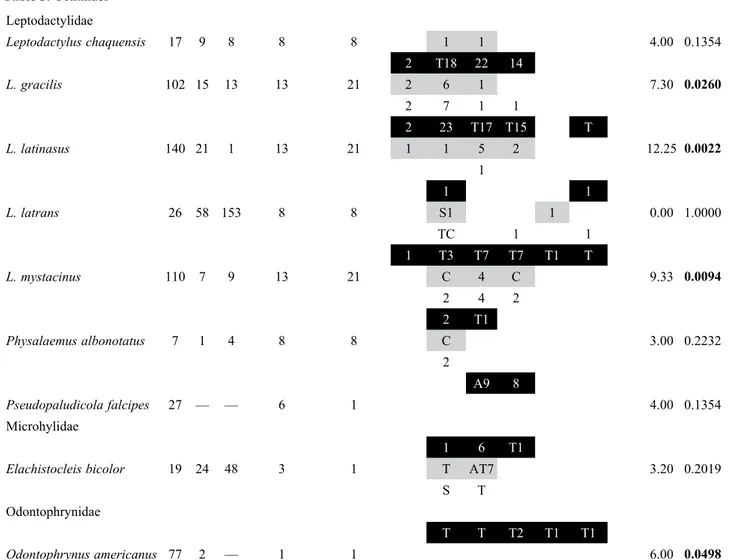
Table 3. Anuran breeding characteristics according to reproductive modes, and spatial and temporal distribution in south-western Entre Ríos province, Argentina. Sites: agroecosystem in black, transitional area in grey, natural forest in white. Numbers are the vocalizations shown by the sum of monthly values of auditory categories. A, amplectant pair; S, spawning; T, tadpoles; C, calling activity not-quantified outside the study sites. Comparison of mean monthly calling activity among sites by means of Friedman test. Letters in bold indicate statistically significant values (p< 0.05)
Abundance
per site Reproductive modes Reproductive period Friedman test Species AG TA NF Argentinian
anurans Generalized modes NOV DEC JAN FEB MAR APR MAY X
2 P
Bufonidae
Not recorded in breeding activity
Bufo arenarum 1 3 —
T T T
B. fernandezae 45 130 76 7 1 AST2 1 T1 T 3.20 0.2019
T AST3 T S
B. schneideri — 9 1 7 1 2.00 0.3679
1 Hylidae
1 1 3 T2 T
Dendropsophus nanus 13 111 80 6 1 3 T3 T22 AT25 T7 T 8.36 0.0153
AT6 T19 2 7
1 11 22 8 1
D. sanborni 66 95 65 6 1 4 14 T32 T9 7 7.71 0.0211
AT10 T16 4
1 2 T1 C 15 AT30 2
Hypsiboas pulchellus 113 72 94 6 1 C 6 6 20 2 2.29 0.3176
1 T 8 19 7 14
H. punctatus — 19 5 6 1 C 4 2 4 4 6.50 0.0388
2
H. raniceps — — 19 6 1 8.00 0.0183
12 1 1 1
Pseudis limellum — 6 2 2 1 2 T1 1 C 6.00 0.0498
T T
Scinax acuminatus — 1 16 6 1 1 8.86 0.0119
3 T T2 1 2
S. berthae — 1 1 6 1 C 1 2.00 0.3679
T
3 T4 3 T
S. nasicus 26 30 19 6 1 T1 T3 T9 T 0.35 0.8382
T3 T1 T2 T
3 2 4 3 3
S. squalirostris 20 32 36 6 1 2 6 T8 T3 4 0.07 0.9672
1 A12 T1 T5 1 1
Trachycephalus typhonius — 3 7 3 1 1 1 3.00 0.2232
(Conover multiple comparisons: p= 0.0002 and p= 0.01 respectively). On the other hand, both evenness and diversity showed significant differences among sites (HKW= 25.35, p= 0.00005; HKW= 16.62, p= 0.0002,
respectively). Evenness in AG was significantly higher than in TA and NF sites (Conover multiple comparisons:
p= 0.00001 and p= 0.00002 respectively), and species diversity was significantly higher in AG than in TA and NF groups (Conover multiple comparisons: p= 0.04 and
p= 0.00005 respectively). Furthermore, diversity in TA was greater than in NF (p= 0.04).
Estimated abundance of anurans was 2 115 individuals (adults, juveniles and tadpoles), with 809 individuals recorded in AG, 649 in TA, and 657 in NF (Table 2). The more abundant species in AG were H. pulchellus,
Leptodactylus gracilis, L. latinasus, L. mystacinus and O. americanus. The dominant species both in TA and NF were B. fernandezae, Dendropsophus nanus, D. sanborni,
H. pulchellus, and L. latrans (Table 3).
No model turned out statistically adequate to describe the distribution of abundances in AG; however, data were closest to normal logarithmic series (X2= 7.391, p= 0.025).
The best fit, both in TA and NF sites, was obtained with the normal logarithmic model (TA: X2= 1.507, p= 0.825;
NF: X2= 1.200, p= 0.753), followed by the geometric
model (TA: X2= 9.691, p= 0.8822; NF: X2= 16.61, p=
0.3429).
Breeding activity of anuran species. Evidence of reproduction by 22 anuran species was found at the 3 study sites. The lowest number of taxa observed with evidence of reproduction was recorded in AG (N= 14). In TA and NF N= 18 and N= 19 species, respectively, with reproductive activity were found (Table 3).
Most species were recorded reproducing in the 3 sites, such as B. fernandezae, D. nanus, D. sanborni, H. pulchellus,
S. nasicus, S. squalirostris, L. gracilis, L. latinasus, L. Leptodactylidae
Leptodactylus chaquensis 17 9 8 8 8 1 1 4.00 0.1354
2 T18 22 14
L. gracilis 102 15 13 13 21 2 6 1 7.30 0.0260
2 7 1 1
2 23 T17 T15 T
L. latinasus 140 21 1 13 21 1 1 5 2 12.25 0.0022
1
1 1
L. latrans 26 58 153 8 8 S1 1 0.00 1.0000
TC 1 1
1 T3 T7 T7 T1 T
L. mystacinus 110 7 9 13 21 C 4 C 9.33 0.0094
2 4 2
2 T1
Physalaemus albonotatus 7 1 4 8 8 C 3.00 0.2232
2
A9 8
Pseudopaludicola falcipes 27 — — 6 1 4.00 0.1354
Microhylidae
1 6 T1
Elachistocleis bicolor 19 24 48 3 1 T AT7 3.20 0.2019
S T
Odontophrynidae
T T T2 T1 T1
Odontophrynus americanus 77 2 — 1 1 6.00 0.0498
latrans, L. mystacinus, Physalaemus albonotatus, and
Elachistocleis bicolor. Scinax acuminatus, S. berthae,
H. punctatus, P. limellum, and T. typhonius were found reproducing both in NF and TA sites. On the other hand, some species were recorded in breeding activity only in 1 site, such as P. falcipes and O. americanus in AG, L. chaquensis in TA, and B. schneideri and H. raniceps in NF (Table 3).
From the 16 reproductive modes (RM) described by Lavilla (2004), 7 were observed in this study (Table 3): RM 2, eggs are individually laid, adhered to submerged vegetation; RM 3, eggs are scatter-deposited in a continuous layer on water surface; RM 6, eggs are deposited in spherical gelatinous clusters attached to submerged plants or objects; RM 7, eggs are deposited in a jelly-like strand at the bottom of the water body; RM 8, eggs are deposited in a floating foam nest; RM 13, eggs are deposited in terrestrial foam nests, in depressions, cracks or structures specially built in the mud, and generally in flooded areas or near water. RM 6 was the most prevalent in all sites (AG= 42.9%, TA= 44.4%, NF= 47.4%). Reproductive modes in which eggs are laid inside foam nests (8 and 13) were ranked second in terms of the proportion of species that used them (AG= 35.7%, TA= 33.3%, NF= 26.3%). RM 1 and RM 2 were the least common in the anuran assemblages analyzed. RM 1 was only observed in AG (7.14%), whereas RM 2 was absent in AG and was represented by 5.6% in TA and 5.3% in NF. On the other hand, of the 29 reproductive modes described by Duellman and Trueb (1986), 3 were recorded in the study sites (RM 1, RM 8, and RM 21), RM 1 being the most abundant in all sites (AG= 64.3%, TA= 66.7%, NF= 73.7%).
The most frequent anuran location in the reproductive ponds was the flooded land periphery in AG (38.86%), and the pond edge in TA (43.35%) and NF (49.22%). Males used several substrates when calling (Table 4). The most frequent substrates were caves (38.50%) and branches of marsh plants over water (32.30%) in AG, and floating plant branches (TA= 15.63%, NF= 44.83%) and marsh plant branches over water (TA= 43.75%, NF= 23.28%) in TA and NF. The most frequent vegetation height used for calling was between 0 and 10 cm in all sites (Table 4).
The lowest values of Bj index (< 0.5) corresponded to species with higher amplitude of microhabitat with respect to substrates used during calling activity. These species were H. pulchellus, S. nasicus, P. albonotatus, and E. bicolor in AG, S. squalirostris and E. bicolor in TA, and
D. nanus, H. pulchellus, S. acuminatus, S. squalirostris, and T. typhonius in NF (Fig. 3).
Considering all evidences of reproduction during the 2 breeding seasons and among the 3 sites, we recorded reproductive activity in each month when surveys were
conducted, and found a minimum of N= 1 species in May and a maximum of N= 20 in February, followed by December and January with N= 19 breeding species in each one. When the reproductive period of species in each site was analyzed, differences were observed (Table 3). Five reproductive periods were observed: 1) species with reproductive activity throughout the sampled period, Table 4. Frequency distribution of anuran vocalization sites from the ponds studied in south-western Entre Ríos province, Argentina. Sites: AG, Agroecosystem; TA, Transitional Area; NF, Natural Forest. Numbers in italics indicate the sample size for each site
Frequency distribution (%)
Calling sites AG TA NF
Location in the pond 229 173 128
Centre of pond 9.61 5.78 19.53
Edge of pond 26.64 43.35 49.22
Flooded land periphery 38.86 24.86 3.91
Land periphery 24.89 26.01 27.34
Type of substrate 226 160 116
Australian tank 0.44 0.00 0.00
Floating in open water 8.85 5.00 5.17
Floating plant branches 0.00 15.62 44.83
Grass on water 9.73 6.25 0.00
Grass on ground 4.87 0.00 0.00
In caves 38.50 13.75 12.93
Marsh plant branches over water 32.30 43.75 23.28 Marsh plant branches over ground 0.44 9.38 11.21
Tree 1.77 5.62 1.72
Bare soil 3.10 0.62 0.86
Vegetation height (cm) 183 124 70
0-10 85.25 66.94 54.29
11-20 1.64 8.87 11.43
21-30 3.28 7.26 7.14
31-40 1.09 3.23 1.43
41-50 2.19 4.03 7.14
51-60 1.64 0.00 1.43
61-70 0.00 0.81 0.00
71-80 0.00 0.00 1.43
81-90 0.00 0.00 0.00
91-100 1.09 1.61 5.71
from November to May; 2) in late spring and summer; 3)
in summer; 4) in summer and early fall; 5) during a short period, for 1 or 2 months but not consecutive (Fig. 4). The number of species with reproductive period 2 decreased (from 5 to 2 species) and the number of species with periods 3 and 5 increased (from 4 to 8 and from 1 to 7 species, respectively) from AG to NF sites (Fig. 4).
On the other hand, the number of species with calling males per month was positively correlated with the mean of monthly air temperature in the 3 sites (AG: rs= 0.903,
p= 0.0001; TA: rs= 0.804, p= 0.0016; NF: rs= 0.814,
p= 0.0013), and the monthly accumulated rainfall in AG and TA (rs= 0.702, p= 0.0109 and rs= 0.699, p= 0.0115, respectively).
The most active species in terms of calling activity
(calling rank ≥ 15) in AG were D. sanborni, H. pulchellus,
S. squalirostris, L. gracilis, L. latinasus, L. mystacinus, and P. falcipes. In TA, the species with high calling activity were D. nanus, D. sanborni, H. pulchellus, and S. squalirostris, whereas in NF, the same 4 species and H. raniceps had high calling activity.
The mean of monthly calling activity showed
significant differences among sites in 10 of the 22 species found vocalizing (Table 3). Conover multiple comparisons revealed that in AG this variable differed significantly (p
<0.05) from the other 2 sites for D. nanus, L. latinasus,
L. mystacinus and O. americanus, whereas AT exhibited differences from AG and NF in D. sanborni and P. limellum. Differences between NF and the remaining sites (AG and TA) were recorded for H. raniceps and S. acuminatus, whereas in H. punctatus and L. gracilis the mean of monthly calling activity differed only between AG and TA.
The high similarity in composition of breeding anurans occurred between TA and NF (Jaccard distance= 0.78). AG was the most different anuran reproductive community (Jaccard distance from AG to TA and NF node= 0.98). The cluster Cophenetic Coefficient Correlation value was 1.000.
Discussion
microhabitat use, and temporal breeding activity in 3 types of land use indicate that agricultural land use can alter the structure of anuran assemblages and has an effect on the breeding ecology of species in south-western Entre Ríos province, Argentina.
Composition and diversity of anuran communities. The presence of Hylids was highly variable among sites, possibly due to its arboreal habitat requirement (Gallardo, 1980). The AG site has structurally uniform elements and reduced environmental complexity; these 2 factors can influence the presence of some spatial guilds, particularly arboreal anurans, which are more prone to local decline in response to landscape changes (Peltzer et al., 2006). Therefore, the reduced occurrence of woody vegetation in AG could negatively influence hylid presence. Likewise, Attademo et al. (2005) and Peltzer et al. (2005) suggest that terrestrial and semi-aquatic species would be better represented than arboreal and aquatic species in agricultural areas. This might explain the presence of several species of the families Bufonidae and Leptodactylidae in AG site.
AG site showed the lowest species richness of the 3 sites; however, the highest evenness of species recorded in AG seems to have offset their low richness by exhibiting a high species diversity value. Interestingly, most of the studies conducted so far in Argentina reported a decrease in species diversity in the area near soybean fields compared to the pristine forest areas (e.g., Peltzer et al., 2005, 2006). The highest diversity of anurans in AG found in our study could be explained by the development of some natural vegetation as a consequence of the presence of natural water courses in the AG environment, which would provide shelter to some species of amphibians (Bonin et al., 1997; Weyrauch and Grubb, 2004). Another explanation for the high diversity found in AG may be that this community is at an intermediate successional stage (Connell, 1978).
Peltzer et al. (2006) proposed that the species commonly found in soybean matrices are those that rapidly adjust to non-forested open habitats. These species are able to exploit the modified habitat and therefore can have a stable population size or even increase their numbers in these environments. These are called invading species by Gascon et al. (1999). In this sense, P. falcipes was found only in AG site, and it was defined by Peltzer et al. (2005) (following Gascon et al., 1999) as an invading species of modified areas with a higher abundance in these kinds of habitats than in pristine areas. We suggest that L. gracilis,
L. latinasus, L. mystacinus and O. americanus would also be invading species, because of their high abundance in AG site in relation to the PDNP sites (TA and NF).
The distributions in AG site did not fit any range-abundance model employed in the study, whereas for the 2 PDNP sites the range-abundance model was best fitted Figure 4. Ordination by PCoA of the temporal distribution of
by the normal logarithmic series. This suggests that PDNP sites would have communities in dynamic equilibrium since they present environments that are not subjected to human activities or disturbances (Moreno, 2001), in which random variation of a great number of regulatory processes of community ecology will result in normal distribution of number of individuals per species (Magurran, 1988; Moreno, 2001). On the other hand, the highest species evenness recorded in AG would indicate that AG community, as mentioned above, is at an intermediate successional stage, whereas TA and NF could reflect a situation closer to climax, where competitive exclusion permits a greater dominance of certain species (Connell, 1978).
Breeding activity of anuran species. The distribution of breeding species among sites may respond to the composition of the anuran community of each site (Afonso and Eterovick, 2007). In some species no reproductive evidences were observed, such as in B. schneideri and O. americanus in TA, L. chaquensis in AG and NF, and B. arenarum in AG and TA. The absence of reproductive evidences in those sites could be a consequence of the low local abundances of the 4 species observed, which could reduce the encounter rate of reproductive evidences (Boquimpani-Freitas et al., 2002; Prado and Pombal, 2005).
Of the 7 reproductive modes recorded (Lavilla, 2004), MR 6 was the most common (45.5%); similar proportions were recorded for the 3 sites analyzed. MR 6 seems to be the most frequent reproductive mode in wetlands of Paraná River (Peltzer and Lajmanovich, 2007; Sanchez et al., 2009). Hödl (1990) stated that environmental factors, like relatively high humidity and temperature, are important to permit the evolution of more specialized reproductive modes, such as MR 6. Moreover, the compactness of the outer jelly matrix that characterized this mode may also play an important role in the protection from pathogens (Gomez-Mestre et al., 2006), dehydration, thermal shock, and could even help to preserve the spherical egg shape (McDiarmid and Altig, 1999) and retain the aquatic pollutants (Marquis et al., 2006).
On the other hand, diverse places and types of substrates were used for reproduction by anurans in the study sites. Sanchez et al. (2009) found similar results and suggested that spatial segregation would allow syntopic anurans to coexist in a breeding pond. Besides, we observed differences in AG from TA and NF in terms of locations and calling substrates, which would also be a consequence of the differential composition of species in the amphibian communities studied. The Hylidae species (about 50% in TA and NF) could indicate the habitat preferences of vocalization in these 2 communities, whereas other families, e.g. Leptodactylidae, had the highest number of
species in AG and could influence the proportion of sites chosen for the calling activity in this site. Accordingly, the burrowing species of the family Leptodactylidae often vocalize from their caves built on the land surrounding the pond or from the edge of the water body on plants present (e.g., Oliveira Filho and Giarreta, 2008; Sanchez et al., 2009), whereas Hylidae species usually vocalize from inside the pond or at its edge, and on branches of vegetation (e.g., Rossa-Feres and Jim, 2001; Sanchez et al., 2009). These results are in agreement with the trends we observed.
The microhabitat breadth index (Bj) responds to the substrate variety used by calls and the proportion that each one represents in the total observations (Heyer, 1976). It is known that microhabitat diversity used in amphibians is influenced by their availability in the environment (Cardoso et al., 1989; Eterovick et al., 2010), which in turn could be affected by vegetation type and degree of anthropogenic disturbance (Santos et al., 2008). Furthermore, the co-existence with a different group of species (competitors, predators, etc., not proven in this study) in each local assemblage may also influence reproductive microhabitat use (Eterovick et al., 2010). This would explain the different Bj values obtained for some species (B. fernandezae, D. nanus, S. acuminatus, T. typhonius, L. latinasus, L. latrans
and P. albonotatus) in the sites analyzed (AG, TA and NF).
The months with the highest number of reproductive evidences (vocalizations, amplexus, eggs and tadpoles) were December, January and February, which is consistent with results found by Lajmanovich (2000) in the Middle Paraná. Five reproductive periods were observed and interestingly, the number of species with reproductive period 2 decreased and the number of species with periods 3 and 5 increased from AG to NF sites. These differences among sites may respond to several interacting factors: a) composition of anuran communities in each site (Afonso and Eterovick, 2007); b) abundance of the species at each site, which affects their detectability (Prado and Pombal, 2005); for example, L. latinasus
habitats in agricultural fields have an increased exposure to solar radiation, which causes increases in air and soil temperature and decreases in humidity (Saunders et al., 1991; Karraker and Welsh, 2006). This could further affect activity patterns in the agricultural fields. Furthermore, it is noteworthy that the water bodies in AG and TA exhibited a permanent hydroperiod, whereas the NF pond was semi permanent. Arzabe (1999) emphasized the influence of hydroperiod and water availability on the reproductive activity of anurans. This author recorded the same species that showed dissimilarities in calling activity patterns in 2 different sites.
From the 22 recorded species, 10 showed significant differences among sites in mean monthly calling activity. These results might respond to a combination of factors, such as composition of anuran communities, species abundance and its effect on detectability, structural complexity of vegetation and its influence on reproductive microhabitat availability, and variation of microclimatic characteristics among sites. This interaction of factors could lead to differences among sites in terms of reproductive periods of amphibians.
Conclusions. Functional diversity, represented by ecological attributes of species (e.g., habitat preferences, reproductive activity, and reproductive modes) is a better predictor of environmental health than species diversity by itself (Ernst et al., 2006), because species are lost from areas subjected to anthropogenic disturbance when their ecological requirements are no longer met (De Souza and Eterovick, 2011). Accordingly, the present study shows that both reproductive microhabitat use and breeding periods are modified in the agricultural site, suggesting that land use for agriculture has an effect on the breeding ecology of amphibians in central-eastern Argentina. Considering the present results, and in order to protect all environments within PDNP (continental and island areas) from negative effects of agricultural activities conducted in nearby areas, we recommend establishing a buffer zone or peripheral damping area for the Park (according to Neumann, 1997) to preserve wildlife and enhance conservation values of the protected area. Further studies are necessary to continue evaluating possible plasticity in reproductive strategies and ecological responses to different environmental variables over long periods, to incorporate other variables in the analysis of the ecological risk for amphibians (Lajmanovich et al., 2010) produced by conversion of native ecosystems to soybean cropping areas.
Acknowledgements
We would like to thank Juan A. Sarquis and Marcos E. Galeano for their help in the field, and the landowners who
allowed us access to their property. Permits for access and field work in Pre-Delta National Park were provided by Delegación técnica de parques nacionales regional noreste. Park-keepers provided warm hospitality during the study period in the park. Jorgelina Brasca revised the English text. We are thankful to the Conicet (Consejo nacional de investigaciones científicas y técnicas) for providing the financial support as fellowships during the first author´s Doctoral thesis. This research was also supported by grants AM PIP CONICET 2009 and RL PICT 2006. We finally thank Agencia nacional de promoción científica y tecnológica, and Curso de acción para la investigación y desarrollo.
Literature cited
Aceñolaza, P. G., H. E. Povedano, A. S. Manzano, J. Muñoz, J. I. Areta and A. L. Ronchi Virgolini. 2004. Biodiversidad del Parque Nacional Pre-Delta. In Temas de la biodiversidad del litoral fluvial argentino I, F. G. Aceñolaza (ed.). INSUGEO, Tucumán. p. 169-184.
Afonso, L. G. and P. C. Eterovick. 2007. Spatial and temporal distribution of breeding anurans in streams in southeastern Brazil. Journal of Natural History 41:949-963.
Aguirre Calderón, O. A., J. Corral Rivas, B. Vargas Larreta and J. Jiménez Pérez. 2008. Evaluación de modelos de diversidad-abundancia del estrato arbóreo en un bosque de niebla. Revista Fitotecnia Mexicana 31:281-289.
Agüero, N. S., M. M. Moglia and M. B. Jofré. 2010. ¿Se relaciona el patrón de abundancia y distribución de anuros con la estructura de las comunidades de plantas en hábitats acuáticos de la ciudad de San Luis (Argentina)?. Neotropical Biology and Conservation 5:63-76.
Arzabe, C. 1999. Reproductive activity patterns of anurans in two different altitudinal sites within the Brazilian Caatinga. Revista Brasileira de Zoologia 16:851-864.
Attademo, A. M., P. M. Peltzer and R. C. Lajmanovich. 2005. Amphibians occurring in soybean and implications for biological control in Argentina. Agriculture Ecosystems and Environment 106:389-394.
ASIH, HL and SSAR. 2004. Guidelines for use of live amphibians and reptiles in field and laboratory research. http://www.asih. org/files/hacc-final.pdf; last access: 17.VIII.2012.
Bertoluci, J. and M. T. Rodrigues. 2002. Seasonal patterns of breeding activity of Atlantic rainforest anurans at Boracéia, southeastern Brazil. Amphibia-Reptilia 23:161-167. Bonin, J., J. L. DesGranges, J. Rodrigue and M. Ouellet. 1997.
Anuran species richness in agricultural landscapes of Quebec: foreseeing long-term results of road call survey. In Amphibians in decline: Canadian studies of a global problem, D. M. Green (ed.). Society for the study of amphibians and reptiles, St. Louis, Missouri. p. 141-149.
rain-forest area of southeastern Brazil. Journal of Herpetology 36:318-322.
Cardoso, A. J., G. V. Andrade and C. F. B. Haddad. 1989. Distribuição espacial em comunidades de anfíbios (Anura) no Sudeste do Brasil. Revista Brasileira de Biologia 49:241-249.
Clary, W. P. and D. E. Medin. 1999. Riparian zones-the ultimate ecotones? USDA Forest Service Proceedings RMRS-P-11:49-55.
Connell, J. H. 1978. Diversity in tropical rain forests and coral reefs. Science 199:1302-1310.
Conover, W. J. 1999. Practical nonparametric statistics. John Wiley and Sons, New York. 584 p.
Crump, M. L. and N. J. Scott. 1994. Visual encounter surveys. In Measuring and monitoring biological diversity-standard methods for amphibians, W. R. Heyer, M. A. Donelly, R. W. McDiarmid, L. C. Hayek and M.S. Foster (eds.). Smithsonian Institution Press, Washington and London. p. 84-92. Davidson, C. and R. A. Knapp. 2007. Multiple stressors and
amphibian declines: dual impacts of pesticides and fish on Yellow-Legged frogs. Ecological Applications 17:587-597. De Souza, A. M. and P. C. Eterovick. 2011. Environmental
factors related to anuran assemblage composition, richness and distribution at four large rivers under varied impact levels in Southeastern Brazil. River Research and Applications 27:1023-1036.
Duellman, W. E. and L. Trueb. 1986. Biology of amphibians. McGraw-Hill, New York. 670 p.
Duré, M. I., A. I. Kehr, E. F. Schaefer and F. Marangoni. 2008. Diversity of amphibians in rice fields from north-eastern Argentina. Interciencia 33:523-527.
Edwards, T. M., B. C. Moore and L. J. Guillette. 2006. Reproductive dysgenesis in wildlife: a comparative view. International Journal of Andrology 29:109-121.
Ernst, R., K. E. Linsenmair and M. O. Rödel. 2006. Diversity erosion beyond the species level: dramatic loss of functional diversity after selective logging in two tropical amphibian communities. Biological Conservation 133:143-155. Eterovick, P. C., C. R. Rievers, K. Kopp, M. Wachlevski, B. P.
Franco, C. J. Dias, I. M. Barata, A. D. M. Ferreira and L. G. Afonso. 2010. Lack of phylogenetic signal in the variation in anuran microhabitat use in southeastern Brazil. Evolutionary Ecology 24:1-24.
Fahrig, L. 2003. Effects of habitat fragmentation on biodiversity. Annual Review of Ecology Evolution and Systematics 34:487-515.
Firbank, L. G., S. Petit, S. Smart, A. Blain and R. J. Fuller. 2008. Assessing the impacts of agricultural intensification on biodiversity: a British perspective. Philosophical Transactions of the Royal Society B 363:777-787.
Fitzgerald, L. A., F. B. Cruz and G. Perotti. 1999. Phenology of a lizard assemblage in the Dry Chaco of Argentina. Journal of Herpetology 33:526-535.
Frost, D. R., T. Grant, J. Faivovich, R. H. Bain, A. Haas, C. F. B. Haddad, R. O. de Sá, A. Channing, M. Wilkinson, S. C. Donnellan, C. J. Raxworthy, J. A. Campbell, B. L. Blotto,
P. Moler, R. C. Drewes, R. A. Nussbaum, J. D. Lynch, D. M. Green and W. C. Wheeler. 2006. The amphibian tree of life. Bulletin of the American Museum of Natural History 297:1-370.
Gallardo, J. M. 1980. Estudio ecológico sobre los anfibios y reptiles del noreste de la provincia de Buenos Aires (Argentina). Actas I Reunión Iberoamericana de Zoología de Vertebrados, La Rábida [España]:331-349.
Gardner, T. A., J. Barlow and C. A. Peres. 2007. Paradox, presumption and pitfalls in conservation biology: the importance of habitat change for amphibians and reptiles. Biological Conservation 138:166-179.
Gascon, C., T. E. Lovejoy, R. O. Bierregrad, J. R. Malcolm, P. C. Stouffer, H. L. Vasconcelos, W. F. Laurance, B. Zimmerman, M. Tocher and S. Borges. 1999. Matrix habitat and species richness in tropical forest remnants. Biological Conservation 91:223-229.
Gomez-Mestre, I., J. C. Touchon and K. M. Warkentin. 2006. Amphibian embryo and parental defenses and a larval predator reduce egg mortality from water mold. Ecology 87:2570-2581.
Grau, H. R., N. I. Gasparri and T. M. Aide. 2005. Agriculture expansion and deforestation in seasonally dry forests of north-west Argentina. Environmental Conservation 32:140-148. Greenberg, C. H., D. G. Neary and L. D. Harris. 1994. A
Comparison of herpetofaunal sampling effectiveness of pitfall, single-ended, and double-ended funnel traps used with drift fences. Journal of Herpetology 28:319-324. Haddad, C. F. B. and C. P. A. Prado. 2005. Reproductive modes
in frogs and their unexpected diversity in the Atlantic forest of Brazil. BioScience 55:207-217.
Hammer, Ø., D. A. T. Harper and P. D. Ryan. 2001. PAST: Paleontological statistics software package for education and data analysis. Palaeontología Electrónica 4:1-9.
Hayes, T. B., V. Khoury, A. Narayan, M. Nazir, A. Park, T. Brown, L. Adame, E. Chan, D. Buchholz, T. Stueve and S. Gallipeau. 2010. Atrazine induces complete feminization and chemical castration in male African clawed frogs (Xenopus laevis). Proceedings of the National Academy of Sciences of the United States of America 107:4612-4617.
Hecnar, S. J. and R. T. M’Closkey. 1998. Species richness patterns of amphibians in Southwestern Ontario ponds. Journal of Biogeography 25:763-772.
Heyer, W. R. 1976. Studies in larval amphibian habitat partitioning. Smithsonian Contributions to Zoology 242:1-27.
Hödl, W. 1990. Reproductive diversity in amazonian lowland frogs. Fortschrine der Zoologie 38:41-60.
Hurlbert, S. H. 1971. The non-concept of species diversity: a critique and alternative parameters. Ecology 52:577-586. Infostat. 2006. Infostat Demo/Professional, ver. 2006d.1.
Grupo Infostat, F.C.A., Universidad Nacional de Córdoba, Córdoba.
Joly, P., C. Miaud, A. Lehmann and O. Grolet. 2001. Habitat matrix effects on pond occupancy in newts. Conservation Biology 15:239-248.
of even-aged timber management on abundance and body condition of terrestrial amphibians in Northwestern California. Biological Conservation 131:132-140.
Khan, M. Z. and F. C. P. Law. 2005. Adverse effects of pesticides and related chemicals on enzyme and hormone systems of fish, amphibians and reptiles: a review. Proceedings of the Pakistan Academy of Sciences 42:315-323.
Knutson, M. G., W. B. Richardson, D. M. Reineke, B. R. Gray, J. R. Parmelee and S. E. Weick. 2004. Agricultural ponds support amphibian populations. Ecological Applications 14:669-684.
Lajmanovich, R. C. 2000. Interpretación ecológica de una comunidad larvaria de anfibios anuros. Interciencia 25:71-79.
Lajmanovich, R. C., P. M. Peltzer, C. Junges, A. M. Attademo, L. C. Sanchez and A. Bassó. 2010. Activity levels of B-esterases in the tadpoles of 11 species of frogs in the middle Paraná River floodplain: implication for ecological risk assessment of soybean crops. Ecotoxicology and Environmental Safety 73:1517-1524.
Lavilla, E. O. 2004. Reproducción y desarrollo en anuros argentinos. In Sistemática y filogenia de los vertebrados, con énfasis en la fauna argentina, R. Montero and A. G. Autino (eds.). Universidad Nacional de Tucumán, Tucumán. p 137-143.
Lavilla, E. O., J. A. Langone, U. Caramaschi, W. R. Heyer and de R. O. Sá. 2010a. The identification of Rana ocellata Linnaeus, 1758. Nomenclatural impact on the species currently known as Leptodactylus ocellatus (Leptodactylidae) and Osteopilus brunneus (Gosse, 1851) (Hylidae). Zootaxa 2346:1-16. Lavilla, E. O., J. A. Langone, J. M. Padial and R. O. de Sá. 2010b.
The identity of the crackling, luminescent frog of Suriname (Rana typhonia Linnaeus, 1758) (Amphibia, Anura). Zootaxa 2671:17-30.
Levins, R. 1968. Evolution in changing environments: some theoretical explorations. Princeton University Monographs in Population Biology 2:1-120.
Magurran, A. E. 1988. Ecological Diversity and its Measurements. Princeton University Press, Princeton. 179 p.
Marquis, O., A. Millery, S. Guittonneau and C. Miaud. 2006. Toxicity of PAHs and jelly protection of eggs in the Common frog Rana temporaria. Amphibia-Reptilia 27:472-475. Martín, J., J. J. Luque-Larena and P. López. 2006. Collective
detection in escape responses of temporary groups of Iberian green frogs. Behavioral Ecology 17:222-226.
McDiarmid, R. W. and R. Altig (eds.). 1999. Tadpoles, the biology of anuran larvae. The University of Chicago Press, Chicago. 458 p.
Moreno, C. E. 2001. Métodos para medir la biodiversidad. M and T-Manuales y Tesis SEA, Zaragoza. 84 p.
Neumann, R. P. 1997. Primitive ideas: protected area buffer zones and the politics of land in Africa. Development and Change 28:559-582.
Oliveira, F. F. R. and P. C. Eterovick. 2010. Patterns of spatial distribution and microhabitat use by syntopic anuran species along permanent lotic ecosystems in the cerrado of
Southeastern Brazil. Herpetologica 66:159-171.
Oliveira Filho, J. C. and A. A. Giarreta. 2008. Reproductive behavior of Leptodactylus mystacinus (Anura, Leptodactylidae) with notes on courtship call of other Leptodactylus species. Iheringia. Série Zoologia 98:508-515.
Peltzer, P. M., R. C. Lajmanovich and A. H. Beltzer. 2003. The effects of habitat fragmentation on amphibian species richness in the floodplain of the middle Paraná River. Herpetological Journal 13:95-98.
Peltzer, P. M., R. C. Lajmanovich, A. M. Attademo and W. Cejas. 2005. Diversidad y conservación de anuros en ecosistemas agrícolas de Argentina: implicancias en el control biológico de plagas. In Temas de la biodiversidad del litoral fluvial argentino II, F. G. Aceñolaza (ed.). INSUGEO, Tucumán. p. 399-416.
Peltzer, P. M., R. C. Lajmanovich, A. M. Attademo and A. H. Beltzer. 2006. Diversity of anurans across agricultural ponds in Argentina. Biodiversity and Conservation 15:3499-3513. Peltzer, P. M. and R. C. Lajmanovich. 2007. Amphibians. In The
middle Paraná River: limnology of a subtropical wetland, M. H. Iriondo, J. C. Paggi and M. J. Parma (eds.). Springer Berlin Heidelberg, New York. p. 327-340.
Peltzer, P. M., R. C. Lajmanovich, J. C. Sánchez- Hernández, M. C. Cabagna, A. M. Attademo and A. Bassó. 2008. Effects of agricultural pond eutrophication on survival and health status of Scinax nasicus tadpoles. Ecotoxicology and Environmental Safety 70:185-197.
Pickford, D. B. and I. D. Morris. 2003. Inhibition of gonadotropin-induced oviposition and ovarian steroidogenesis in the African clawed frog (Xenopus laevis) by the pesticide methoxychlor. Aquatic Toxicology 62:179-194.
Pope, S. E., L. Fahrig and H. G. Merriam. 2000. Landscape complementation and metapopulation effects on leopard frog populations. Ecology 81:2498-2508.
Prado, G. M. and J. P. Pombal. 2005. Distribuição espacial e temporal dos anuros em um brejo da Reserva Biológica de Duas Bocas, sudeste do Brasil. Arquivos do Museu Nacional, Rio de Janeiro 63:685-705.
Pyron, R. A. and J. J. Wiens. 2011. A large-scale phylogeny of Amphibia including over 2 800 species, and a revised classification of extant frogs, salamanders, and caecilians. Molecular Phylogenetics and Evolution 61:543-583. Quintana, G. J. R. and P. López Anido. 2010. Red de evaluación
de cultivares de soja del NEA, Campaña 2009-2010. Instituto Nacional de Tecnología Agropecuaria, Centro Regional Chaco-Formosa, Chaco. 29 p.
Rossa-Feres, D. C. and J. Jim. 2001. Similaridade do sítio de vocalização em uma comunidade de anfíbios anuros na região noroeste do Estado de São Paulo. Revista Brasileira de Zoologia 18:439-454.
Sanchez, L. C., P. M. Peltzer and R. C. Lajmanovich. 2009. Structure of wetland-breeding anuran assemblages from the southern section of the Paraná river, Argentina. Herpetological Journal 19:173-184.
Sans, F. X. 2007. La diversidad de los agroecosistemas. Ecosistemas 16:44-49.
Santos, T. G., K. Kopp, M. R. Spies, R. Trevisan and S. Z. Cechin. 2008. Distribuição temporal e espacial de anuros em área de Pampa, Santa Maria, RS. Iheringia. Série Zoologia 98:244-253.
Saunders, D. A., R. J. Hobbs and C. R. Margules. 1991. Biological consequences of ecosystem fragmentation: A review. Biological Conservation 5:18-32.
Shannon, C. E. and W. Weaver. 1949. The mathematical theory of communications. University of Illinois Press, Urbana. 117 p. Simberloff, D. S. 1972. Properties of the rarefaction diversity
measurement. American Naturalist 106:414-418.
Smith, M. E., J. K. Lewandrowski and N. D. Uri. 2000. Agricultural chemical residues as a source of risk. Review of Agricultural Economics 22:315-325.
Sparling, D. W., G. M. Fellers and L. L. McConnell. 2001. Pesticides and amphibian population declines in California USA. Environmental Toxicology and Chemistry 20:1591-1595.
U.S. EPA. 2002. Methods for evaluating wetland condition:
using amphibians in bioassessments of wetlands. U.S. Environmental Protection Agency, Office of Water, Washington, D. C. 41 p.
Vasconcelos, T. S., T. G. Santos, D. C. Rossa-Feres and C. F. B. Haddad. 2009. Influence of environmental heterogeneity of breeding ponds on anuran assemblages from southeastern Brazil. Canadian Journal of Zoology 87:699-707.
Weyrauch, S. L. and T. C. Grubb. 2004. Patch and landscape characteristics associated with the distribution of woodland amphibians in an agricultural fragmented landscape: an information-theoretic approach. Biological Conservation 115:443-450.
Zaimes, G. N., V. Iakovoglou, D. Emmanouloudis and D. Gounaridis. 2010. Riparian areas of Greece: their definition and characteristics. Journal of Engineering Science and Technology Review 3:176-183.