Trends and latest issues in broiler diet formulation
1A. Petri and A. Lemme, Hanau, Germany
1 Changes in feed composition over the recent years
For over 30 years Degussa has provided the industry with data on the amino acid composition of raw materials. This database provided to customers - today known as AMINODat®3.0 - has become the
standard in the industry being used by compound feed producers as well as in nutrition science as the reference for amino acids. Moreover, the large data base allowed for developing robust and reliable NIR calibrations for more than 20 important raw materials used in livestock nutrition. NIR technology enables rapid amino acid analysis within few minutes.
Apart from analysing raw materials Degussa is highly experienced in amino acid analyses of compound feeds as the company offers analytical services in various respects. Thus, Degussa is providing the same analytical quality and resources in the analysis of compound feeds. Analyses of the data which accumulated during recent years revealed some interesting trends regarding specifications used in broiler diets.
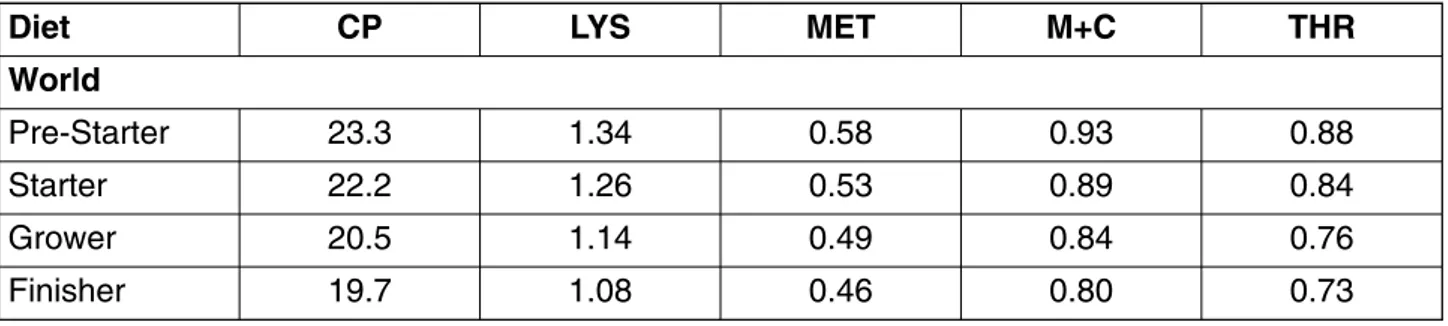
Table 1: Average crude protein and total amino acid contents analysed in a total of 1632 compound broiler feeds originating from all regions in the world and collected from 2001 until 2006
The data reported is based upon analysis of 1632 broiler feeds for amino acid content in Degussa’s laboratory in Hanau, Germany. In total 105 pre-starter, 497 starter, 604 grower and 426 finisher feeds were analysed. The number of samples analysed per year were 202, 239, 274, 403, 334 and 180, respectively, for the calendar years 2001 up to and including the first six months of 2006. Only data with full information about the diets regarding the phase (pre-starter, starter, grower, and finisher diets), the country of origin, and the analytical data of total amino acids plus crude protein and supplemented amino acids were used. In this first survey only diets supplemented with DL-Methionine were used whilst those supplemented with the hydroxy analogue of methionine (liquid FA, MHA-Ca) and those containing both methionine sources were excluded. Diets from feeding experiments were also excluded. Thus, the diets used in this evaluation should represent commercial practice of the recent years.
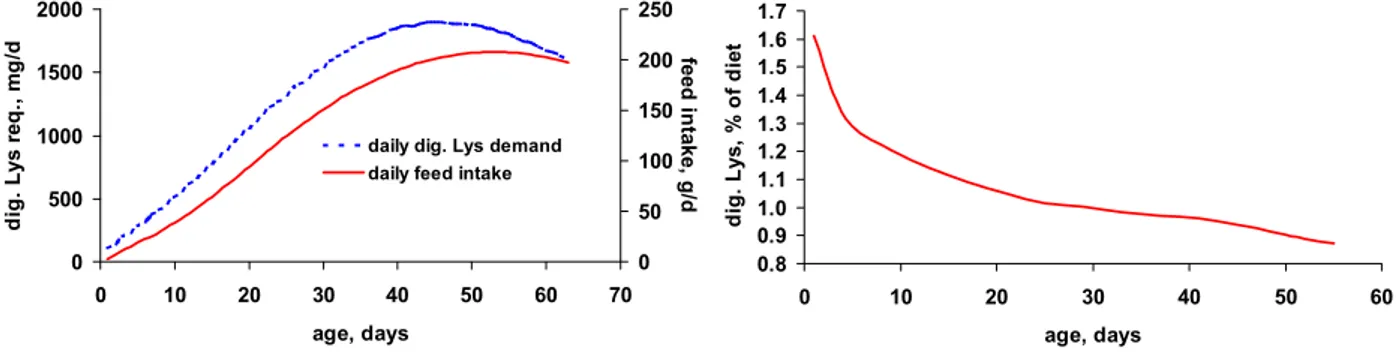
In Table 1 the global average crude protein and amino acid levels are shown. Although the length of the phases are not specified for the single feeds, a clear dietary reduction of both protein and amino acids from pre-starter to finisher feed can be obtained. Dietary protein reduced from 23.3 % to 19.7 % and Met+Cys from 0.93 % to 0.80 %, respectively. Lys as the reference amino acid of the “Ideal Protein Concept” decreased from 1.34 % to 1.08 %. This generally fits well to the shape of the ideal curve for optimum dietary amino acid levels in compound feed which is the product from the daily feed intake and daily amino acid requirement. This is illustrated for digestible lysine in Figure 1. In
Diet CP LYS MET M+C THR
World
Pre-Starter 23.3 1.34 0.58 0.93 0.88
Starter 22.2 1.26 0.53 0.89 0.84
Grower 20.5 1.14 0.49 0.84 0.76
Finisher 19.7 1.08 0.46 0.80 0.73
addition, the means given in Table 1 suggest increasing ratios to Lys particularly for Met+Cys but also for Thr which is also in line with principles of the amino acid nutrition as there is an increasing requirement for Met+Cys and also Thr with age for maintenance purposes relative to lysine. These relationships are functions of body weight which increases with age.
Figure 1: Typical curves for the daily requirement of digestible lysine (left, dotted line) an for daily feed intake (left, solid line) of meat type broilers and the resulting curve for optimum digestible lysine content in the feed (right)
However, the figures shown in Table 1 are global averages and a more detailed analysis of the data revealed that specifications varied when compared on country level. Two examples from Australia and India demonstrate this variation (Table 2). The Australian data represent specifications higher than the global average. No pre-starter diets were defined. Dietary Lys levels were higher in all type diets but especially in the grower feed. At the same time, Met+Cys to Lys ratio increased from 71 % to 81 %. In contrast, analysed crude protein and amino acid levels in compound feed from India were on average substantially lower than those of the global average.
Table 2: Average crude protein and total amino acid contents in compound broiler feeds collected from 2001 until 2006 in Australia* and India (% of diets, all figures standardized to 88 % dry matter)
* no pre-starter diets were defined
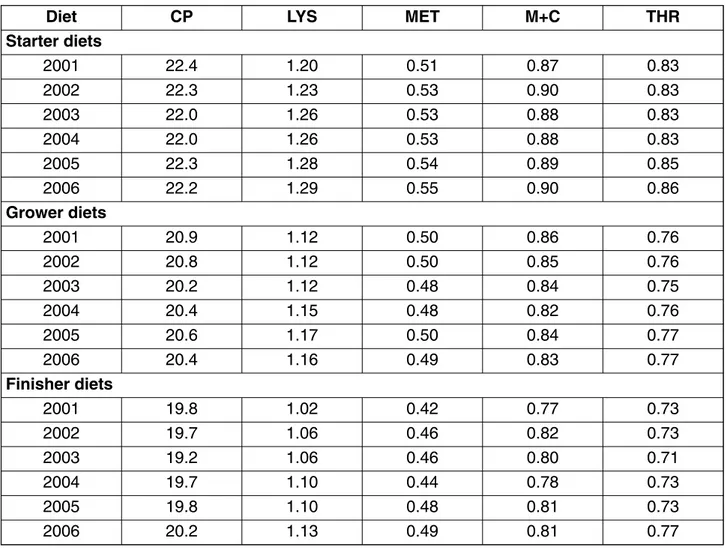
The question about the reasons for these differences will be discussed later in this review. Table 3 shows that over the course of the recent five years protein levels were rather stable at about 22.0 %, 20.5 %, and 20 % in the starter, grower, and finisher feeds, respectively. In contrast, dietary Lys levels continuously increased. The development is less pronounced for Met or Met+Cys. Particularly in the starter and finisher feeds dietary Met levels tended to increase over recent years. However, at the same time the Met+Cys to Lys ratio decreased over the years – a trend which will jeopardise optimum
0 500 1000 1500 2000
0 10 20 30 40 50 60 70
age, days
d
ig.
Ly
s r
eq.
, m
g
/d
0 50 100 150 200 250
feed
i
n
take,
g
/d
daily dig. Lys demand daily feed intake
0.8 0.9 1.0 1.1 1.2 1.3 1.4 1.5 1.6 1.7
0 10 20 30 40 50 60
age, days
di
g
. L
ys
, %
of
di
et
Diet CP LYS MET M+C THR
Australia*
Starter 23.2 1.30 0.56 0.92 0.83
Grower 22.3 1.23 0.54 0.95 0.77
Finisher 21.2 1.13 0.49 0.91 0.75
India
Pre-Starter 22.2 1.25 0.54 0.87 0.80
Starter 21.7 1.15 0.49 0.80 0.77
Grower 20.2 1.09 0.44 0.74 0.72
performance. Vieira et al. (2004) fed graded dietary Met+Cys levels to 14-35 days old male broilers of two commercial strains at adequate and high dietary protein. Regression analysis revealed that optimum ratio between digestible Met+Cys and digestible Lys is at least 77 % regardless the strain and the dietary protein level. Research by Silva et al. (2005), Mack et al. (1999), and Lippens et al. (1997) also suggested higher Met+Cys to Lys ratios. Moreover, Lemme et al. 2003a demonstrated that suboptimum Met+Cys supply not only impaired broiler performance but also increased flock variation.
Dietary Thr levels seemed to have increased only from 2004/2005 on. This might partly be due to a better availability of L-Threonine because global L-Threonine production was increased and more data on both the Thr requirement of broilers and the ideal amino acid composition got available. The use of supplemental amino acids for balancing the dietary protein has generally increased, indicating a better understanding of the amino acid nutrition of broilers. In the years 2001/2002 all diets were supplemented with a methionine source whilst 80 % of the diets contained supplemental L-Lysine and only 22 % contained added L-Threonine. About five years later (2005/2006) again DL-Methionine was supplemented to all diets but penetration of Lys supplementation increased by 13 percentage points and that of Thr even by 19 percentage points to 93 and 41 %, respectively.
Table 3: Total amino acid contents analysed in compound broiler feeds ranked according to year
The figures shown in Tables 1 to 3 can only give trends as they are biased by a number of factors. Among them is for instance that the length of the phases (on which optimum dietary amino acids levels are dependent) were not defined, different production conditions affecting diet composition are averaged, the number of samples between countries, feed types, and years were not equally distrib-uted. However, on the other hand there are some general trends which might explain some devel-opments in broiler production and broiler nutrition in particular.
Diet CP LYS MET M+C THR
Starter diets
2001 22.4 1.20 0.51 0.87 0.83
2002 22.3 1.23 0.53 0.90 0.83
2003 22.0 1.26 0.53 0.88 0.83
2004 22.0 1.26 0.53 0.88 0.83
2005 22.3 1.28 0.54 0.89 0.85
2006 22.2 1.29 0.55 0.90 0.86
Grower diets
2001 20.9 1.12 0.50 0.86 0.76
2002 20.8 1.12 0.50 0.85 0.76
2003 20.2 1.12 0.48 0.84 0.75
2004 20.4 1.15 0.48 0.82 0.76
2005 20.6 1.17 0.50 0.84 0.77
2006 20.4 1.16 0.49 0.83 0.77
Finisher diets
2001 19.8 1.02 0.42 0.77 0.73
2002 19.7 1.06 0.46 0.82 0.73
2003 19.2 1.06 0.46 0.80 0.71
2004 19.7 1.10 0.44 0.78 0.73
2005 19.8 1.10 0.48 0.81 0.73
2 Genetic factors influencing optimum amino acid supply
Growth of the animals is basically determined by their genetic potential. Depending on the environment in which the broilers grow, the management of the operation and the composition of the feed, this potential can more or less be realised.
2.1 Genetic progress
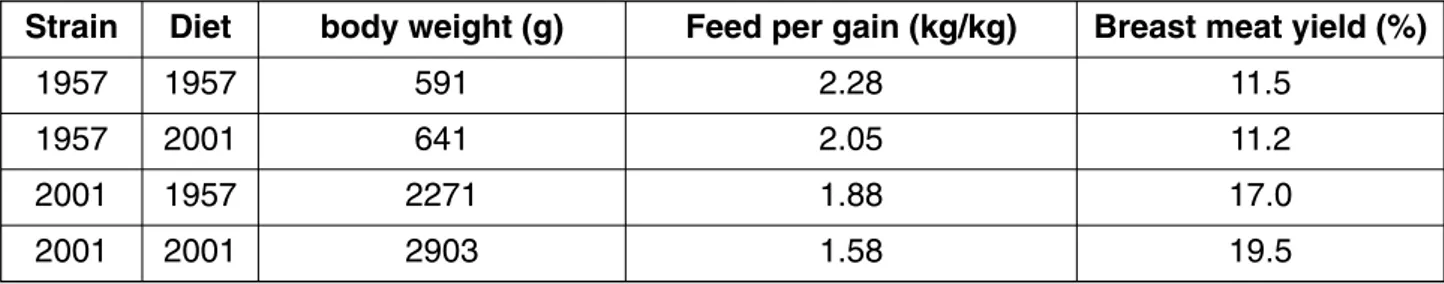
The genetic progress in broiler breeding is spectacular. Body weight of Cobb 500 birds at day 42 has increased from 2076 to 2848 g within 10 years from 1994 until 2004 (Wilson, 2005). Mc Kay et al. (2000) reported that live weights of Ross broilers at 42 days have more than doubled from 1976 (1050 g) until 2000 (2600 g). Moreover, a male bird of 2000 g yielded 250 g of breast meat (12.5 % of body weight) in 1976 whilst in 2000 a bird with the same body weight yielded 340 g (17.0 % of body weight). Such changes in animal growth and proportion of muscle tissues must affect nutritional requirements. Havenstein et al. (2003a,b) fed diets representative for 1957 and 2001 to two broiler types. The one strain they used represented the genetic potential of 1957 (Athens-Canadian Random-bred Control, ACRC) and the other strain was Ross 308 representing current performance potential. Metabolizable Energy as well as lysine and methionine plus cystine contents of the 1957 and the 2001 diets are shown in Table 4, the results of the feeding trial are reported in Table 5. The diets were mainly based on corn and soybean meal but also animal by-products were used. However, in the 1957 diets no amino acids as well as other feed additives like choline chloride or enzymes were used as they were not available at that time.
Table 4: Metabolizable energy, total lysine, and total methionine plus cystine content of diets as common in 1957 and 2001 (Havenstein et al., 2003a,b)
Not only the absolute level of amino acids were raised from 1957 to 2001 but also the ratio of Met+Cys to Lys which was 73 and 79 % in the 2001 starter and grower diet and 64 and 72 % in the 1957 diets, respectively. This reflects both an improved knowledge on optimum supply of sulphur containing amino acids for broilers and simply the availability of DL-Methionine for balancing the dietary amino acid profile. In this context it should be noted that the trend of decreasing Met+Cys to Lys ratios observed in the AminoLab®data base (Table 3) can result in impaired profitability as animal performance
is not optimised.
Table 5: Body weight, feed conversion, and breast meat yield of male broilers obtained from strains with genetic potential of 1957 and 2001 fed diets common in 1957 and 2001 (Havenstein et al., 2003a,b)
1957 diet 2001 diet
Phase Starter Grower Starter Grower
Metab. Energy (kcal / kg) 2895 2930 3200 3150
Total Lysine (% of diet) 1.18 0.90 1.25 1.10
Total Met + Cys (% of diet) 0.75 0.65 0.91 0.87
Strain Diet body weight (g) Feed per gain (kg/kg) Breast meat yield (%)
1957 1957 591 2.28 11.5
1957 2001 641 2.05 11.2
2001 1957 2271 1.88 17.0
The data by Havenstein et al. (2003a,b) clearly reflect the genetic progress reported by McKay et al. (2000) and Wilson (2005). Feeding the 1957 type diet to birds of current genetic potential resulted in a significant drop in final body weight at day 42, a 30-point increase in feed conversion ratio, and a strong reduction of 2.5 %-points in breast meat yield when compared to the performance on the 2001 type diets. However, although feeding the 2001 diets to the 1957 strain improved performance compared to feeding the 1957 diet, the magnitude was much lower compared to the effects of the corresponding treatments of the 2001 strain. This clearly demonstrates both, a higher nutrient requirement and a much more efficient utilisation of dietary nutrients including amino acids of currently used broiler strains compared to former genetics. As a consequence diet specifications should be checked regularly and adjusted to the increasing performance potential of the birds.
2.2 Different genetic potentials among currently used broiler strains
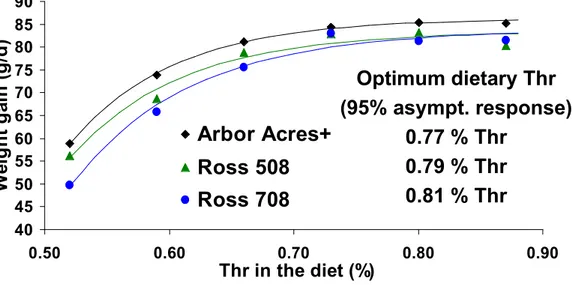
Observation of the performance potential over time is meaningful. However, there are also differences in performance when currently available broiler strains are compared. As example might serve a Thr dose response trial which was performed with three Aviagen broiler strains (Kidd et al., 2004). In this trial, Thr was gradually increased from 0.52 to 0.87 % in a diet containing 1.08 % Lys. Experimental diets were fed to 21-42 days old, male Arbor Acres Plus, Ross 508, and Ross 708 broilers.
In Figure 2 the responses on body weight gain are shown. Data were analysed by exponential regression in order to derive estimates for optimum dietary Thr levels. In this trial, maximum performance was highest with Arbor Acres Plus birds achieving the asymptote at 86.3 g/d while the maximum performance of Ross 508 and 708 was similar with 83.5 and 83.8 g/d. Commonly, optimum dietary amino acid levels are estimated by determining the dose needed to achieve 95 % of the asymptotic response. Accordingly, optimum Thr levels were 0.77, 0.79, and 0.81 % for Arbor Acres Plus, Ross 508, and Ross 708 broilers indicating that optimum amino acid supply varies between strains. Related to dietary Lys these estimates revealed ratios of 71, 73, and 75 %. Lemme et al. (2004) used these data for economic considerations and figured out that for maximising the profitability (income over feed cost, considering effects on weight gain, feed conversion and changing feed costs) 0.78, 0.81, and 0.83 % Thr were needed in male Arbor Acres, Ross 508, and Ross 708 broilers (see also Figure 4). It is, thus, concluded, that amino acid specifications should be adjusted to the strain used.
Figure 2: Responses of male Arbor Acres Plus, Ross 508, and Ross 708 broilers to graded levels of dietary Thr on daily weight gain (data from Kidd et al., 2004)
40 45 50 55 60 65 70 75 80 85 90
0.50 0.60 0.70 0.80 0.90
Thr in the diet (%)
We
ig
ht
g
ain
(
g
/d)
Arbor Acres+
Ross 508
Ross 708
Optimum dietary Thr
(95% asympt. response)
2.3 Male and female birds have different growth curves
Havenstein et al. (2003a,b) did not test only male birds (compare Table 4) but included also female broilers. In that trial female Ross 308 broilers achieved a live weight of 2441 g in 42 days when fed a modern diet, males 2903 g.
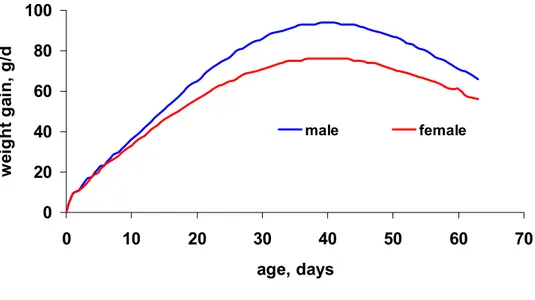
Figure 3 shows typical growth rates for current high yielding male and female broilers. Accordingly, maximum daily gain of both genders is achieved at the same age of about 40 days. However, the curve of the female birds is much flatter achieving a peak of about 75 g/d compared to males reaching a daily gain of about 95 g. From hatch to day 10 to 14, growth of both sexes is fairly similar but later on growth rates of male broilers are higher. Therefore, dietary amino acids can be lowered for female broilers in the grower and finisher diets.
Some strains available on the market are easy to sex whilst others are not. If there is no chance to separate male and female broilers the feed producers and the broiler growers are in a certain dilemma. If diets are designed for male broilers, half of the flock is overfed with nutrients which are expensive and possibly result in enhanced fat accretion in female birds. If diets are formulated to meet female’s requirements, male birds are underfed and their growth will be limited. The solution will be somewhere in between - but the optimum situation would be if males and females could receive specific diets.
Figure 3: Daily weight gain of male and female broilers
3 Optimum dietary amino acid levels depend on the production goal
Changing dietary amino acid density over the years as observed in Table 1 is probably mainly due to the increasing performance potential of the birds. However, during recent years the structure of the broiler business changed as well which also influenced the feeding strategies. For example, in 1972 about 70 % of the total broiler production in the USA was sold as whole birds and only 30 % as further processed products (Ollinger et al., 2000). This picture changed completely as in 1997 about 87 % of the US broiler production was sold as further processed products. At the same time final body weight increased from 1.7 kg to 2.2 kg. In 2005, average body weight of broilers was 2.5 kg. Changing focus of the production goal impacts optimum dietary amino acid level. Pack et al. (2003) conducted meta-analyses of Met+Cys, Lys, and Thr dose-response studies conducted with growing broilers (approx. 15-40 days of age). Data of all available studies were standardised, plotted in one diagram and analysed by exponential regression. The three performance criteria body weight gain, feed conversion ratio, and breast meat yield were considered.
The outcome of the literature survey for Met+Cys (9 trials), Lys (5 trials), and Thr (4 trials) is summarised in Table 6. The lowest estimates were found for maximising body weight gain – consistently for all amino acids. In order to minimise feed conversion ratio clearly higher amino acid levels were needed
0 20 40 60 80 100
0 10 20 30 40 50 60 70
age, days
w
ei
ght
ga
in
,
g/d
whereas at least for Lys and Thr even higher dietary supply was needed to maximise breast muscle growth. These numbers demonstrate that optimum dietary amino acid levels depend on the production target.
Pack et al. (2003) made some economic considerations on optimum dietary Met+Cys and Lys levels. Increasing these amino acids by 0.10 %-points by supplementing of DL-Methionine or L-Lysine increased diet costs. However, relating the feed costs to body weight revealed that the increase of either DL-Methionine or L-Lysine reduced the feed cost per kg body weight by about 0.3 % because the growth of the birds more than compensated the additional costs. If feed costs were related to breast meat yield an increase of 0.10 % in supplemental methionine or lysine reduced the feed costs per kg breast meat even by 1.8 % (Met+Cys) or 3.9 % (Lys) reflecting that the breast muscle responds very sensitive to dietary amino acid supply.
Table 6: Optimum dietary amino acid levels as estimated in literature surveys comprising 9 Met+Cys, 5 Lys and 4 Thr dose response trials conducted with 15 – 42 (Met+Cys, Lys) and 20 – 56 days old broilers (Pack et al., 2003)
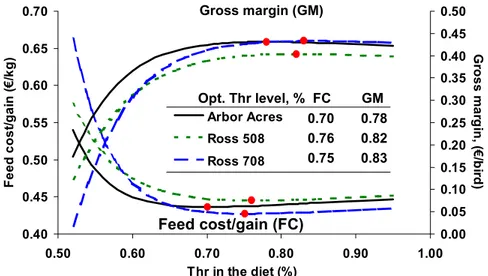
In the above mentioned Thr trial with three broiler strains also economic calculations were performed (Figure 4, Lemme et al., 2004). These calculations did not only focus on feed cost per kg weight gain but also on income over feed cost (gross margin). The performance response curves and the respective regression equations were combined with the feed costs which increase with increasing dietary Thr level and the revenues are shown in Figure 3. Minimizing feed cost per kg weight gain prohibits maximizing overall profitability in terms of gross margin. In this context it shall be noted that application of the ideal protein concept in broiler nutrition and increasing balanced protein levels have a tremendous effect on weight gain, breast meat yield and feed conversion which will impact gross margin.
Dietary amino acid specifications strongly depend on the production goal. If only live weight gain were optimized, lower levels are needed compared to optimizing feed conversion or maximizing breast meat yield. In the context of market developments towards further processed products the focus on
Criterium Lys, total % of diet Met+Cys, total % of diet Thr, total % of diet
Weight gain 1.10 0.93 0.66
Feed per gain 1.17 1.05 0.68
Breast meat yield 1.21 0.99 0.70
0.40 0.45 0.50 0.55 0.60 0.65 0.70
0.50 0.60 0.70 0.80 0.90 1.00
Thr in the diet (%)
Fe
ed c
o
st
/g
ai
n (
€
/k
g)
0.00 0.05 0.10 0.15 0.20 0.25 0.30 0.35 0.40 0.45 0.50
G
ro
s
s
m
a
rg
in
, (€
/b
ird
)
Arbor Acres Ross 508 Ross 708
Gross margin (GM)
Opt. Thr level, % FC GM 0.70 0.78 0.76 0.82 0.75 0.83
Feed cost/gain (FC)
breast meat yield continuously increases. Moreover, integrated operations in particular have the opportunity to optimize their overall profitability by optimizing their feed formulations which might be at first glance more expensive but at second glance improves overall performance and income. Coming back to the data shown in Table 2, differences between the Australian and Indian specifications might partly be driven because of differing production goals.
4 Feed intake and optimum dietary amino acid levels
Responses to amino acids are a matter of amino acid intake rather than dietary amino acid levels. Therefore, in order to achieve a defined body weight within a given period a certain nutrient intake of the birds should be assured. Any factor decreasing feed intake will reduce nutrient intake and, therefore, impair performance. There are certainly many factors conceivable as feed intake is regulated by physiological feed back mechanisms. For instance, if a diet is deficient in Met+Cys, Lys, Thr, or any other essential amino acid feed intake is reduced. Such a situation characterises an amino acid imbalance and reduced feed intake protects the animal against harm as protein synthesis is limited by the deficient amino acid. All other amino acids exceeding the demand of this limited protein formation have to be degraded because there is no significant amino acid storage in the body. Reduced feed intake, therefore, avoids an overload of the degradation capacity. Abolishing the deficient situation by increasing the deficient amino acid improves the amino acid balance and, thus, protein synthesis and as the animal’s metabolism is discharged, feed intake increases. A logic consequence of this is to find optimum balance between the amino acids – a concept which is known as “Ideal Protein Concept”.
Regarding practical broiler production, there are several important factors influencing feed intake, such as stocking density, lighting program, etc. Other factors are feed form or pellet quality, dietary energy content, and ambient temperature, which will be discussed in the following.
4.1 Effects of feed form and pellet quality on feed intake
There is evidence that feed structure (particle size), feed form and pellet quality affect feed intake and, thus, nutrient intake which in turn affects the performance of the broilers. In most operations broilers are fed with pelleted feed, but due to high production rates and throughput in many feed mills, pellet quality may suffer. Pellet quality is defined by the percentage of fines resulting from breaking or damaging the pellets during transport in pipe systems or on the truck. In this context it can be assumed that many recommendations derived from dose-response trials are underestimated because the experiments were conducted using mash feed.
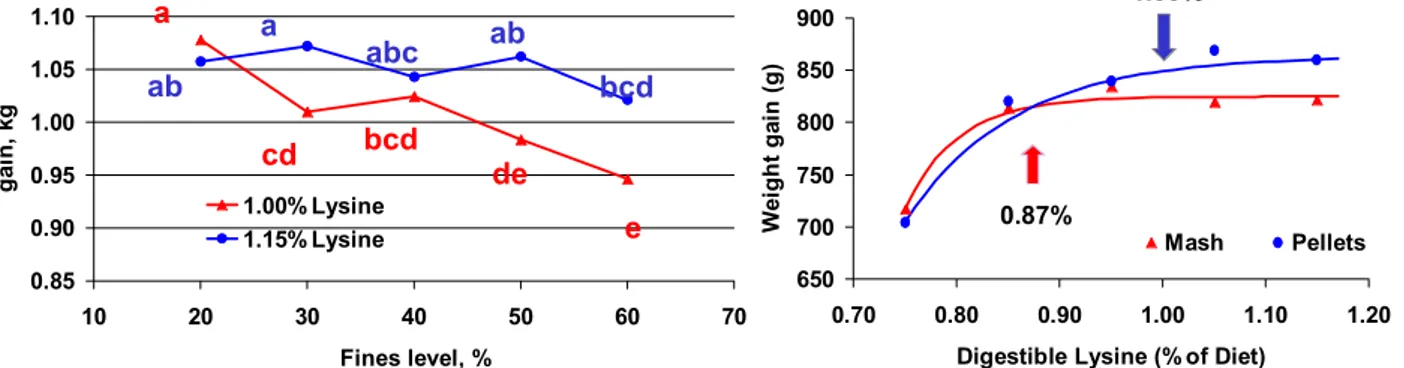
Figure 5: Weight gain performance of growing broilers fed two dietary Lys levels at increasing percentage of fines (left, Greenwood et al., 2004) and responses of growing broilers fed graded dietary Lys levels in mash or pelleted feed (right, Greenwood et al., 2005)
0.85 0.90 0.95 1.00 1.05 1.10
10 20 30 40 50 60 70
Fines level, %
ga
in
, k
g
1.00% Lysine 1.15% Lysine a
cd bcd de
e
ab a
abc ab
bcd
650 700 750 800 850 900
0.70 0.80 0.90 1.00 1.10 1.20 Digestible Lysine (% of Diet)
W
ei
ght ga
in
(g)
Mash Pellets
0.87%
McKinney and Teeter (2004) and Quentin et al. (2004) produced experimental pelleted diets and simulated different pellet qualities with graded proportions of fines (20, 40, 60, 80, and 100 %). A mash diet served as control in the trial by McKinney and Teeter (2004). In both trials the increasing proportion of fines in the diets resulted in impaired feed intake of the finishing broilers and, thus, weight gain. This effect was obvious in slow and fast growing broiler strains (Quentin et al., 2004). With 80 % fines animal performance was almost as low as that of the mash fed birds (McKinney and Teeter, 2004). The latter authors also observed an increasing eating frequency and a decreasing resting frequency with increasing fines proportion. From this finding the authors proposed to account for the higher physical activity by adjusting the dietary energy at poor pellet quality.
Greenwood et al. (2004) conducted a similar trial, in which they produced two series of diets with varying levels of fines (20, 30, 40, 50, 60 %) for 14 to 30 days old male Cobb 500 broilers. One series of diets contained 1.00 % Lys while the other contained 1.15 %. At 20 % fines, performance at both Lys levels was almost identical, but with increasing percentage of fines the difference between treatments of both Lys levels increased (Figure 5, left). Performance at 1.00 % Lys declined stronger than at 1.15 % Lys suggesting an interaction between pellet quality and optimum amino acid level especially at decreased pellet quality.
Another trial reported by the same authors strengthens the hypothesis of an interaction (Beyer and Greenwood, 2004). Graded levels of digestible Lys were fed to 16 to 30 days old male Cobb 500 broilers in mash or pelleted feed (Figure 5, right). Exponential regression analysis of the data suggested a lower optimum digestible Lys level when mash feed is fed compared to the situation with pellets – more evidence for interactions between optimum dietary amino acid levels and feed form.
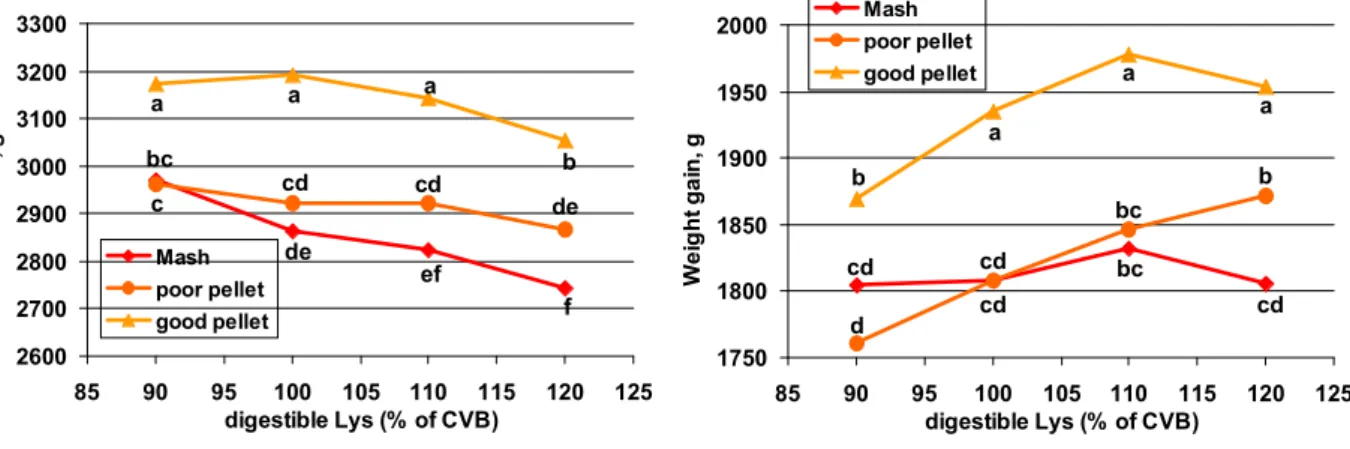
Figure 6: Feed intake (left) and weight gain (right) in growing broilers fed increasing levels of balanced protein expressed as digestible Lys as mash, poor or good quality pellets (Lemme et al., 2006)
Two experiments with increasing levels of balanced protein were designed by Lemme et al. (2006). In this experiment balanced dietary protein was increased in four steps from 90 to 120 % (related to the Dutch CVB recommendations) and fed to 14 to 35 days old male Ross 308 broilers. Diets were either fed as coarse mash, as good quality pellets, or as poor quality pellets. Pellet quality was altered by varying the channel length of the pelleting die in the pellet press.
Birds fed the good pellet quality had considerably higher feed intakes resulting in higher weight gain compared to those fed poor quality pellets or coarse mash feed (Figure 6). Generally, feed intake decreased with increasing balanced protein levels, however, compared to the treatments with poor quality pellets, the decrease was more pronounced in the mash treatments. Whilst birds fed pellets had improved weight gain with increasing balanced protein, there was almost no improvement in mash fed birds. These responses indicate that optimum amino acid levels differ depending on feed form or pellet quality confirming the findings of Greenwood et al. (2004).
2600 2700 2800 2900 3000 3100 3200 3300
85 90 95 100 105 110 115 120 125 digestible Lys (% of CVB)
F
e
ed
in
ta
k
e,
g
Mash poor pellet good pellet
b a
a a
bc
c cd cd de
f ef
de
1750 1800 1850 1900 1950 2000
85 90 95 100 105 110 115 120 125 digestible Lys (% of CVB)
We
ig
ht
ga
in
, g
Mash poor pellet good pellet
b
a
a
a
b
cd cd
cd
bc
bc
Generally, an impaired pellet quality leads to reduced feed intake. As a consequence, balanced dietary amino acid levels should be enhanced in poor quality pellets in order to maintain the amino acid intake. Optimum balance between feed form and amino acid levels may vary depending for example on diet cost, energy costs for pelleting, or revenues per kg live weight or per kg breast meat. Wheat based diets usually result in higher quality pellets whilst pure corn soybean meal feeds produce less stable pellets, with fines often exceeding 50 % when arriving in the feeder.
4.2 Voluntary feed intake is driven by the dietary energy level
Figure 7: Feed intake (left) and feed conversion ratio in (right) in growing broilers fed increasing levels of balanced protein expressed as digestible Lys at low, adequate and high dietary energy (Lemme et al., 2003)
Another well known factor influencing feed intake is the dietary energy content. Lemme et al. (2003) fed increasing levels of balanced protein in diets low, adequate, or high in dietary energy to 14-35 days old male Ross 308 broilers. The trial was designed to produce identical amino acid to energy ratio at each energy level. Increasing dietary energy significantly decreased feed intake (Figure 7). By multiple regression analysis an equation was developed allowing for a prediction of feed intake only on the basis of dietary energy and dietary balance protein (r2=0.97). This indicates that these nutritional factors are mainly responsible for regulating feed intake. Whilst increasing dietary balanced protein levels had only a small effect on feed intake, weight gain was more affected resulting in improved feed conversion with increasing amino acid supply, particularly at low (12.5 MJ or 2980 kcal ME/kg) and adequate (13.2 MJ or 3150 kcal ME/kg) energy supply. Comparing the treatments with equal amino acid to energy ratio revealed that for achieving the same performance optimum amino acid to energy ratio is not identical as sometimes suggested in the literature.
In another trial, experimental diets with increasing levels of balanced protein either at recommended (ROSS Broiler Management Manual, Aviagen, 2002), 5 % decreased, or 10 % decreased energy were fed during the starter (1-10 days), grower (11-32 days) and finisher phase (33-46 days) to male Ross 308 broilers (Lemme et al., 2005). The diets of the 90 % energy treatments did not contain any fat source simulating conditions found in regions where these ingredients are preferentially used for human nutrition. The balanced protein considering Lys, Met+Cys, Thr, Trp, Arg, Ile, and Val was increased from 70 to 100 % of ROSS recommendation.
Feed intake increased non-linearly with increasing amino acid levels (Figure 8). At 70 % amino acids a severe feed wastage was observed which is attributed to the amino acid deficiency in the diets. In these treatments feed intake was lower than feed consumption which should be considered when interpreting the responses. Feed intake increased with dietary energy reduction. Data further suggested that birds were able to compensate the lower dietary energy levels by higher feed intake when energy was reduced by 5 %. A further decrease of the dietary energy to only 90 % of the recommended
2550 2600 2650 2700 2750 2800 2850 2900
10.00 10.50 11.00 11.50 12.00 12.50 13.00 digestible Lys, g/kg
F
e
ed
in
ta
k
e,
g
12.54 MJ ME/kg 13.20 MJ ME/kg 13.84 MJ ME/kg
1.48 1.52 1.56 1.60 1.64 1.68 1.72
10.00 10.50 11.00 11.50 12.00 12.50 13.00 digestible Lys, g/kg
Fe
ed
pe
r
g
ai
n
level apparently exceeded a certain physiological threshold as birds were not able to further increase their feed intake. This resulted in a clearly lower energy intake (Figure 8, right).
Figure 8: Feed intake (left) and energy intake (right) in 1-46 days old broilers fed increasing levels of balanced protein at very low, low, and adequate dietary energy (Lemme et al., 2005)
Weight gain generally increased non-linearly with increasing dietary amino acids (Figure 9). When related to the amino acid intake (Met+Cys taken as reference), all weight gain data points described exactly one response curve (r2=96%). Thus, responses on weight gain and also on breast meat yield (not shown) appeared to be a function of amino acid intake rather or only indirectly of energy intake. Decreasing dietary energy actually improved amino acid intake due to increased feed intake which resulted in improved weight gain. Also this experiment does not confirm the idea of a fixed optimum amino acid to energy ratio. It is rather proposed to reduce dietary amino acids to a lower percentage as the energy in low energy diets.
Figure 9: Weight gain responses of 1-46 days old broilers fed increasing levels of balanced protein at very low, low, and adequate dietary energy plotted against amino acid intake (Met+Cys taken as reference, Lemme et al., 2005)
Two examples for affecting feed intake are given in order to demonstrate that feed intake and, thus, amino acid intake is affected by dietary energy. If there is a need to formulate low energy diets, amino acid levels should be less reduced in order to maintain performance. Coming back to the observed differences in amino acid levels in Australian and Indian feeds, it can be assumed that also the dietary energy played a role. In India, dietary energy is relatively expensive and sometimes not available resulting in low energy diets. As a consequence dietary amino acids are reduced too – and many feed producers in this region learned by experience that amino acids should be reduced to a smaller extent.
5200 5400 5600 5800 6000 6200 6400 6600 6800
65 70 75 80 85 90 95 100 105 AA level, % of Ross recommendation
Fee
d
in
ta
ke
, g
100 % ME 95 % ME 90 % ME
60 65 70 75 80 85
65 70 75 80 85 90 95 100 105 AA level, % of Ross recommendation
E
n
er
g
y
in
ta
k
e,
M
J
M
E
90 % ME 95 % ME 100 % ME
1500 2000 2500 3000 3500 4000
20.0 30.0 40.0 50.0 60.0
Met+Cys intake, g
we
ig
h
t g
a
in
, g
4.3 High ambient temperature affects feed intake
Broilers are increasingly being subjected to environmental temperatures that are above their thermo neutral zone. On the one hand birds grow faster than ever before and, therefore, generate more metabolic heat than previously at any given age. Gous (2004) reported that the comfort temperature of 21.5° C for a male broiler in 1970 decreased to 11.5° C in 2004. On the other hand broiler production is increasingly being introduced in environments with high ambient temperature, where the release of body heat is difficult. Methods are available for reducing the ambient temperature such as insulation, fans, evaporative coolers, reduced stocking density and others. However, in many cases it is not possible to control the temperature in the broiler house effectively. Therefore, reducing the heat load of the broilers through nutritional strategies would be valuable.
The reduction in performance of chicks observed at high temperatures is partly due to a reduced feed intake imposed by the bird’s restricted ability to dissipate heat. To remain in thermal balance, heat production by the broiler must equal its heat loss. The problem at high temperatures is to reduce unnecessary heat production of the bird, otherwise fat deposition increases and feed intake declines. The amount of heat produced by a boiler is related to its body size, growth rate, degree of feather cover and other effects.
One strategy for maintaining nutrient intake could be an increased density of diets. However, increasing the energy content while maintaining the amino acid to energy ratio is not effective in combating heat stress in broilers (Gous, 2004). This is in contrast to laying hens. A 1.8 kg broiler consumes twice the amount of energy consumed by a laying hen of the same body weight. The amount of energy that a boiler needs to lose as heat to the environment is more than a laying hen consumes each day. That explains, why broilers suffer more than layers at high temperature and why boilers cannot benefit to the same extent as the hen from a high-density diet under high temperature.
Since feed intake is driven by dietary energy, a variation of the amino acid to energy ratio might be a strategy. Trials by Wijtten et al. (2004a,b) and Lemme et al. (2006) conducted under optimum temperature regimes revealed that increasing levels of a balanced protein to high levels at unchanged dietary energy consistently improved weight gain. In most cases feed intake decreased with balanced protein levels particularly at higher than recommended levels which resulted always in significant linear improvements in feed conversion. However, research reviewed by Gous (2004) suggested that also this approach is not successful to avoid performance depression under heat stress. The explanation is that under heat conditions birds are not able to get rid of additional heat which is mainly accompanied with protein synthesis (McLoud, 1997).
Nutritional strategies involving adjustments on the amino acid side are not successful to compensate for a reduced feed intake and, thus, performance under heat stress conditions. All approaches like increasing the amino acid (balanced protein) to energy ratio or improving the amino acid balance in general might be of benefit to a certain extent – but such strategies should also be applied under thermo neutral conditions.
5 Summary
• Checking diet specifications on a regular basis is a key issue in profitable broiler production.
• Statistical evaluation of 2001-2006 AMINOLab®data reveals changes in feed formulation over recent years and potential imbalances which may increase production costs.
• Continuous improvement in broiler genetics requires regular evaluation of nutrient specifications in raw materials as well as in compound feeds to exploit the genetic potential.
• Careful adaptation of diet specifications regarding climate (high temperature), production manage-ment (split sex or as hatched) and production goal (target body weight, cut ups vs. whole carcass) is essential.
• The new QuickChick software tool from Degussa supports dynamic decision making concerning the above topics.
7 References
2Gous, R. M. (2004) Nutritional interventions in alleviating the effects of high temperatures in broiler production. Proceedings 22nd World’s Poultry Congress, Istanbul, Turkey.
Greenwood, M. W., P. M. Clark and R. S. Beyer (2004) Effect of feed fines level on broilers fed two concentrations of dietary lysine form 14 to 30 days of age. International Journal of Poultry Science 3: 446-449.
Greenwood, M. W., K. R. Cramer, R. S. Beyer, P. M. Clark and K. C. Behnke (2005) Influence of feed form on estimated digestible lysine needs of male broilers from sixteen to thirty days of age. Journal of Applied Poultry Research 14: 130-135.
Havenstein, G. B., P. R. Ferket and M.A. Qureshi (2003a) Growth, livability, and feed conversion of 1957 versus 2001 broilers when fed representative 1957 and 2001 broiler diets. Poultry Science 82: 1500-1508.
Havenstein, G. B., P. R Ferket and M. A. Qureshi (2003b) Carcass composition and yield of 1957 versus 2001 broilers when fed representative 1957 and 2001 broiler diets. Poultry Science 82: 1509-1518.
Kidd, M. T., A. Corzo, D. Hoehler, B. J. Kerr, S. J. Barber and S. L. Branton (2004) Threonine needs of broiler chickens with different growth rates. Poultry Sci. 83: 1368-1375.
Lemme, A., J. Tossenberger, and A. Petri (2003a) Impact of dietary methionine on uniformity in broiler production, Proceedings 14th European Symposium on Poultry Nutrition, Lillehammer, Norway.
Lemme, A., P. J. A. Wijtten, D. J. Langhout and A. Petri (2003b) Interactions between ideal protein and dietary energy in growing broiler chicken. Proceedings 14th European Symposium on Poultry Nutrition, Lillehammer, Norway.
Lemme, A., M. T. Kidd, D. Hoehler and A. Petri (2004) Responses of various broiler strains to graded levels of dietary threonine. Proceedings 22nd World’s Poultry Congress, Istanbul, Turkey.
Lemme, A., C. Kemp, C. Fisher, M. Kenny and A. Petri (2005) Responses of growing broilers to varying dietary energy and balanced amino acid levels. Proceedings 15th European Symposium on Poultry Nutrition, Balatonfüred, Hungary.
Lemme, A., P. J. A. Wijtten, J. van Wichen, A. Petri, and D. J. Langhout (2006) Responses of male growing broilers to increasing levels of balanced protein offered as coarse mash or pellets of varying quality. Poultry Science 85: 721-730.
Mack, S., D. Bercovici, G. de Groote, B. Leclercq, M. Lippens, M. Pack, J. B. Schutte and S. van Cauwenberghe (1999) Ideal amino acid profile and dietary lysine specification for broiler chickens of 20 to 40 days of age. British Poultry Science 40: 257-265.
MacLeod, M. G. (1997) Effects of amino acid balance and energy: protein ratio on energy and nitrogen metabolism in male broiler chickens. British Poultry Science 38: 405-411.
McKay, J. C., N. F. Barton, A. N. M. Koerhuis and J. McAdam (2000) The challenge of genetic change in the broiler chicken. Occasional Publication of the British Society of Animal Science 27: 1-7.
McKinney, L. J. and R. G. Teeter (2004) Predicting effective caloric value of nonnutritive factors: I. Pellet quality and II. Prediction of consequential formulation dead zones. Poultry Science 83: 1165-1174.
Pack, M., D. Hoehler, and A. Lemme, 2003, Economic assessment of amino acid responses in growing poultry. in: Amino acids in animal nutrition – 2nd edition, ed. J. P.F. D’Mello, CAB International, Wallingford, UK, pp. 459-483.
Quentin, M., I. Bouvarel, and M. Picard, 2004, Short- and long-term effects of feed form on fast- and slow-growing broilers. Journal of Applied Poultry Research 13: 540-548.
Sklan, D. and Y. Noy, 2003, Crude protein and essential amino acid requirements in chicks during the first week posthatch. British Poultry Science 44: 266-274.
Vieira, S. L., A. Lemme, D. B. Goldenberg and I. Brugalli (2004) Responses of growing broilers to diets with increased sulfur amino acids to lysine ratios at two dietary protein levels. Poultry Science 83: 1307-1313.
Wijtten, P. J. A., R. Prak, A. Lemme and D. J. Langhout (2004a) Effect of different dietary ideal protein concentrations on broiler performance. British Poultry Science 45: 504-511.
Wijjten, P. J. A., A. Lemme. and D. J. Langhout (2004b) Effects of different dietary ideal protein levels on male and female broiler performance during different phases of life: single phase effects, carryover effects and interactions between phases. Poultry Sci. 83:2005-2015.
Corresponding author:andreas.lemme@degussa.com