i
VIETNAM NATIONAL UNIVERSITY – HO CHI MINH CITY INTERNATIONAL UNIVERSITY
SCHOOL OF BUSINESS
IDENTIFYING FACTORS AFFECTING THE LEVEL
OF IMPULSE BUYING IN FASHION MALLS
IN HO CHI MINH CITY
In Partial Fulfillment of the Requirements of the Degree of
BACHELOR OF ARTS in BUSINESS ADMINISTRATION
Student’s name:
TA BAO TRAN (BABAIU11081)
Advisor:
BUI QUANG THONG, Ph.D.
Ho Chi Minh City, Vietnam
ii
IDENTIFYING FACTORS AFFECTING THE LEVEL
OF IMPULSE BUYING IN FASHION MALLS
IN HO CHI MINH CITY
APPROVED BY: Advisor
APPROVED BY: Committee
_____________________
Bui Quang Thong, Ph.D
_______________________
Nguyen Minh Tuan, MBA
________________________
Le Nhat Hanh, Ph.D
________________________
Nguyen Ngoc Duy Phuong, Ph.D
iii
ACKNOWLEDGEMENT
irst and foremost, it is a pleasure to express my sincere gratitude to many people who made this thesis possible. I wish to give my deepest gratitude and appreciation to my profound advisor, Dr. Bui Quang Thong, for his continuous support and encouragement. This thesis would not have been completed without his help. Throughout my thesis-writing period, he encouraged me whenever I encounter problems with careful and inspiring advice, good teaching and lots of interesting ideas. His extensive knowledge in marketing as well as deep understanding in business research has given me invaluable experience in conducting scientific study in marketing field. Especially in the data analysis, thanks to his useful tutorials and recommendations, I had overcome the difficulties of statistic process and software. In short, it is an honor for me to be instructed by Dr. Bui Quang Thong who never accepted less than my best efforts.
Additionally, I would like to thank Dr. Le Van Chon for supporting me in raising the thesis’s topic and widening useful knowledge through the Business Research Method course. His instructions and advices are valuable to me.
My gratitude also goes to all professors in International University, especially professors and staffs in School of Business Administration, who always do their best to make all thesis procedures as convenient to students as possible.
A word of appreciation must go out to all of my close friends who aided and supported me during the time conducting this thesis, Mr. Le Minh Khoa, Mr. Nguyen Trung Hung, Ms. Banh Ngoc Nhu and Ms. Nguyen Phuong Hoang Cuc. Without their cooperation, I could not have accomplished my thesis.
Last but not least, I am appreciate to those who spent time on spreading and completing my questionnaire. Their responses are the valuable information and big encouragement for me in private and for those who want to have further investigation in this research topic in general.
iv
Finally, my beloved family deserves a special mention for their unconditional love and support throughout the whole research study.
To all of them, I dedicate this thesis.
v
Table of Contents
ACKNOWLEDGEMENT ... III
LIST OF TABLES ... VIII
LIST OF FIGURES ... X
ABSTRACT ... XI
ABBREVIATIONS ... XIII
CHAPTER I ... 14
1.1.RESEARCH BACKGROUND ... 14
1.2.RESEARCH OBJECTIVES ... 17
1.3.RESEARCH QUESTIONS ... 17
1.4.SIGNIFICANCES OF THE RESEARCH ... 18
1.5.RESEARCH SCOPE AND LIMITATIONS ... 19
1.5.1. Research scope ... 19
1.5.2. Research limitations ... 19
1.6.RESEARCH STRUCTURE ... 19
1.7.THESIS TIMELINE ... 20
CHAPTER II ... 22
2.1.DEFINITION OF TERMS ... 22
2.1.1. Optimum Stimulation Level ... 22
2.1.2. Hedonic Purchase ... 23
2.1.3. Consumer’s Need for Uniqueness ... 23
2.1.4. Novelty- Fashion Consciousness ... 26
2.1.5. Consumers Self- Spending Control ... 26
2.1.6. Level of Impulse Buying ... 27
2.2.RESEARCH HYPOTHESES ... 28
2.2.1. Relationship between Optimum Stimulation Level and Level of Impulse Buying ... 28
2.2.2. Relationship between Hedonic Purchase and Level of Impulse Buying ... 28
2.2.3. Relationship between Consumer’s Need for Uniqueness and Level of Impulse Buying .... 29
2.2.4. Relationship between Novelty – Fashion Consciousness and Level of Impulse Buying .... 30
2.2.5. Relationship between Consumer Self-Spending Control and Level of Impulse Buying ... 30
2.3.RESEARCH MODEL ... 32
CHAPTER III... 34
3.1.NATURE OF THE RESEARCH ... 34
3.2.RESEARCH METHOD ... 34
3.3.DATA COLLECTION METHOD ... 36
3.4.RESEARCH DESIGN ... 36
3.5.SAMPLING DESIGN ... 38
3.5.1. Sample Size ... 38
3.5.2 Sampling Technique ... 38
vi
3.6.QUESTIONNAIRE DESIGN ... 39
3.7.PILOT STUDY ... 44
3.8.DATA COLLECTION PROCEDURE ... 44
3.9.DATA ANALYSIS METHOD ... 46
CHAPTER IV ... 48
4.1.SAMPLE DEMOGRAPHIC ... 48
4.1.1. Response Rate ... 48
4.1.2. Demographic Analysis ... 48
4.1.2.1. Gender ... 49
4.1.2.2. Age ... 50
4.1.2.3. Occupation ... 51
4.1.2.4. Income ... 52
4.2.DESCRIPTIVE STATISTICS ... 52
4.2.1. Descriptive Statistics of Optimal Stimulation Level ... 53
4.2.2. Descriptive Statistics of Hedonic Purchase ... 53
4.2.3. Descriptive Statistics of Consumer’s Need for Uniqueness (in sub -dimensions) ... 54
4.2.4. Descriptive Statistics of Novelty – Fashion Consciousness ... 56
4.2.5. Descriptive Statistics of Consumer Self-Spending Control ... 57
4.2.6. Descriptive Statistics of Level of Impulse Buying ... 58
4.3.EXPLORATORY FACTOR ANALYSIS (EFA) ... 59
4.3.1. Reliability Analysis... 59
4.3.2. Factor Analysis ... 64
4.3.2.1 EFA for Independent Variables ... 65
4.3.2.2 EFA for Dependent Variable ... 68
4.4.DETECTING MULTIVARIATE OUTLIERS ... 70
4.5.CONFIRMATORY FACTOR ANALYSIS (CFA) ... 73
4.5.1. Check for Model fit... 76
4.5.2. Check Convergent Validity ... 83
4.5.3. Check Reliability ... 86
4.5.4. Check Discriminant Validity ... 89
4.6.STRUCTURAL EQUATION MODELING (SEM) ... 90
4.6.1. Check for Model Fit ... 92
4.6.2. Hypotheses Testing in SEM ... 107
4.6.3. Revised Research Model ... 108
CHAPTER V ... 111
5.1.CONCLUSION ... 111
5.2.1. Recommendations for Retailing Strategies ... 113
5.2.2. Recommendations for Future Research Study ... 114
5.3.LIMITATIONS ... 115
REFERENCES ... 117
APPENDIX A ... 127
QUESTIONNAIRE IN ENGLISH ... 127
vii
APPENDIX B ... 135
APPENDIX C ... 141
APPENDIX D ... 143
viii
LIST OF TABLES
Table 1: Research Timeline ... 21
Table 2: Measurement Items for the Research Model ... 40
Table 3: Valid Response Rate ... 48
Table 4: Demographic Information ... 48
Table 5: Descriptive Statistics of Optimum Stimulation Level ... 53
Table 6: Descriptive Statistics of Hedonic Purchase ... 53
Table 7: Descriptive Statistics of Consumer's Need for Uniqueness's sub-dimensions ... 55
Table 8: Descriptive Statistics of Novelty-Fashion Consciousness ... 56
Table 9: Descriptive Statistics of Consumer Self-Spending Control ... 57
Table 10: Descriptive Statistics of Level of Impulse Buying ... 58
Table 11: Rules of Thumb for Evaluating Cronbach's Alpha ... 59
Table 12: Corrected Item-to-Total Correlation and Cronbach's Alpha (First Round) ... 60
Table 13: Rotated Component Matrix of Independent Variables ... 65
Table 14: KMO and Barlett's Test of Independent Variables ... 67
Table 15: Total Variances Explained of Independent Variables ... 68
Table 16: Component Matrix of Dependent Variable ... 69
Table 17: KMO and Bartlett’s Test of Dependent Variable ... 69
Table 18: Total Variance Explained of Dependent Variable ... 69
Table 19: Observations Farthest from the Centroid (Mahalanobis Distance) ... 70
Table 20: Criteria for Measurement Model ... 74
Table 21: Model Fit of CFA (First Round) ... 76
Table 22: Modification Indices Value and Questionnaire Per Items ... 78
ix
Table 24: Regression Weights: (Group number-Default model) ... 84
Table 25: Standardized Regression Weights ... 85
Table 26: Composite Reliability and Extracted Variance of Each Factor ... 87
Table 27: Correlations (CFA) ... 89
Table 28: Model Fit of SEM (First Round) ... 92
Table 29: Regression Weights of SEM Testing: (Group number 1-Default Model) (First Round)... 92
Table 30: Covariance: (Group number 1-Default model) (First Round) ... 95
Table 31: Model Fit of SEM (Second Round) ... 100
Table 32: Covariances (Group number 1: Default model) (Second Round) ... 101
Table 33: Regression Weights of SEM Testing (Group number 1-Default) (Second Round)... 101
Table 34: Regression Weights of SEM Testing (Group number 1-Default model) (Third Round)... 103
Table 35: Model Fit of SEM (Third Round) ... 106
Table 36: Covariances: (Group number 1-Default model) (Third Round) ... 106
Table 37: Standardized Regression Weights ... 107
x
LIST OF FIGURES
Figure 1: Vietnam GDP Per Capita from 2006 to 2014... 15
Figure 2: Research Model ... 32
Figure 3: Main Steps of Research Design... 37
Figure 4: Gender Percentage ... 49
Figure 5: Age Group Percentage ... 50
Figure 6: Occupation Percentage ... 51
Figure 7: Income Percentage ... 52
Figure 8: First Measurement Standardized Modelling ... 76
Figure 9: Final Measurement Standardized Modelling ... 83
Figure 10: First Structural Equation Model ... 91
Figure 11: Second Structural Equation Model... 99
Figure 12: Final Structural Equation Model ... 105
xi
ABSTRACT
xii
field of marketing activities. Thus, the objective of this research is not out of investigating factors affecting level of impulse buying, which not only examines new intrinsic variables influencing on impulse purchase but also check their level of effect.
In this study, to measure the level of impulse buying of factors, a research study was formed and presented clearly in the methodology chapter. Target populations are those living in Ho Chi Minh City and did make impulse purchases in the past or at the time they were asked. In general speaking, data was collected from 355 respondents in total by questionnaires at some famous fashion malls in Ho Chi Minh City as well as other offline and online channels which will be well discussed later. The findings of the data were assessed in terms of the level of effect on impulse buying of factors compared to those conducted in many previous research papers. Although the research study hypothesized five independent factors causing influences on impulse buying, which were optimum stimulation level, hedonic purchase, consumer’s need for uniqueness, consumer’s self-spending control as well as novelty-fashion consciousness, however, it was found that only optimum stimulation level, hedonic purchase and consumer’s need for uniqueness had positive impact on the level of impulse buying while consumer’s self – spending control was pointed out having negative effect on the dependent factor. Novelty-fashion consciousness was explored to have no impact on impulse buying as concluded by the result from data analysis.
Thus, it will be much valuable for both overseas and local fashion brands/ retails to implement the results and turn into practical marketing activities to attract more impulse buyers. Besides, it also useful for the researchers to develop the theoretical frameworks and replicate in other industries.
Key words: impulse buying, impulsiveness, consumer behavior, fashion
brands, retailing, hedonic consumption, optimum stimulation, novelty-fashion consciousness, consumer’s need for uniqueness, consumer self –spending control.
xiii
ABBREVIATIONS
AVE: Average Variance Extracted CFA: Confirmatory Factor Analysis CNFU: Consumer’s Need for Uniqueness CSSC: Consumer Self-Spending Control CSI: Consumer Style Inventory
EFA: Exploratory Factor Analysis HP: Hedonic Purchase
IB: Impulse Buying
14
CHAPTER I
INTRODUCTION
This chapter provides information about the rationale of this paper. From that
background, research problems are stated and research objectives are set in order to
solve such problems. Furthermore, scope and limitations as well as implications of this
study are discussed. Lastly, the overall structured of the whole research has been taken
into consideration.
1.1. Research Background
Shopping has long been explored as an endless demand for human being, which was proved that can bring the joyfulness as well as satisfaction for the buyers. Thus, it is commonly understand that people are easily to fall into impulse purchase when they do not even tend to buy these products, or do not need as a must-have-item in the shopping list. Most of them only recognized how overspending they were when they went home, however, they may continuously made spontaneous decisions many times later when seasons sales came or new collections arrived. It has been reported that the number of shopaholics is increasing remarkably in developed countries, especially women, and most of them are called as slaves to fashion and debt. (Moussa, 2007). Nevertheless, under the point of view of fashion brands/ retailers, it is a good news due to the growing sales when more and more people are impulse buyers.
15
purchase takes a percentage of 80% among consumers buying behavior. (Smith, 1996; Abraham, 1997). This denotes that impulse buying has strong effects on consumer behavior, which is worth to be conducted in research paper in every aspects.
However, most research paper conducted has origin from developed countries such as United States, the United Kingdom (McConatha, Lightner, and Deaner, 1994; Dittmar, Beattie, and Friese 1995; Bayley and Nancarrow, 1998) and Singapore as Shamdasani and Rook (1989). Almost no previous research study about impulse buying has empirically examined in developing countries before, thus, this study is conducted in Vietnam – the promising developing countries to find out the level of impact of factors on impulse buying, then give implications managements for both local and international firms.
As reported in 2014, Vietnam has a population of over 90 million, which ranked 14th in the list of countries by population. Besides, Vietnam has higher population
density in urban areas, especially in big cities such as Ho Chi Minh City, Ha Noi or Da Nang. (Statistics reported from General Statistics Office of Vietnam). Furthermore, GDP
per capita kept increasing steadily with the latest record around US $1,030 in 2014.
16
(Sources: www. tradingeconomics.com)
As reported by Vietnam General Statistics Office, in 2014, GDP per capita of Vietnam reached to US $1,030. Furthermore, total personal disposable income of Vietnam was US$127 billion in 2013. Next, the total consuming volume of Vietnamese consumers was about US$111 billion in the same year (Deloitte). Continuously reported by Deloitte, Vietnam’s retail sales, which already reached to US$53.9 billion in 2011 in total volume, is forecasted to grow up to 109 billion USD in 2017. Especially Ho Chi Minh City – the most dynamic city as well as the economic central of Vietnam, had the retail’s sales up to US$28.9 billion in 2013 (cited by Deloitte in Retail in Vietnam, Emerging Market, and emerging growth).
Since Vietnam’s retailing industry was ranked at 14th out of 30 countries, it can be said in confidence that Vietnam is worth to be invested and conducted many researches on consumer behavior. Thus, Ho Chi Minh City, especially fashion malls in this city, were chosen as sampling locations to conduct this research paper. Ho Chi Minh City is not only the most dynamic city of Vietnam but also the economic central, accordingly, impulse buying is expected to occur in these potential locations. In particular, the underlying purpose of this research is to explore more stimuli behind the decisions of buying spontaneous within a physical shopping circumstances like fashion malls in Ho Chi Minh City.
17
2011, the largest categories in Vietnam clothing market are women outerwear and footwear, which is highlighted for the development in this type of clothing products. (Cited by Euromonitor, “Vietnamese consumers find their passions for fashion).
The study’s conclusion can be useful for marketing practitioners and merchandisers in improving the sales of clothing products in fashion malls by implementing the advantages of impulse buying. However, it should be taken into consideration since the increasing sales from impulse purchasing will harm to consumers’ financial budgets and cause negative consequences in post-purchase feelings, social responses as well as decrease overall self-esteem. (Rook 1987; Rook and Hoch 1985).
1.2. Research Objectives
The purpose of this study, as mentioned above, is to investigate how optimum stimulation level, hedonic purchase, consumer’s need for uniqueness, novelty – fashion consciousness and consumer self-spending – control affect the level of impulse buying in fashion malls. Thus, to achieve this goal, the research objectives are stated as follows:
- Identifying factors affecting the level of impulse buying in fashion malls in Ho Chi Minh City.
- Examining the level of influence of each factor on the level of impulse buying in fashion malls.
- Providing practical recommendations for fashion brands and retailers in increasing impulse purchase behavior of consumers, especially those living in Ho Chi Minh City.
1.3. Research Questions
To reach the research objectives, the questions were formed as below:
- What are factors that affect the level of impulse buying in fashion malls in Ho Chi Minh City?
18
- What aspects of fashion brands or retailers need to be improved to increase the level of impulse purchase of consumers?
1.4. Significances of the Research
Although there has many researchers conducted research about impulse buying behavior and the factors affecting on this consumer behavior, in developing countries, the research studies are hard to be found. In other words, the level of impulse buying and the factors affecting on this level has never been conducted before in an official way in developing countries, or Vietnam market in particular. Thus, this study aims to provide supports for the value of measuring the level of impulse buying in fashion malls with clothing products.
The outcome of the research would provide manager and researcher a conceptual framework to describe the relationships between the level of impulse and variety seeking and the factors affecting on them. Thanks to that, business owners in fashion industry can be able to target at the right customers and link these factors with their present business situation in order to revise their current marketing strategies and plans for better improvement.
Besides, the scientific recommendations from this research are well discussed and this can be used as a good solution for the business owners on the way of reaching the business’s objectives. Last but not least, thanks to this study, the business owners can understand the level of influence that each factor contributes to the level of impulse buying. Therefore, they can focus on the factors which have the greatest influences to the level of impulse purchase in order to increase sales and develop their businesses and utilize their resources in the most effective way.
19
1.5. Research Scope and Limitations
1.5.1. Research scope
Ho Chi Minh City was chosen to be a scope of this research paper thanks to its convenience and higher rate of impulse buyers. Ho Chi Minh City is not only the economic center of Vietnam but also is the most modern and dynamic city. Besides, it has lots of shopping malls and famous fashion brands to attract a huge of impulse buyers every day. Thus, it was believed to have a good sample size which suitable with the research’s purpose. In short, the paper mainly focuses on consumers having impulse purchase toward clothing products as perceived by people in Ho Chi Minh City.
1.5.2. Research limitations
The major limitation of this study was the undiversified sample – not a representative population due to the limited geographic accessibility capacity (All surveys were delivered and collected around Ho Chi Minh City). Therefore, the result of the study only helped explain partly the concept of impulse buying and its factors.
1.6. Research Structure
The study was designed with five main parts placed in five chapters as following:
Chapter I: Introduction
This chapter will explain why it is necessary to conduct this paper. Moreover, the introduction also provides the overall background, research objectives and research questions, research scope and limitations as well as the structure of this study.
Chapter II: Literature Review
The second chapter mainly focuses on reviewing the important concepts, definitions used and previous researches associated with the problem addressed in this study. Most importantly, the theoretical framework and hypotheses are proposed in this chapter based on the research questions.
20
This chapter gives the detailed information about the research process, research design and research procedure as well as data analysis. Besides, the criteria for selecting research sample and data collecting process are provided. Additionally, chapter 3 shows the questionnaire items in details as well as describes the survey development. The statistical SPSS programs used in the research study is also mentioned and discussed.
Chapter IV: Data Analysis and Findings
Chapter 4 will provide the research results of the data analysis obtained from the collected data through the main surveys. Besides, this chapter aims to give clear explanation and recommendation of the statistic numbers as well as present the results of the proposed research model after being tested.
Chapter V: Conclusion and Recommendations
The final chapter will summarize the findings, offer the discussion for practical implications as well as give recommendation for further research. Lastly, the limitation of the study is also provided.
1.7. Thesis Timeline
21
Table 1: Research Timeline
No Activities
10 Nov 19 De
c
26
Jan
30 Jan 08
– 14 Fe b 0 1 –22 M ar 29 M ar 30 M ar 7 Apr 18 M ay
1 Register for thesis topic
2 Apply for approval
3 Oral defense for thesis proposal
4 Design questionnaire
5 Pilot test for questionnaire
6 Distribute and collect questionnaires
7 Mid way report
8 Collect data and start analyzing
9 Write thesis
22
CHAPTER II
LITERATURE REVIEW
In this chapter, 5 hypotheses are proposed. The first four hypotheses concern direct
impacts of optimum stimulation level, hedonic purchase, consumer’s need for uniqueness
and novelty – fashion consciousness respectively on the level of impulse buying. The final
hypothesis proposes the negative relationship between the consumer self-spending –
control and the level of impulse buying.
2.1. Definition of Terms
2.1.1. Optimum Stimulation Level
23
having common classification, (Menon & Kahn, 1995) and those products and services are put on use creatively (Mittelstaedt et al., 1976; Raju, 1980).
2.1.2. Hedonic Purchase
According to Bhatnagar (2004), hedonic purchase refers to “emotional needs of individuals for enjoyable and interesting shopping experiences”. As discussed by Holbrook & Hirschman (1982), hedonic buying motive relates to emotional arousal, which happens while carrying out purchasing process. In other words, hedonic purchase occurs in a high-involvement situation, where any single individual has a deep fall into a consumption event (Hopkinson & Pujari, 1999). For example, shoes’ consumers with higher hedonic purchase level will have interest in tracking shoes’ sales off event more often than normal consumers. Therefore, the changing levels of involvement have a positive influence on the level of hedonic purchase. The level of hedonic purchase is estimated to be higher in high – involvement consumption situations and vice versa.
2.1.3. Consumer’s Need for Uniqueness
24
Santee, 1985), or the domains of knowledge in which they initiate competence (Holt, 1995). They are probable to be dissimilar in their ways to fulfill their uniqueness aspiration through consumer behaviors and possessions.
Based on the previous research on need for uniqueness and the nonconformity in consumer behavior, the conceptualization of consumer’s need for uniqueness is divided into three behavioral dimensions. Each will be defined in turn as follows.
Creative Choice Counter -Conformity.
Creative choice counter-conformity demonstrates consumers’ attempt to pursue the distinction from most others, however, these selections made by one consumer can be contemplated as a good decision by others (Tian, et al., 2001). As explained by Knight. & Kim (2007), in creative choice counter -conformity, goods are purchased by consumers must be unique and approved by most of people in society in order to express consumers’ uniqueness. Accordingly, brand names that satisfy this type of consumer must have some distinguishing characteristics such as exclusiveness, prestige and unique features.
For example, limited edition of Gucci’s hand bags is one kind of product that not only expresses the exclusiveness, prestige but also the uniqueness since these hand bags of Gucci are produced with very limited items. Besides, Gucci is one of the most famous fashion brands all over the world which was known for hundred years, thus, their products can satisfy the need of being praised by most of people of those having creative choice counter-conformity. In short, people who want to be unique and recognized by society for their choices will tend to buy products with limited edition but still luxury and good looking under the view of others.
Unpopular Choice Counter -Conformity.
25
unique in this way. In comparison to the aspect of creative choice counter-conformity, unpopular counter- conformity may terminate in a common image and encourage the improvement of self-concept. In short, people following this type of uniqueness are considered as rules breakers. However, according to Heckert (1989), through times, such choices can gain social approval and individuals who used to be viewed as “rules breakers” before can now become fashion leaders. In other words, it cost a lot of time for these individuals to be viewed as “fashionista” and be recognized by society that they are not that weird. Thus, according to Simonson & Nowlis (2000), these consumers are not worried about others’ criticism; in fact; the most concerns them is to make purchase decisions that might be viewed as bizarre from others.
For example, blue jeans – one kind of clothes that are too famous for not only young people but also for the whole fashion industry and society, used to be viewed as “abnormal clothing” in the 19 century. At that time, people who wore jeans to seek for new image and enhance self-concept were easily considered as weird people. Until later of 1990s, jeans were recognized by most of people, especially celebrities, jeans became famous and those wore jeans before had become fashion leaders.
Avoidance of Similarity.
Avoidance of similarity refers to individual’s effort to avoid the similarity by losing interest and discontinue using popular products. In other words, avoiding similarity also involves with the devaluation and avoidance of some kinds of products or brand that are considered to be well – recognized. However, since the consumer’s success in trying to differentiate themselves to others by creating distinctive self-images and social images doesn’t last long, they tend to discontinue to use or purchase products which can cause the similarity. Therefore, these individuals tend to purchase goods that are not widely accepted by most of people, and able to distinguish them from others. (Knight. & Kim, 2007).
26
others. Besides, they may stop using products that were widely used by many people. In summary, different from creative choice conformity and unpopular choice conformity, these kinds of customers are not trying to be unique in an outstanding way that can make people remember them longer than others or call them as fashion leaders, the only thing they need is to be different from others by using non-popular products or stop using products that is becoming popular.
2.1.4. Novelty- Fashion Consciousness
Consumer Style Inventory (CSI) was conceptualized by Sproles and Kendall (1986), which is an early effort to systematically measure shopping orientations by applying decision-making orientations. It was originally contained 50 items to measure the general customer’s orientations towards shopping, and later, thanks to Sproles and Kendall, the CSI was developed in a short-form scale with 40 items which validated from a sample of US high school students. Novelty – fashion consciousness is one in eight dimensions, together with Perfectionism (high-quality consciousness), Brand consciousness, Recreational (hedonistic shopping consciousness), Price consciousness, Impulsiveness and Confusion from over choice. As defined by Sproles and Kendall (1986), Novelty -Fashion Consciousness (NFC) is a characteristic that describes individuals who are fashionable with novelty conscious and love to experience new things. These customers always seek for new fashions and fads with excitement and pleasure. For them, it is necessary to be up-to-date with styles and be trendy.
2.1.5. Consumers Self- Spending Control
27
finds difficulties in regulate spending while another person with average self-control could become an extremely well-managed financial. That can only be explained in the way consumers’ decision on self-allocating their financial budget.
2.1.6. Level of Impulse Buying
Early marketing literature defined impulse buying in a simple way as unplanned purchasing (Cobb and Hoyer, 1986). However, as discussed by Rook (1987), impulse buying occurs when “a consumer experiences a sudden, often powerful and persistent urge to buy something immediately”. In other words, impulse buying can be understood as an immediate and sudden purchase behavior with no thoughtful or future implications before. Also, impulse buyers are claimed to have unreflective thinking, which is “prompted by physical proximity to a desired product, dominated by emotional attraction to it, and absorbed by the promise of immediate gratification”. (Hoch and Loewenstein, 1991; Thompson, Locander, and Pollio, 1990). Therefore, these kinds of consumers are likely to act without carefully hesitation in mind and have quick response to their impulse purchase. In negative speaking, impulse buying can be almost entirely driven by stimulus, which is translated directly into an unconditional response.
28
2.2. Research Hypotheses
2.2.1. Relationship between Optimum Stimulation Level and Level of Impulse
Buying
As discussed by Raju, (1980), Steenkamp and Baumgartner (1992), individuals with high Optimum Stimulation Level (OSL) have lower arousal level which encourages them to seek for activities in order to reach their desired stimulation level. Thus, individuals having low arousal level will tend to have indulgence in impulse buying since the extra stimulation that high OSL individuals need to achieve their OSL would be provided. It is consistent with the general theory of Eysenck (1993) that inconsiderate, impatient, risk-taking, sensation-seeking and pleasure seeking are some attributes that describes an individual with low arousal level (Dickman, 2000). Lastly, almost all of the purchasers’ characteristics related to impulse buying or optimum stimulation level (Baumgartner and Steenkamp, 1996) are likely to derive from isolated personal attribute defined as impulsivity (Eysenck, 1993) or impulsive sensation seeking (Zuckerman, 1993).
Therefore, this research expects OSL to have a great impact on impulse buying, which means individuals with higher OSL will have higher possibility of falling into impulse purchase. A review of relative literature led to the subsequent hypothesis:
H1: Optimum Stimulation Level has significant positive influence on
Level of Impulse Buying.
2.2.2. Relationship between Hedonic Purchase and Level of Impulse Buying
29
Based upon the different description, we conclude that impulse buying involves hedonic purchase decisions which are made inside a store and excludes the reminder purchasing activities. Besides, research by Beatty and Ferrell (1998) demonstrates that impulse purchasing is incorporated with sensory stimulation and hedonic motivation. Recently, as suggested by Yu and Bastin (2010), shopping value of a person result in impulse purchase and are inseparably associate with each other. Thus, thanks to the support from relevant literature, we suggest the hypothesis as follows:
H2: Hedonic Purchase has significant positive influence on Level of
Impulse Buying.
2.2.3. Relationship between Consumer’s Need for Uniqueness and Level of
Impulse Buying
As Tian et al. (2001), “Consumer’s need for uniqueness (CNFU) allows individuals to enjoy improved self- and social-image”. Besides, “consumers’ image is enhanced internally and externally through the use of products when they recognize some symbolic meanings in these products” (Tian and Mckenzie, 2001). Moreover, as cited by Dee& Eun Young (2007), new products or brands can be acquired more rapidly by purchasers, who have greater demand of distinction, comparing with those who have that demand at a lower level. This means that these kinds of customers do not hesitate to spend money on seeking items which can differentiate them from others. Since it may cost lots of time to find stuffs with unique features, these customers may fall into impulse purchase whenever they find suitable accessories that best suit for their clothes. Besides, people with high need for uniqueness may purchase more new arrivals than others. In short, it can be inferred that consumer’s need for uniqueness has a positive relationship with impulse buying, which individuals having higher need for uniqueness will have higher level of impulse buying in other words. Thus, the study proposes H3 as follows:
H3: Consumer’s Need for Uniqueness has significant positive influence on
30
2.2.4. Relationship between Novelty – Fashion Consciousness and Level of
Impulse Buying
As simply defined by Bae (2004), Novelty – fashion consciousness describes a shopper who is always aware of new styles while impulse buyers are labeled as individuals’ tendency to have spontaneous, unreflective, immediate and kinetic buying motives. As fully stated above, buyers with high level of impulse will have faster approach to buying ideas and have “opening” shopping lists at any time. Thus, it can be inferred that buyers with novelty-fashion consciousness are likely to experience impulse purchase. Additionally, in 1986, Sproles and Kendall together developed a consumer decision-making style inventory (CSI), which helps define and evaluate eight mental traits of consumer in decision making. Among eight consumer’s characteristics, novelty – fashion consciousness and impulsiveness are mentioned as traits which have greater impact towards consumption. Accordingly, it could be said that there has a positive relationship between Novelty – Fashion Consciousness and Level of Impulse Buying, which consumers who have high novelty and fashion consciousness will easily get involves with impulse buying and vice versa.
Therefore, this study proposes H5 as follows:
H4: Novelty – Fashion Consciousness has significant positive influence on
Level of Impulse Buying.
2.2.5. Relationship between Consumer Self-Spending Control and Level of
Impulse Buying
Previous studies suggested that the concept of self-control affects the level of impulse buying, which its central theme underlies impulse buying on many recent research (Baumeister 2002; Faber and Vohs, 2004). Additionally, research by Youn and Faber (2000) also demonstrates that impulse buying has its origin from purchaser characteristic; for instant, impulsiveness and optimum stimulation level, shopping enjoyment, or lack of self-control.
31
Baumeister et al. (1994), development of the characteristic measurement for self-control has been carried out by Tangney and Baumeister (2001). For those researchers attracted by the first phase of analysis and evaluation of how self-control forecast purchaser reactions, it is considered as a supportive instrument for a variety of assessment from adjusting emotions, tracking and administering performances as well as impulses, sustaining self-control, escape from inadequate practices, and the like. As discussed by Romal and Kaplan (1995), individuals having greater self-control administer their finance more appropriate than the others as well as preserving more and expending less.
Regarding above differences, the ability of being able to receive stimuli to various kind of marketing strategies can be forecasted by self-control. Individuals having low self-control is unprotected to be attracted by the moment, and a sales pitch focusing on instantaneous satisfaction would be engaging. On the other hand, individuals having greater self-control persuasively consider long-term value and advantages before purchasing. Low self-control person tends to respond in a way as “You will look and feel great in this car”. Conversely, “This car will be reliable and durable and will have a high resale value” tends to be the consideration of people having high self-control. Thus, impulse buying occurs when the desire of customers for a product beats their intentions to avoid purchasing. This indicates that the need to purchase and the capability of self-control are two discrete procedures taken into account with impulse buying.
In summary, the purchaser having low self-control tends to have impulse buying practice, and vice versa. Accordingly, for those who have lower purchaser self-control, a conclusion can be withdrawn that those individual will repeat impulse buying practice, having high optimum stimulation level and the requirement for being distinct as well as hedonic purchase behavior.
Therefore, we can come up with the following hypothesis is proposed:
H5: Consumer’s Need for Uniqueness has significant negative influence
32
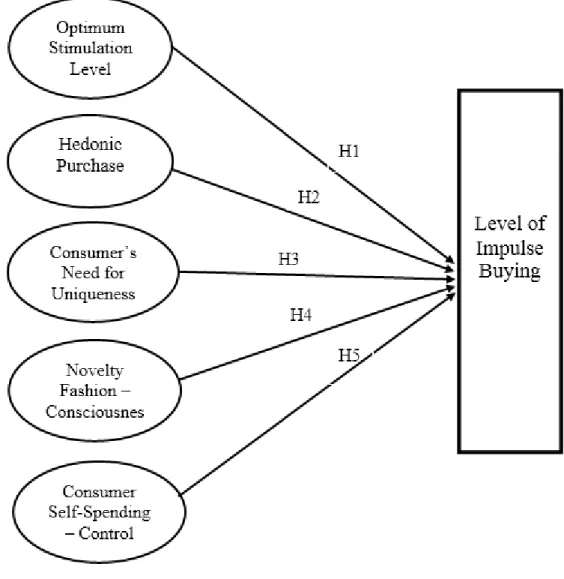
2.3. Research Model
To sum up, all of the hypotheses above will be presented in the theoretical framework for this study which is shown in the figure below:
Figure 2: Research Model
H1: Optimum Stimulation Level has significant positive impact on Level of Impulse buying.
33
H3: Consumer’s Need for Uniqueness has significant positive impact on Level of Impulse buying.
H4: Novelty – Fashion Consciousness has significant positive impact on Level of Impulse buying.
34
CHAPTER III
RESEARCH METHODOLOGY
This chapter aims to present about the research design that consist of research
approach, questionnaire design and sampling technique. Moreover, data analysis method
is also explain in details in this chapter.
3.1. Nature of the Research
According to Strauss and Corbin (1998), an academic research can be approached by various methods. However, this section tends to introduce briefly about some well-known methods and explain for the methods used in this study research.
There are two different kind of research, which are inductive and deductive research. If the process of inductive research starts with the gathering data, then looking for patterns in the data and end up with developing a theory that could give explanations on these patterns, researchers that apply deductive research begins examining a pre-existing theories and testing its association with data. In other words, while inductive research goes from data to build theories, deductive research involves with investigating data and testing hypotheses derived from existed theories. Accordingly, this research study applies deductive research.
3.2. Research Method
35
understanding of the surrounding society as well as better comprehension of how individuals, groups and institutions act and influence one another”. (Sogunro, 2001).
Qualitative research is mainly viewed as exploratory research. It is applied to achieve an understanding of casual reasons, ideas and stimuli. It delivers perceptions into the problem or supports to develop hypotheses for prospective quantitative approach. Besides, it is used to discover trends in thought as well as opinions, and provides researchers a deeper look into problems. Thus, the main purpose of this method is to gain “a deeper understanding of a specific phenomenon” instead of “drawing general conclusion about the situations” (Lundahl and Skärvad, 1999; Strauss and Corbin, 1998). Qualitative research mainly concentrates on quality and prejudice a social practices. Some common methods of qualitative research can be listed as focus group (or group discussion in other words), individual interviews and participant observations. Moreover, the sample size to conduct qualitative research is usually small and the respondents are well designated to satisfy a given quota.
36
In summary, for the purpose of getting solutions from enquiry hour numerical proof, quantitative research should be applied; on the other hand, for the aim of clarifying the occurrence of particular event, or explain the reason of any particular phenomenon, then qualitative research may applied.
3.3. Data Collection Method
There are two ways to collect data: primary and secondary sources. While primary data is defined as original data that collected first hand for a specific study research; secondary data is data that already existed and accumulated for another uses before conducting the study research. (Tull and Hawkins, 1993; Yin, 1994). Saving cost and time are the two biggest advantage of secondary data in the process of data collection in comparison with primary data. Nevertheless, since secondary data has been gathered for various different purposes, its content might not well suitable with the current requirements of the researchers (Hair et al., 2003; Yin, 1994). Thus, regarding above reasons, this study is conducted by collecting data from primary source.
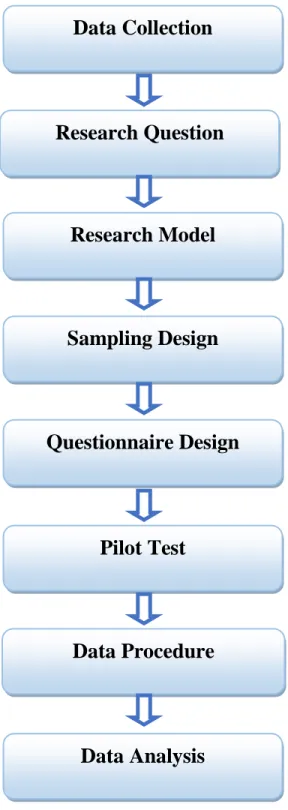
3.4. Research Design
37
Data Collection
Pilot Test
Data Analysis
Questionnaire Design
Research Question
Research Model
Sampling Design
Data Procedure
38
3.5. Sampling Design
3.5.1. Sample Size
Exploratory Factor Analysis is applied in this research study, thus, variables should follow the standard ratio which is 5:1 (with 5 respondents answering for 1 item) in EFA (Gorsuch, 1983 and Hatcher, 1994). This questionnaire consists of 39 items, thus, the sample size must reach at least 195 to be qualified. Furthermore, as proposed by Comfrey and Lee (1992), the sample size of 50, 100, 200, 300 can generate a very poor, poor, fair and good research outcomes correspondingly. Accordingly, the sample size of 320 is chosen to ensure the good result for the research study.
3.5.2 Sampling Technique
Due to the lack of time, budget and human resources, non – probability sampling was chosen among the sampling methods. Specifically, there are two kinds of sampling technique applied that are convenient sampling and snowball sampling. As defined by Cooper and Schindler (2006), convenient sampling is a “non-probability sampling where researchers use any readily available individuals as participants”. It is obvious that using convenient sampling is a reasonable and practical choice of investigators to approach the objects. Besides, snowball method is also applied in this study thanks to its convenience in reaching a large sample of respondents regardless of limited time, which mostly based on the researcher’s relationship or acquaintances. In other words, this method allows researchers utilized their network relationship to reach a wider target participants in order to gain more unbiased results.
3.5.3. Sampling Locations
39
sampling locations, which are Diamond Plaza, Vincom Center, Parkson Hung Vuong and Cresent Mall. These fashion malls not only have ideal geographic locations but also are famous for the huge attraction of shopping buyers every day. While Diamond Plaza and Vincom Center are placed at the most crowded streets in District 1 – the central business district of the city; Parkson Hung Vuong is in the center of District 5, which is one of the most districts have highest population in Ho Chi Minh city. Besides, Cresent Mall in District 7 is considered as the most potential shopping malls among all since it was built in the high standard of residential area (Phu My Hung metropolitan) where concentrates most of the senior classes of the society. Most of people living in District 7 have high to very high income, thus, they are believed to be indulged in hedonic consumption as well as impulse buying.
In short, fashion malls are the most suitable choices to conduct research toward impulse buying among consumers, especially those living in such a dynamic and modern city like Ho Chi Minh City. Exact number of data collected will be well- discussed in the Data collection procedure. The next part will mention about the Questionnaire Design.
3.6. Questionnaire Design
According to Churchill and Iacobucci (2006); Hair et al. (1998); Hair et al. (2006), there are 3 most widely used measurement scale in social sciences, including nominal, ordinal, interval or ratio. Apart from the nominal scales or demographic questions in other words, interval scales are mainly adapted in this research study since this scale is common applied in the field of academic marketing research thanks to its optimization in multivariate statistical techniques (Hair et al. 1998; Tull and Hawkins 1993). Besides, due to its fitness, Likert scale (Rensis Likert, 1932) is adopted for this research.
40
respondents may find it difficult to discriminate, respectively. Thus, various discussions have been carried out to decide the optimal number to best classify for the Likert scale. As argued by Green and Rao (1970), six or seven point scale is acceptable. Conversely, Ghiselli (1955) stated that we should develop the scale based on the diverse sets of circumstances. In this research study, a five-point scale (from 1 = Totally Disagree to 5 = Totally Agree) is applied in which the participants are required to give their level of agreement among these 5 scales.
Besides, the questionnaire consists of two main parts. The first part focuses on the groups of factors which are 5 independent variables and 1 dependent variable. The second part concentrates on demographic questions to gather personal information of impulse buyers.
As presented clearly above, all items were measured by a five-point Likert scale, anchored by 1: totally disagree and 5: totally agree.
Table 2: Measurement Items for the Research Model
Construct Sub- Scale Item Measurement Reference
OPTIMUM
STIMULATION
LEVEL
OSL1 I like to experience novelty
and change in daily routine. Baumgartner and Steenkamp,
(1996) OSL2 I am continually seeking new
ideas and experiences. OSL3 I like continually changing
activities.
OSL4 When things get boring, I like to try something different.
HP1 Shopping to me is truly a joy.
41
HEDONIC
PURCHASE
but because I want to.
Babin et al. (1994). HP3 The time spent in shopping is
truly enjoyable to me. HP4 I enjoy being immersed in
exciting new products while shopping.
HP5 I enjoy shopping for its own sake and not because of that I need to purchase something. HP6 While shopping I can feel the
excitement of the hunt. HP7 While shopping, I am able to
forget my other problems. HP8 While shopping I feel a sense
of adventure.
HP9 Any shopping is a very nice time out to me.
CONSUMER’S
Avoidance
of
similarity
CNU1 I stop wearing fashions when they become popular with the general public.
Snyder and Fromkin
(1977) CNU2 I dislike brands bought by
everyone.
CNU3 When a sport-wear brand becomes too popular, I wear it less.
42
NEED FOR
UNIQUENESS Unpopular
choice
style.
CNU5 The thing that I buy shapes a more unusual personal image.
CNU6 I buy unusual brands to create a more distinctive personal image.
Creative
choice
CNU7 An important goal is to find a brand that communicates my uniqueness.
CNU8 The brands that I like best are the ones that express my individuality.
NOVELTY –
FASHION
CONSCIOUSNESS
NFC1 I usually have one or more outfits of the very newest style.
Sproles (1985) &
Kendall (1986) NFC2 I keep my wardrobe up
–to-date with the changing fashions.
NFC3 Fashionable, attractive styling is very important to me.
NFC4 To get variety, I shop different stores and choose different brands.
CSC1 I am able to work effectively
43
CONSUMER SELF
-SPENDING CONTROL goals. Kelly L. Haws, William O. Bearden and
Gergana Y. Nenkov
(2010) CSC2 I carefully consider my needs
before making purchases. CSC3 I often delay taking action
until I have carefully
considered the consequences of my purchase decisions. CSC4 When I go out with friends, I
keep track of what I am spending.
CSC5 I am able to resist temptation in order to achieve my budget goals.
CSC6 I know when to say when regarding how much I spend. CSC7 In social situations, I am
generally aware of what I am spending.
CSC8 Having objectives related to spending is important to me.
IMPULSE BUYING
IB1 When go shopping, I buy things that I had not intended to purchase.
Beatty and Ferrell IB2 I am a person who makes
unplanned purchases.
44
IB4 When I bought (the item), I felt a spontaneous urge to buy it.
(1998)
IB5 When I saw (the item), I just couldn't resist buying it.
3.7. Pilot Study
According to Cavana et al. (2001), a pilot test should be conducted with a reasonable sample size to test the comprehensiveness and possibility of the survey. Thus, 90 respondents including teaching assistants and staff at ILA – an English center in Ho Chi Minh City as well as a part of International University’s students were invited to participate in this pilot test. In specific, 15 out of 90 surveys were given directly to the ILA’s teaching assistants during two weeks, then 10 of them were continually delivered to the staffs working at this center in the next weekends. At the same time, the data were collected in the two Psychology classes of Dr. Bui Quang Thong on Tuesday and Thursday, which the main respondents are International University’ students and the number of surveys returned was 43. The rest questionnaires were 22, and it were given face-to-face to the students of Organizational Behavior class on Friday of Dr. Mai Ngoc Khuong. The process of collecting data for doing pilot test ended up at 90 respondents.
Although this sample size was not large enough to run the main data analysis, it still brought an overview of how the questionnaires were designed and check the level of understanding of respondents. In other words, it cannot deny that the result of the pilot test not only pointed out misunderstandings in questionnaires but also showed partly of the result of the upcoming test. Thanks to that, the questionnaire can be designed again to avoid ambiguity or confusion caused from respondents in a more convenient way.
3.8. Data Collection Procedure
45
behavior is complicated, the research targets this group of respondents with purpose of having better understanding on this segmentation as well as giving suitable implication management for fashion industry.
As presented clearly above, in order to avoid bias, questionnaires were spread out mostly in the fashion malls. By giving directly to respondents and asking for fulfilling the paper questionnaire, there are 196 out of 355 surveys were delivered in these four fashion malls in total. Specifically, 35 data were collected in Diamond Plaza, 42 in Vincom Center, 58 in Parkson Hung Vuong and 61 data went from Cresent Mall. The respondents from this channel varies from students to executives, but most of them were planning to buy clothing products or related accessorizes at the time they were asked. Thus, this method of collecting data can be said in confidence that it has brought an objective result toward consumer buying behavior.
However, to reach the target sample size, data has to be gathered via online channel and some other offline locations apart from shopping malls. Thus, 159 surveys left had been collected from online channel and other offline approaches.
Firstly, for the online approach, Google Form was used to build online survey. The researcher can distribute this online survey via social networks or emails then collect data from the “View Response” column. In details, there were 100 responses within a week after spreading out the online questionnaires. Obviously, the rest of surveys went from other offline channels besides the fashion malls which will be discussed clearly as below.
46
of Ho Chi Minh City. As can be recognized, most of respondents in this study were college and university students, which also were the young people with high fashion consciousness and high frequency of visiting shopping malls. Thus, students are the main respondents of this research paper, which were approached equally by both online and offline channels.
Besides, offline participants also reached to office workers, housewives and executives (teachers, doctors, engineers, etc.). Apart from respondents reached through fashion malls, the researcher also sought for more in other offline sources. Firstly, since the researcher both have mother and father working as teachers in Nguyen Tri Phuong secondary high school and Tran Boi Co secondary high school, 23 paper questionnaires were delivered face-to-face to their colleagues within 4 days. Lastly, 48 surveys left went to parents who currently have students studying in ILA English center. The very small part of them are executives while almost they are working as office worker in companies or housewives/ retailers. In short, it took more than half of two weeks to complete collecting data from these participants.
Generally, the whole data procedure needs nearly a month to be finished. Exact figures will be calculated and presented clearly in descriptive statistics part in the following chapter, thus, the next section will introduce about how the data were analyzed.
3.9. Data Analysis Method
SPSS statistical software was used to analyze collected data in this research. Analyzed contents were categorized into descriptive statistics, reliability, validity, correlation, and AMOS model testing. With the usage of SPSS software, a two-step approach in structural equation modeling (SEM) was employed to analyze the data (Anderson and Gerbing, 1988) by using AMOS (adds-on SPSS).
47
48
CHAPTER
IV
DATA ANALYSIS AND FINDINGS
4.1. Sample Demographic
4.1.1. Response Rate
In this study, there has 355 responses were approached directly through online surveys and paper questionnaires. However, there were 320 out of 355 returned with acceptable and valid quality after deleting 35 unreliable answers from respondents. It also means that among 355 respondents, there were 320 of them qualified the criteria to become right subjects for this study. Invalid responses are excluded since the respondents had misunderstanding with reversed –scale questions or left blank the require questions. As a result, the response rate is about 90% in which the analysis based on.
Table 3: Valid Response Rate
FREQUENCY PERCENTAGE
INVALID 35 9.86
VALID 320 90.14
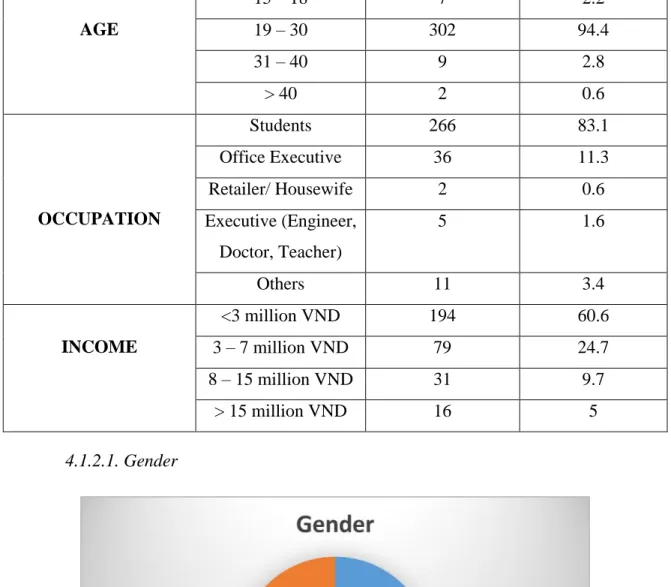
4.1.2. Demographic Analysis
In this part, the data of respondent profiles were summarized into important categories such as gender, age, occupation and monthly income with purpose of classifying the group of customers.
Table 4: Demographic Information
DETAIL FREQUENCY PERCENTAGE
GENDER
Male 111 34.7
49
AGE
15 – 18 7 2.2
19 – 30 302 94.4
31 – 40 9 2.8
> 40 2 0.6
OCCUPATION
Students 266 83.1
Office Executive 36 11.3
Retailer/ Housewife 2 0.6
Executive (Engineer, Doctor, Teacher)
5 1.6
Others 11 3.4
INCOME
<3 million VND 194 60.6
3 – 7 million VND 79 24.7
8 – 15 million VND 31 9.7
> 15 million VND 16 5
4.1.2.1. Gender
50
The pie chart indicates about the ratio of the two gender among the respondents in this study. It can be seen clearly that the percentage is higher in female buyers with nearly 65.4% while it only takes approximately 34.7% in male. Obviously, it can be concluded that female customers more potential than male since they have strong interest in fashion industry as well as impulse buying in the field of this research study.
4.1.2.2. Age
Figure 5: Age Group Percentage
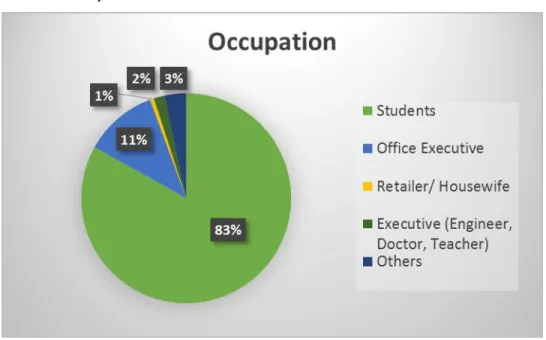
51 4.1.2.3. Occupation
Figure 6: Occupation Percentage
52 4.1.2.4. Income
Figure 7: Income Percentage
Generally, the lower – middle income accounts for 60% of the total respondents and is the highest income among the 3 groups. It can be explained that the students are the largest respondents, thus, the income level of these students usually ranges from under to 3 million VND. Besides, middle income level (3 – 7 million VND) takes the second place with 25%, upper – middle income level (8 – 15 million VND) lies in third place with 10% and the high income level (> 15 million VND) has the lowest proportion with only 5%.
4.2. Descriptive Statistics
53
4.2.1. Descriptive Statistics of Optimal Stimulation Level
Table 5: Descriptive Statistics of Optimum Stimulation Level
Mean Std.
Deviation
Average
Mean
OSL1 (I like to experience novelty and change in daily routine).
3.96 0.91
3.83 OSL2 (I am continually seeking new ideas and
experiences).
3.97 0.89
OSL3 (I like continually changing activities). 3.41 0.96 OSL4 (When things get boring, I like to try
something different).
3.99 0.85
Valid N (listwise): 320
The table shows that the average means among these items of Optimum Stimulation Level ranges from 3.41 to 3.99. Therefore, the means in these items are very close to each other. The item OSL1, OSL2 and OSL4 with the very high means value which are 3.96, 3.97 and 3.99 respectively shows that the customers’ opinions towards these 3 items are quite similar. Although the OSL3 (I like continually changing activities) gains the lowest mean value among the three, its mean value still is an average value compares to the standard. Finally, the average mean of all items is 3.83, which is very high reveals that most of respondent agree with all the items of Optimum Stimulation Level.
4.2.2. Descriptive Statistics of Hedonic Purchase
Table 6: Descriptive Statistics of Hedonic Purchase
Mean Std.
Deviation
Average
54
HP1 (Shopping to me is truly a joy). 3.91 1.03
3.35 HP2 (I shop not because I have to, but because I
want to).
3.19 1.18
HP3 (The time spent in shopping is truly enjoyable to me).
3.71 1.1
HP4 (I enjoy being immersed in exciting new products while shopping).
3.48 1.22
HP5 (I enjoy shopping for its own sake and not because of that I need to purchase something).
2.92 1.18
HP6 (While shopping I can feel the excitement of the hunt).
3.73 1.05
HP7 (While shopping, I am able to forget my other problems).
3.05 1.22
HP8 (While shopping I feel a sense of adventure). 2.98 1.17 HP9 (Any shopping is a very nice time out to me). 3.22 1.19 Valid N (listwise): 320
In general, it could be concluded that the respondents hold a neutral attitudes toward this factor due to the average mean value of total items (3.35). In specific, all of the items of Hedonic Purchase have mean values ranging from 2.92 to 3.91, which means there has a huge gap among variables. While HP1 (Shopping to me is truly a joy) stands out as a promising item with highest mean value (3.91), HP5 (I enjoy shopping for its own sake and not because of that I need to purchase something) does not receive many agree answers from respondents when having the lowest mean value (2.92).
4.2.3. Descriptive Statistics of Consumer’s Need for Uniqueness (in sub
55
Table 7: Descriptive Statistics of Consumer's Need for Uniqueness's
sub-dimensions
Mean Std.
Deviation
Average
Mean
CNU1 (I stop wearing fashions when they become popular with the general public).
2.64 1.14
3.02 CNU2 (I dislike brands bought by everyone). 2.76 1.16
CNU3 (When a sport-wear brand becomes too popular, I wear it less).
2.75 1.14
CNU4 (I look for one-of-a-kind products to create my own style).
3.13 1.16
CNU5 (The thing that I buy shapes a more unusual personal image).
3.17 0.99
CNU6 (I buy unusual brands to create a more distinctive personal image).
2.85 1.12
CNU7 (An important goal is to find a brand that communicates my uniqueness).
3.34 1.09
CNU8 (The brands that I like best are the ones that express my individuality).
3.52 1.04
Valid N (listwise): 320
56
value for mean (2.64). Finally, the average mean (3.02) proves that the consumers have the neutral attitude towards this factor.
4.2.4. Descriptive Statistics of Novelty – Fashion Consciousness
Table 8: Descriptive Statistics of Novelty-Fashion Consciousness
Mean Std.
Deviation
Average
Mean
NFC1 (I usually have one or more outfits of the very newest style).
2.87 1.12
3.05 NFC2 (I keep my wardrobe up –to-date with the
changing fashions).
2.78 1.11
NFC3 (Fashionable, attractive styling is very important to me).
3.05 1.16
NFC4 (To get variety, I shop different stores and choose different brands).
3.49 1.11
Valid N (listwise): 320
57
4.2.5. Descriptive Statistics of Consumer Self-Spending Control
Table 9: Descriptive Statistics of Consumer Self-Spending Control
Mean Std.
Deviation
Average
Mean
CSC1 (I closely monitor my spending behavior). 3.49 0.98
3.49 CSC2 (I am able to work effectively toward long
term financial goals).
3.35 1.01
CSC3 (I carefully consider my needs before making purchases).
3.76 0.94
CSC4 (I often delay taking action until I have carefully considered the consequences of my purchase decisions).
3.61 0.96
CSC5 (When I go out with friends, I keep track of what I am spending).
3.36 1.04
CSC6 (I am able to resist temptation in order to achieve my budget goals).
3.32 1.11
CSC7 (I know when to say when regarding how much I spend).
3.12 1.14
CSC8 (In social situations, I am generally aware of what I am spending).
3.74 0.86
CSC9 (Having objectives related to spending is important to me).
3.69 0.88
Valid N (listwise): 320