SNR enhancement in high resolution phasesensitive OTDR systems using chirped pulse amplification concepts
6
0
0
Texto completo
(2) SNR enhancement in high-resolution phasesensitiveOTDR systems using chirped pulse amplification concepts JUAN PASTOR-GRAELLS,1,2 * LUIS ROMERO CORTÉS,2 MARÍA R. FERNÁNDEZ -RUIZ,1 HUGO F. MARTINS,3 JOSÉ AZAÑA,2 SONIA MARTIN-LOPEZ,1 AND MIGUEL GONZALEZ-HERRAEZ1 1Departamento. de Electrónica, Universidad de Alcalá, Escuela Politécnica Superior, 28871 Madrid, Spain National de la Recherche Scientifique Energie, Matériaux et Télécommunications (INRS-EMT), 1650, Boul. Lionel-Boulet, Varennes, Québec J3X 1S2, Canada 3FOCUS S.L., C/Orellana, 1, 1° Izqda, 28004 Madrid, Spain *Corresponding author: [email protected] 2Institut. Received XX Month XXXX; revised XX Month, XXXX; accepted XX Month XXXX; posted XX Month XXXX (Doc. ID XXXXX); published XX Month XXXX. Phase-sensitive optical time-domain reflectometry (φOTDR) is widely used for the distributed detection of mechanical or environmental variations with resolutions of typically a few meters. The spatial resolution of these distributed sensors is related to the temporal width of the input probe pulses. However, the input pulse width cannot be arbitrarily reduced (to improve the resolution) since a minimum pulse energy is required to achieve a good level of signal-to-noise ratio (SNR), and the pulse peak power is limited by the advent of nonlinear effects. In this Letter, inspired by chirped pulse amplification (CPA) concepts, we present a novel technique that allows to increase the SNR by several orders of magnitude in φOTDR-based sensors, while reaching spatial resolutions in the centimeter range. In particular, we report an SNR increase of 20 dB over the traditional architecture, able to detect strain events with a spatial resolution of 1.8 cm. OCIS codes: (060.2370) Fiber optics sensors; (120.4825) Optical time domain reflectometry; (050.1590) Chirping; (320.5520) Pulse compression. http://dx.doi.org/10.1364/OL.99.099999. Distributed optical fiber sensors (DOFS) allow for the continuous, spatially-resolved measurement of different physical parameters (e.g., temperature, strain or birefringence, among others) in optical fibers over distances of typically tens of kilometers [1]. Phase-sensitive optical time-domain reflectometry (φOTDR) is commonly used for distributed vibration/strain event detection with spatial resolutions in the order of meters [2]. Recent advances in this technology have allowed a significant improvement of its performance with respect to the conventional arrangement, i.e., that in which a highly-coherent, transform-. limited optical pulse propagates over a conventional optical fiber, producing a backscattered trace that is detected and analyzed. In particular, length ranges of hundreds of kilometers have been achieved through the use of distributed Raman amplification [3]. Still, inherent limitations of φOTDR technology hinder further performance enhancements. Specifically, in a conventional φOTDR sensor, there is a critical trade-off between the spatial resolution and signal-to-noise ratio (SNR). For a given spatial resolution (set by the temporal width of the input probe pulse), an increase of SNR can only be achieved by increasing the probe peak power. However, this peak power is ultimately limited by the onset of nonlinear effects [4,5]. To overcome the relationship between the pulse width and the spatial resolution, techniques based on sequences of multi-wavelength pulses have been proposed in conventional OTDR, in a method named chirp-OTDR [6]. Regarding sensors using coherent probe pulses, a technique called optical pulse compression reflectometry (OPCR) was recently proposed for φOTDR [7,8]. This technique involves applying a linear frequency modulation (LFM) to the probe pulse, followed by numerical compression of the received backscattered trace using a simulated matched filter. The spatial resolution (demonstrated value of 47 cm) was determined by the pulse frequency bandwidth induced by the LFM process, rather than the pulse duration (which could be raised up to 2 µs). This increase in pulse width in principle allows an increased dynamic range and SNR. However, the technique shows some problems for a perfect compression, among them the effect of laser phase noise and the effect of random polarization evolution along the trace. In this Letter we demonstrate a new φOTDR configuration inspired by the concept of chirped pulse amplification (CPA) [9,10]. The method proposed here achieves spatial resolutions in the centimeter range while increasing the SNR by several orders of magnitude with respect to conventional φOTDR techniques. Our technique involves the physical time-stretching and amplification.
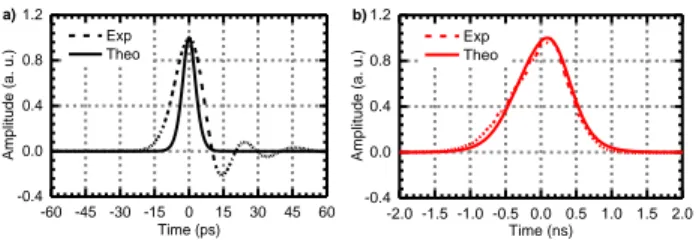
(3) of an ultra-short (e.g., picosecond) probe optical pulse in a dispersive medium, followed by propagation of such a pulse through the fiber under test (FUT), and subsequent compression of the resulting backscattered trace using the conjugated dispersive medium (i.e., a medium with the same dispersion magnitude as the first one, but opposite sign). This method is conceptually similar to that of OPCR, with the critical advantage that the process of pulse compression is directly realized in the optical domain, avoiding the need for phase detection of the backscattered trace and subsequent digital processing. Not only this greatly simplifies the scheme, but it also largely reduces the polarization sensitivity. The proposed technique has been experimentally validated, proving a system with a spatial resolution of 1.8 cm and an SNR increase of 20 dB with respect to the traditional φOTDR scheme. To model our scheme, we start by considering a highly coherent optical pulse with complex envelope p(t) that is injected into the FUT. Typically, a full width at half maximum (FWHM) pulse-width of nanoseconds is required for a sufficiently high SNR. The detected backscattered signal e(t) is given by the convolution of p(t) and the backscattering impulse response of the FUT r(t) [2-4],. et pt r t . (1). The backscattered signal is expressed in the spectral domain as. E P R . (2). where E(ω), P(ω) and R(ω) are the Fourier transforms of e(t), p(t) and r(t) respectively. In our approach, the input pulse p(t) has initially a width that is several orders of magnitude smaller than those used in conventional φOTDR (e.g., down to the picosecond regime). To reach a measurable energy in the measured trace, the probe pulse is first temporally stretched using a second-order dispersive device, providing predominantly a linear group delay with respect to frequency [10]. This leads to the spreading of the pulse energy over a longer temporal interval, thus reducing its peak power. The stretched pulse is then amplified up to the limit of appearance of nonlinear effects in the FUT (principally modulation instability), which are essentially dependent on the pulse peak power [4]. Assuming that only second-order dispersion is introduced, the spectrum of the pulse injected into the FUT is then. . Pst G P exp j 2 2. . (3). where G is the gain introduced by the amplification stage and is the second-order dispersion coefficient of the dispersive device. The received backscattered spectrum and corresponding temporal trace are. Est Pst R() est t pst t r (t ). (4). Using Eqs. 2 and 3 in Eq. 4, we can write the backscattered signal in the frequency domain as. . Est G E exp j 2 2. . (5). Upon arrival of the backscattered contributions, a second dispersive device with equal dispersion magnitude and opposite sign is used to compensate for the dispersion induced in p(t). . Ecomp Est exp j 2 2. . (6). Substituting Eq. 5 into Eq. 6, the latter can be simplified as. Ecomp G E ecomp t G e(t ). (7). It can be concluded from Eq. 7 that the presented system behaves essentially as a conventional φOTDR, with a spatial resolution given by the input pulse-width before time-stretching. The SNR of the measurement, however, is dictated by the energy of the transmitted pulse after time-stretching and amplification, which can be substantially increased before reaching the nonlinearity threshold. The experimental setup used to demonstrate this concept (Fig. 1) is similar to a traditional φOTDR (such as the one reported in e.g. [2]), but including two opposite-dispersive media in a configuration that emulates a CPA scheme. In this example, we use two linearly-chirped fiber Bragg gratings (LC-FBG) as dispersive media [10]. A passively mode-locked laser (working at a central wavelength of 1555.4 nm) generates transform-limited optical pulses with a FWHM of 7 ps (corresponding to a 3-dB bandwidth of 55 GHz), at a repetition rate of 10 MHz. The high repetition rate of the source limits the sensing range to a maximum length of 10 m. For this reason, the FUT used in this proof-of-concept is a spool of single-mode fiber (SMF) with a length of approximately 8 m. The sensing range could be extended by simply choosing a lower-rate pulse source. However, it is worth noting that the range could not be extended arbitrarily: dispersion-induced pulse broadening will generally limit the maximum range attainable by the system in sub-centimetric resolution setups. In our case, the maximum measurable length should be around 120 m to maintain the resolution value. The input pulse is first dispersed by an LC-FBG, with a second-order dispersion of ~2600 ps2 (equivalent to 120 km of standard SMF). The dispersed pulse is then amplified by an Erbium-doped fiber amplifier (EDFA) up to the peak power limit imposed by modulation instability [4]. The amplified spontaneous emission (ASE) added by the EDFA is subsequently minimized using a tunable optical filter. An optical circulator serves to launch the signal into the FUT and collect the backscattered response. This backscattered signal is also amplified and filtered to reduce the ASE. Next, the dispersion is compensated on the backscattered signal using a second LC-FBG with opposite dispersion to the first one. Finally, the resulting traces are detected by a 35 GHz photo-detector and recorded by an 80 GSps sampling oscilloscope (Tektronix CSA8200). To test the proposed configuration, several regions of the employed FUT are used as sensed points, namely the interfaces at the port 2 of the circulator, an APC/APC connector and a 1.5 cm-long fiber section in which a controlled strain is applied, see Fig. 1. The reflection produced by the last APC/APC connector is attenuated via a 15 dB/cm highly attenuating fiber spliced at the end of the FUT, in order to avoid saturation of the photo-detector. Additionally, strain variations through a 1.5 cm fiber section glued to a micrometric translation stage are also well detected. We now present the experimental results obtained from the proposed scheme, and compare them with the results obtained from a traditional φOTDR system (without the LC-FBGs). Figure 2 shows the temporal intensity profile of the pulse emitted by the laser (a) and the broadened pulse (b)..
(4) b) 40 Amplitude (dB). Amplitude (dB). a) 20 10 2.5 dB. 0 -10. 30 20 21 dB. 10 0 -10 -20. -20 0. 0.8. b) 1.2 Exp Theo. Amplitude (a. u.). Amplitude (a. u.). a) 1.2. 0.4 0.0 -0.4 -60 -45 -30 -15 0 15 Time (ps). 30. 45. 60. 0.8. Exp Theo. 0.4 0.0. -0.4 -2.0 -1.5 -1.0 -0.5 0.0 0.5 1.0 1.5 2.0 Time (ns). Fig. 2. Instantaneous power measurements of (a) Pulse emitted by the laser; (b) Pulse stretched by the LC-FBG. Notice the difference in the time scales in (a) and (b).. 3. 4 5 6 Position (m). 7. 8. 0. 9. 1. 2. 3. 4 5 6 Position (m). 7. 8. 9. An additional advantage of the proposed configuration is the fact that the system is more robust than the traditional scheme against other nonlinearities. To validate this claim, the optical spectrum of the dispersed and non-dispersed pulses after propagation through the FUT are recorded and analyzed (maintaining the peak power at 40 W). These spectra are plotted in Fig. 4a. It can be observed that, after 8 m of fiber propagation, the spectrum of the non-dispersed pulse starts to broaden due to selfphase modulation (SPM), increasing the bandwidth from 55 GHz to 65 GHz. On the other hand, the dispersed pulse maintains the original bandwidth, as it is shown in Fig. 4b. This owes to the fact that the SPM-induced broadening is larger for shorter Gaussian pulses. Time-stretched pulses are therefore more robust against this effect. The experimental results have also been confirmed theoretically. For this purpose, a Gaussian-like function was fitted to the spectrum of both input signals. Then, the non-linear effects induced in the signals were simulated by solving the nonlinear Schrödinger equation (NLSE) using a split-step Fourier method with adaptive step size [6]. Figure 4 shows the numerically obtained pulse spectra in continuous line, which are in good agreement with the experimental results (in dashed line). The operation of the system is proved by detecting the reflection peaks generated from the sensed points in the FUT. In particular, two initial reflections separated by 2 cm are generated by the interfaces inside the circulator placed at the fiber input (port 2 of the circulator), and a final one produced by a fiber connector (APC/APC) before the highly attenuating fiber. Figure 5 represents the detailed measurements of these reflections. Fig. 5a shows the reflections detected when using the pulse without chirp (FWHM of 7 ps) and peak power of 40 W. The two reflections produced by the circulator are represented in black; the reflection produced by the APC/APC connector is represented in red and superimposed to. a) 20 10 0. b) 20 Before (Exp) Before (Theo) After (Exp) After (Theo). -10 -20 -30 -40 1552 1553 1554 1555 1556 1557 1558 1559 Wavelength (nm). 10. Amplitude (dB). The theoretical curve (in continuous line) for the pulse emitted by the laser is obtained from the measured signal spectrum (Fig. 4a, black curve), assuming a transform-limited input. Note that the bandwidth of the employed photo-detector is only 35 GHz, well below the nominal pulse bandwidth of 55 GHz. For this reason, the laser pulse measured by the detector (Fig. 2a) presents a temporal width wider than the nominal value and several ripples in the trailing edge. The maximum estimated resolution of the sensor will then be limited by the detector response, which in this case is 30 ps, corresponding to a resolution of 3 mm [1]. The measured FWHM of the stretched pulse is 1 ns, which is roughly 100 times larger than the input pulse. The theoretical dispersed pulse in Fig. 2b is obtained by simulating the propagation of the laser pulse through a dispersive medium with the characteristics of the LCFBG used in the experiment. The experimental measurements present good agreement with the theoretical model. We start showing the detected backscattered traces, resulting from the 8-m SMF used as FUT, when launching a 7 ps-FWHM pulse (i) non-dispersed (Fig. 2a), and (ii) dispersed by the LC-FBG (Fig. 2b). The optical peak power in both cases was boosted up to the limit of modulation instability, i.e., around 40 W for this fiber length. In the second case, the trace is compressed by the second LC-FBG. Figure 3 shows the two detected traces after averaging 4000 times. Figure 3a shows the trace using the non-dispersed pulse (conventional φOTDR), while Fig. 3b shows the trace obtained by employing the stretched and amplified pulse (FWHM of 1 ns) and compensating the previously induced dispersion. It was essential to average the traces 4000 times to reach a minimum level of SNR in the trace obtained without CPA (fig. 3). Actually, the SNR of the trace obtained using CPA is ~4 dB when no averaging is applied. The temporal length of the stretched pulse is almost 100 times higher than that of the non-stretched pulse, and both have the same peak power. Hence, the energy of the former is almost 100 times higher. This leads to an expected increase of the SNR of the sensor by 20 dB, which can be verified from the measured traces presented in Fig. 3. It will be shown below that the spatial resolution is the same in both cases.. 2. Fig. 3. Detected backscattering traces with: (a) pulse without chirp (FWHM of 7 ps) with an input peak power of 40 W, and (b) timestretched pulse (FWHM of 1 ns) with an input peak power of 40 W and then temporally re-compressed. Both traces are normalized to the noise floor level. SNR is calculated with respect to the average trace level.. Amplitude (dB). Fig. 1. Experimental setup. Acronyms are explained in the text.. 1. 0. Before (Exp) Before (Theo) After (Exp) After (Theo). -10 -20 -30 -40 1552 1553 1554 1555 1556 1557 1558 1559 Wavelength (nm). Fig. 4. Signal spectra before and after propagation through 8 meters of SMF (input peak power of 40 W). (a) Pulse without chirp (FWHM of 7 ps), and (b) pulse stretched and amplified (FWHM of 1 ns)..
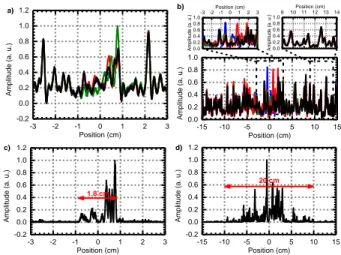
(5) 0.4 0.2 0.0. 0.4 0.2 0.0. 0. 1 2 3 4 Position (cm). 5. 0.8 0.6 0.4 0.2 0.0. -0.2. -0.2. 1.0. -0.2 0. 1. 2 3 4 Position (cm). 5. 0. 10 20 30 Position (cm). 0.8 0.6. 1.0. 0.4. 0.8. 0.2 0.0. 40. -0.2 -3. the first reflection (intensity levels have been adjusted for comparison purposes). As it can be observed, the connector reflection fits perfectly with the first reflection of the circulator, i.e., there is no measurable temporal broadening. As such, the resolution is maintained along the fiber. The temporal width of the peaks is in both cases 30 ps, which corresponds to the initial pulse width (nominal resolution of 3 mm), and so the two interfaces of the circulator can be resolved. The same results are obtained when the CPA scheme is used, as observed from Fig. 5b. The two input interfaces are clearly resolved, even though the duration of the stretched pulse covers both of them (recall that the FWHM of the stretched pulse is ~1ns, corresponding to a spatial resolution of ~10 cm). If the dispersion was not compensated, the two reflections generated by the circulator would not be distinguishable; this situation is presented in Fig. 5c (black). As expected, the resolution in this case corresponds to the temporal length of the stretched pulse (superimposed in red). Finally, strain perturbations are detected using the proposed configuration. These were applied in a 1.5 cm fiber section (disturbed region in Fig. 1). For this purpose, the disturbed fiber section was glued to a micrometric translation stage, controlling the applied strain (in steps of 700 με). Perturbations below 1.5 cm could not be applied due to the limitations on the available equipment. For this reason, in spite of the fact that the nominal resolution is 3 mm, sub-centimetric resolutions could not be demonstrated. The obtained results are plotted in Fig. 6 (traces with different strain are plotted with different colors). Figures 6a and 6b present the affected region in the re-compressed and nonrecompressed traces, respectively. In the top of Fig. 6b, a detail of the affected and the non-affected region is presented for clarification purposes. As it was expected, the affected region in Fig. 6b is much longer than in Fig. 6a, since the dispersion was not compensated in the former case. To further analyze these results, the accumulated square trace differences of Fig. 6a and Fig. 6b are represented in Fig. 6c and Fig. 6d, respectively. This way, we can easily determine the length of the affected region in both cases, namely, 1.8 cm for the re-compressed traces and 20 cm for the non-recompressed traces. Hence, we have proved the ability of the proposed configuration to detect a perturbed fiber section much shorter than the stretched pulse width. To sum up, in this work we have proposed a novel technique to increase the SNR of high-resolution φOTDR systems using concepts borrowed from CPA. The input pulses are temporally stretched by a suitable dispersive device, and the backscattered traces are re-compressed in the optical domain prior to detection. This allows to substantially increase the probe pulse energy, while avoiding nonlinear interaction within the fiber under test, resulting. -2. -1 0 1 Position (cm). 2. 3. 0.0 -15. 1.0. 1.8 cm. 0.4 0.2 0.0 -0.2 -3. -2. -1 0 1 Position (cm). 2. 3. Position (cm) 10 11 12 13. 14. 0.2. d) 1.2. 0.6. 9 1.0 0.8 0.6 0.4 0.2 0.0. 0.4. 1.0 0.8. 3. 0.6. c) 1.2. Amplitude (a. u.). Fig. 5. Connectors observed in the trace from: (a) non-dispersed pulse (FWHM of 7 ps), (b) pulse stretched, amplified (FWHM of ~1 ns) and then re-compressed, and (c) pulse stretched and amplified (FWHM of ~1 ns), not re-compressed. In all cases, the input peak power is 40 W.. Position (cm) -3 -2 -1 0 1 2 1.0 0.8 0.6 0.4 0.2 0.0. Amplitude (a. u.). 0.6. Amplitude (a. u.). 0.8. 1.0. Amplitude (a. u.). 0.6. b). a) 1.2. Circulator Stretched Pulse. Amplitude (a. u.). Amplitude (a. u.). Amplitude (a. u.). 0.8. c) 1.4 1.2. Circulator APC/APC. 1.0. Amplitude (a. u.). Circulator APC/APC. 1.0. Amplitude (a. u.). b) 1.2. a) 1.2. -10. -5 0 5 Position (cm). 10. 15. 10. 15. 0.8 20 cm. 0.6 0.4 0.2 0.0 -0.2 -15. -10. -5 0 5 Position (cm). Fig. 6. Strain event detection: (a) Detected traces after re-compression with different strains. (b) Detected traces not re-compressed with different strains. (c) and (d) shows the accumulated square trace differences of (a) and (b), respectively. Notice the difference in the position scales in a-c and b-d.. in an increased SNR without compromising the spatial resolution of the sensor. This configuration allows for high resolution measurements without the need for coherent detection or signal post-processing (as required for instance in OPCR). By compressing in the optical domain with a polarization-insensitive element, we avoid the need for phase detection (which is typically polarization-dependent). Thus, our method should exhibit very low polarization dependence. The reported experiment demonstrated an SNR increase of 20 dB over the traditional φOTDR architecture in a system with 1.8 cm spatial resolution. Funding. European Research Council (ERC) (Grant 307441); Seventh Framework Programme (FP7) (Grant 608099 of HFM); Ministerio de Economía y Competitividad (MINECO) (FPI contract of JPG, Ramón y Cajal contract of SML, TEC2013-45265-R, TEC2015-71127-C2-2-R); Horizon 2020 and MINECO (DOMINO); European Commission (EC) (MSCA-ITN-ETN-722509); Consejería de Educación, Juventud y Deporte, Comunidad de Madrid (SINFOTON-CM Program: S2013/MIT-2790).. References 1. X. Bao, and L. Chen, Sensors 12, 8601 (2012). 2. H. F. Martins, S. Martin-Lopez, P. Corredera, M. L. Filograno, O. Frazão, and M. Gonzalez-Herraez, J. Lightw. Technol. 31, 3631 (2013). 3. H. F. Martins, S. Martín-López, P. Corredera, M. L. Filograno, O. Frazão and M. Gonzalez-Herráez, J. Lightw. Technol. 32, 1510 (2014). 4. H. F. Martins, S. Martin-Lopez, P. Corredera, P. Salgado, O. Frazão, and M. Gonzalez-Herraez, Opt. Lett. 38, 872 (2013). 5. H. Izumita, Y. Koyamada, S. Furukawa, and I. Sankawa, J. Lightw. Technol. 12, 1230 (1994). 6. T. Sato, Y. Azuma, K. Yoshida, and Y. Hibino, Proc. ECOC’96, WeP.04, 23, 225 (1996). 7. W. Zou, S. Yang, X. Long, and J. Chen, Opt. Express 23, 512 (2015). 8. B. Lu, Z. Pan, Z. Wang, H. Zheng, Q. Ye, R. Qu, and H. Cai, Opt. Lett. 42, 391 (2017). 9. D. Strickland, and G. Mourou, Opt. Commun. 56, 219 (1985). 10. C. Caucheteur, D. Bigourd, E. Hugonnot, P. Szriftgiser, A. Kudlinski, M. Gonzalez-Herraez, and A. Mussot, Opt. Lett. 35, 1786 (2010)..
(6) Full reference list 1. X. Bao, and L. Chen, "Recent progress in distributed fiber optic sensors," Sensors, vol. 12, no. 7, pp. 8601-8639 (2012). 2. H. F. Martins, S. Martin-Lopez, P. Corredera, M. L. Filograno, O. Frazão, and M. Gonzalez-Herraez, "Coherent Noise Reduction in High Visibility PhaseSensitive Optical Time Domain Reflectometer for Distributed Sensing of Ultrasonic Waves," J. Lightw. Technol., vol. 31, no. 23, pp. 3631-3637 (2013). 3. H. F. Martins, S. Martín-López, P. Corredera, M. L. Filograno, O. Frazão and M. Gonzalez-Herráez, "Phase-sensitive optical time domain reflectometer assisted by first-order Raman amplification for distributed vibration sensing over >100 km," J. Lightw. Technol., vol. 32, no. 8, pp. 1510-1518 (2014). 4. H. F. Martins, S. Martin-Lopez, P. Corredera, P. Salgado, O. Frazão, and M. Gonzalez-Herraez, "Modulation instability-induced fading in phasesensitive optical time-domain reflectometry," Opt. Lett., vol. 38, no. 6, pp. 872-874 (2013). 5. H. Izumita, Y. Koyamada, S. Furukawa, and I. Sankawa, "The performance limit of coherent OTDR enhanced with optical fiber amplifiers due to optical nonlinear phenomena," J. Lightw. Technol., vol. 12, no. 7, pp. 12301238 (1994). 6. T. Sato, Y. Azuma, K. Yoshida, and Y. Hibino, "A chirp-OTDR using an AWG compressor," Proc. ECOC’96, WeP.04, vol. 3, pp. 225-228 (1996). 7. W. Zou, S. Yang, X. Long, and J. Chen, "Optical pulse compression reflectometry: proposal and proof-of-concept experiment, " Opt. Express, vol. 23, no. 1, pp. 512-522 (2015). 8. B. Lu, Z. Pan, Z. Wang, H. Zheng, Q. Ye, R. Qu, and H. Cai, "High spatial resolution phase-sensitive optical time domain reflectometer with a frequency-swept pulse," Opt. Lett., vol. 42, no. 3, pp. 391-394 (2017). 9. D. Strickland, and G. Mourou, "Compression of amplified chirped optical pulses," Opt. Commun., vol. 56, no. 3, p. 219 (1985). 10. C. Caucheteur, D. Bigourd, E. Hugonnot, P. Szriftgiser, A. Kudlinski, M. Gonzalez-Herraez, and A. Mussot, "Experimental demonstration of optical parametric chirped pulse amplification in optical fiber," Opt. Lett., vol. 35, no. 11, pp. 1786-1788 (2010)..
(7)
Figure
Documento similar