Double penalty in returns to education: informality and educational mismatch in the Colombian labour market
32
0
0
Texto completo
(2) Research Institute of Applied Economics Regional Quantitative Analysis Research Group. Working Paper 2013/07, pàg. 2 Working Paper 2013/04, pag. 2. WEBSITE: www.ub-irea.com • CONTACT: [email protected]. WEBSITE: www.ub.edu/aqr/ • CONTACT: [email protected]. Universitat de Barcelona Av. Diagonal, 690 • 08034 Barcelona. The Research Institute of Applied Economics (IREA) in Barcelona was founded in 2005, as a research institute in applied economics. Three consolidated research groups make up the institute: AQR, RISK and GiM, and a large number of members are involved in the Institute. IREA focuses on four priority lines of investigation: (i) the quantitative study of regional and urban economic activity and analysis of regional and local economic policies, (ii) study of public economic activity in markets, particularly in the fields of empirical evaluation of privatization, the regulation and competition in the markets of public services using state of industrial economy, (iii) risk analysis in finance and insurance, and (iv) the development of micro and macro econometrics applied for the analysis of economic activity, particularly for quantitative evaluation of public policies. IREA Working Papers often represent preliminary work and are circulated to encourage discussion. Citation of such a paper should account for its provisional character. For that reason, IREA Working Papers may not be reproduced or distributed without the written consent of the author. A revised version may be available directly from the author.. Any opinions expressed here are those of the author(s) and not those of IREA. Research published in this series may include views on policy, but the institute itself takes no institutional policy positions.. 2.
(3) Research Institute of Applied Economics Regional Quantitative Analysis Research Group. Working Paper 2013/07, pàg. 3 Working Paper 2013/04, pag. 3. Abstract This paper examines the returns to education taking into consideration the existence of educational mismatches in the formal and informal employment of a developing country. Results show that the returns of surplus, required and deficit years of schooling are different in the two sectors. Moreover, they suggest that these returns vary along the wage distribution, and that the pattern of variation differs for formal and informal workers. In particular, informal workers face not only lower returns to their education, but suffer a second penalty associated with educational mismatches that puts them at a greater disadvantage compare to their formal counterparts.. JEL classification: O17; J21; J24 Keywords: Educational Mismatch; Formal/Informal Employment; Economic Development; Wage Gap. Paula Herrera-Idárraga. AQR Research Group-IREA. Department of Econometrics. University of Barcelona, Av. Diagonal 690, 08034 Barcelona, Spain, and Pontificia Universidad Javeriana. E-mail: [email protected] Enrique López-Bazo. AQR Research Group-IREA. Department of Econometrics. University of Barcelona, Av. Diagonal 690, 08034 Barcelona, Spain. E-mail: [email protected] Elisabet Motellón. Universitat Oberta de Catalunya and AQR Research Group-IREA. Department of Econometrics. University of Barcelona, Av. Diagonal 690, 08034 Barcelona, Spain. E-mail: [email protected]. Acknowledgements The authors gratefully acknowledge financial support from the Spanish Ministry of Science and Innovation, Plan Nacional de I+D+i, Project ECO2011-30260-C03-03, and the European Commission under the 7th Framework Programme project SEARCH, SSH-2010-2.2-266834. Paula Herrera-Idárraga also acknowledges financial support from the Agència de Gestiò d’Ajuts Universitaris i de Recerca (AGAUR) (grant FI-DGR 2012) and from the Pontificia Universidad Javeriana.. 3.
(4) Research Institute of Applied Economics Regional Quantitative Analysis Research Group. Working Paper 2013/07, pàg. 4 Working Paper 2013/04, pag. 4. 1. Introduction. A distinctive feature of almost all Latin American and the Caribbean labour markets is the existence and the persistence of a large informal sector. In fact, half of the employed population of this region worked in informal jobs at the end of the first decade of this century (International Labour Organization [ILO], 2011). Informal employment embraces a variety of heterogeneous activities, such as self-employment entrepreneurs, salaried workers of large and small firms, and unpaid domestic workers. Informal employment generally involves that workers are trapped in unproductive activities, with inferior working conditions, lack of social security and lower earnings. A seemingly stylized fact, found in past studies about labour market segmentation, is that informalsector workers, even if equally productive, are subject to lower remuneration than formal-sector workers. So even when more highly educated workers tend to be more productive than less skilled counterparts, education may not be the key for higher paying jobs if the labour market is segmented. A number of explanations have been offered to explain why some earning-relevant characteristics, for example, education, are better rewarded in the formal sector than in the informal sector. An important bulk of these explanations is based on a segmented view of the labour market. For instance, the presence of extremely restrictive labour market institutions and strict regulation of entry into the formal sector could pose a possible cause, so that some workers that do not have access to the formal sector are forced to accept informal sector jobs characterized by inferior earnings (see Fields, 1975). However, several more recent studies postulate, for both firms and workers the decision of being formal turns out to be extremely costly, due to the non labour costs associated with health and pension contributions, payroll taxes, commuting subsidies, among others, which significantly increases the attractiveness of informal activities. Maloney (1999), for instance, introduces a standpoint in which workers may find informal-sector employment a desirable alternative, due to inefficiencies in the provision of public services, that is, health and pension, or because their level of human capital do not fulfil the requirements for performing formal jobs. In the last case, a wage penalty for informal-sector employment may be due to sorting, where those with low levels of human capital are also those more likely to work in the informal sector (Tokman, 1982). This type of sorting may result from the fact that firms in the informal sector have limited access to financing and employers choose to substitute physical capital for low-skill labour (see, for example, Amaral and Quintin, 2006).. 4.
(5) Research Institute of Applied Economics Regional Quantitative Analysis Research Group. Working Paper 2013/07, pàg. 5 Working Paper 2013/04, pag. 5. However, none of the former studies have considered one aspect which can affect the wage gap between formal and informal workers, that is, the way workers match their acquire education to the one required to perform their job. One important feature that raises concern in developed countries is the existence of a discrepancy between the education attainment of workers and the skill requirements of jobs, commonly known as education-occupation mismatch (Organisation for Economic Co-operation and Development [OECD], 2011). The incidence and labour market effects of educational-occupation mismatch, especially overeducation, have received increasing attention in the literature for developed countries (Germany, the Netherlands, Spain, the United Kingdom, Portugal, Hong Kong and the United States) 1. Recently some attention has also been paid for some developing countries (Mexico, Pakistan, India, the Philippines, Thailand and Colombia) 2. Several of these studies have shown that the incidence of educationoccupation mismatch varies significantly with the method used to measure required education, hence overeducation. However, while the choice of the method can have an effect on the incidence of the phenomenon under analysis, the effect on earnings is not altered (Groot and van den Brink, 2000). So, independently of the method used, a number of studies that estimated the effects of overeducation on earnings for developed and developing countries found that overeducated workers tend to earn higher returns to their years of schooling than co-workers who are not overeducated, but lower returns than workers with similar education who work in jobs that require the level of education that they possess. In a previous study, Herrera-Idárraga, López-Bazo, and Motellón (2012), using micro-data for Colombia, find that after controlling for other characteristics and correcting for endogeneity, informal salary workers are more likely to be over-educated than formal workers. Thus it is possible that the formal-informal wage gap is driven, at least in part, by a less satisfactory matching of education-occupation in the informal sector and by the penalization in terms of wages that is derived from this mismatch. Actually the aim of this paper is to re-examine the wage gap between 1. Duncan and Hoffman (1981), Verdugo and Verdugo (1989), Sicherman (1991), Tsang, Rumberger, and Levin (1991), McGoldrick and Robst (1996) studied the phenomenon for the United States; Alpin, Shackleton, and Walsh (1998), Green, McIntosh and, Vignoles (2002), Dolton and Vignoles (2000) and Chevalier (2003) for the UK; Hartog and Oosterbeek (1988) and Groot and van den Brink (2000) for Holland; Bauer (2002) and Büchel and van Ham (2003) for Germany; Kiker, Santos, and Mendes de Oliveira (1997) and Mendes de Oliveira, Santos, and Kiker (2000) for Portugal; Alba-Ramírez (1993) for Spain. For an extensive review of overeducation in developed countries see McGuinness (2006) and for a recent survey on overeducation see Leuven and Oosterbeek (2011). 2 Quinn and Rubb (2006) study the phenomenon for Mexico, Abbas (2008) for Pakistan and Mehta, Felipe, and Camingue (2011) for India, Mexico, the Philippines and Thailand, Mora (2005), Castillo (2007) and Herrera-Idárraga, López-Bazo, and Motellón (2012) for Colombia.. 5.
(6) Research Institute of Applied Economics Regional Quantitative Analysis Research Group. Working Paper 2013/07, pàg. 6 Working Paper 2013/04, pag. 6. formal and informal workers taking into consideration that education-occupation mismatch is present in both sectors, using the case study of Colombia. Colombian labour market constitutes a good case of study for several reasons. First, informality today is at centre of economic and political debates in the country because the high levels that prevail. Second, in Colombia there is a high incidence of the minimum wage, that is, a relatively high proportion of formal sector employees, 34.6 per cent, receive a salary similar to the minimum (Arango, Herrera, and Posada, 2008) which points to the existence of important labour market rigidities. Third, previous studies have found overeducation to exist in Colombia (Mora, 2005; Castillo, 2007; Dominguez-Moreno, 2009; Herrera-Idárraga, López-Bazo, and Motellón, 2012). This study contributes to the literature on informality and education-occupation mismatch by gauging if the return to years of required education, years of surplus education and years of deficit education differ across formal and informal sectors. If they do differ and if salaried informal workers are more penalized in terms of wages in the presence of educational mismatches than their formal counterparts, then we can infer that part of the formal-informal wage gap might be originated in such a difference. A similar approach is adopted in Chiswick and Miller (2008) in their analysis of the difference in returns to education between native and foreigners in United States. These authors find that the lower payoff to schooling for foreign-born workers is due to under education (linked with positive self-selection in immigration among immigrants with low levels of schooling) rather than to overeducation (related to the less-than-perfect international transferability of human capital). Under the same line, Ren and Miller (2012) also use the over-under education framework for analysing the difference in the returns to schooling between men and women in China. As far as we know, the idea of distinguishing the difference in the returns from correct, over and deficit years of education for formal and informal workers is a novel contribution, as there is no previous study that considered this difference before in all analyses of which we know about informality 3.. 3. See, for example, Magnac (1991), Nuñez (2002), Maloney and Nuñez (2004), Flórez (2002), Kugler and Kugler (2009) and Mondragón-Vélez, Peña, and Willis (2010) for Colombia; Gindling (1991) for Costa Rica; Pradhan and van Soest (1995) for Bolivia; Amuedo-Dorantes (2004) for Chile; Pratap and Quintin (2006) for Argentina; Tansel (2000) for Turkey; Marcouiller, Ruiz de Castilla, and Woodruff (1997) and Gong and van Soest (2002) for Mexico; Botelho and Ponczek (2011) for Brazil; Badaoui, Strobl, and Walsh (2008) for South Africa.. 6.
(7) Research Institute of Applied Economics Regional Quantitative Analysis Research Group. Working Paper 2013/07, pàg. 7 Working Paper 2013/04, pag. 7. The empirical analysis consists of examining the returns to education taking into consideration the existence of educational mismatches in the formal and informal sector. For this purpose we first estimate the standard Duncan and Hoffman (1981) specification (so called ORU wage equation) at the mean, using ordinary least square (OLS), and controlling for a rich set of observable individual and firm characteristics. Then, we examine if the returns to education for each of the education-occupation mismatch are not uniform along the wage distribution by using quantile regression estimation. In both cases the endogeneity sector choice is addressed. Results for Colombia show that: i) consistent with previous literature, the return to an overeducated year is lower than the return to a required year of education, both in the formal and informal sector, ii) formal workers that possess the education required to do their job have a higher return to their education, around double, compared with their informal counterparts, iii) moreover, they have a higher return than informal workers who are overeducated, iv) the return to an overeducated year of education is higher in the formal sector than in the informal sector and v) the wage penalty of deficit schooling is almost the same across the two sectors. Moreover using quantile regression estimations we show that i) these returns vary along the wage distribution and ii) the pattern of variation along the distribution is not the same for formal and informal workers. More specifically, the returns to required education increases along the wage distribution for both type of workers, but the increase is more noticeable for formal workers. While returns to surplus education increases along the wage distribution for formal workers, they almost remain constant for informal workers. We therefore conclude that adding measures of educational mismatch gives important information to the analysis of the formal/informal wage gap. In particular, we show that in the informal sector not only the returns to correct years of education are lower, but the penalty that informal workers face due to educational mismatches, specially overeducation, in terms of wages are considerable higher than the one for their formal counterparts. The rest of the paper is organized as follows. The next section gives a description of the data and some selected descriptive, while the empirical approach is presented in section 3. Section 4 summarizes the results regarding the estimates of the empirical models, and, finally, section 5 concludes.. 7.
(8) Research Institute of Applied Economics Regional Quantitative Analysis Research Group. Working Paper 2013/07, pàg. 8 Working Paper 2013/04, pag. 8. 2. Dataset and descriptive analysis. We use data from the Colombian Household Survey (CHS), a repeated cross-section conducted by the National Statistics Department (DANE). The survey gathers information about employment conditions for population aged 12 or more including income, occupation and industry sector at two digit level, in addition to the general population characteristics such as sex, age, marital status and educational attainment and covers the thirteen mayor metropolitan areas in Colombia. In this study, a sample of 34626 working individuals was drawn from the 2010 CHS. The analysis was restricted to salary workers that were not carrying formal studies aged between 15 and 60 years and who report working more than 16 hours per week. We do not include selfemployed and employers workers in the analysis because their source of income is a combination of labour and physical capital and therefore may not be compared with earnings of other employees. Apart from this, self-employed workers’ earnings would be expected to have a greater measurement error. Also, while comparing self-employed informal workers to their formal counterparts may be of interest, it has been shown in previews studies that self-employed in the informal sector corresponds more with a voluntary entry, while informal salaried work may correspond more closely to the standard queuing view, especially for younger workers (Perry et al., 2007; Bosh and Maloney, 2010). Excluding self-employed resulted in dropping 16941 individuals. We also exclude public employees from the sample since by nature they belong to the formal sector and their wages might reflect institutional arrangements. After excluding observations with missing values or inconsistencies for the selected regressors, over 13797 individuals remained in our sample. We classify workers as formal or informal according to whether they are covered by the social security system or not, in line with the definition proposed by the Seventeenth International Conferences of Labour Statisticians (ICLS). 4 Thus, we define workers as formal if they contribute both to health and old-age insurance. For the purpose of measuring the incidence of the educationoccupation mismatch we define required education using the statistical method in its mean and mode version. Under the statistical method required education is define as the mean or mode level 4. The definition of the Seventeenth International Conferences of Labour Statisticians (ICLS) of informal employment is ¨based on the characteristics of the individual’s employment, job or position. A worker has an informal job if the employment relationship is, in law or in practice, not subject to national labour or social legislation. This condition of informal employment is observed in persons employed in both formal and informal enterprises, as well as in those employed in domestic service by households¨ (ILO, 2011).. 8.
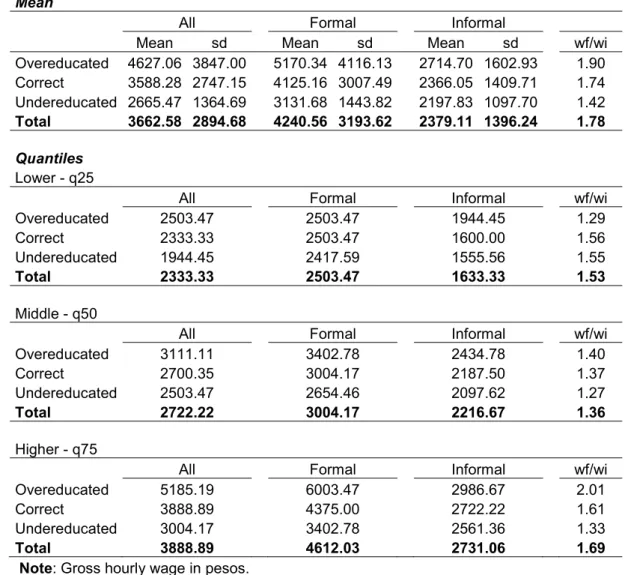
(9) Research Institute of Applied Economics Regional Quantitative Analysis Research Group. Working Paper 2013/07, pàg. 9 Working Paper 2013/04, pag. 9. of schooling for each occupation. Individuals are classified as over-educated (under-educated) for a particular occupation if their level of education is higher (lower) than the required education. In the mean measure a worker is over-educated or under-educated if their completed level of schooling deviates by one standard deviation from the mean in their occupation. 5 Regarding earnings, we have combined information from gross monthly income and worked hours in order to obtain gross hourly wages. Table 1 contains mean hourly wages by job type and educational mismatch. As it can be seen informal workers are likely to earn less than formal workers, formal workers earn 78 per cent more than what informal workers earn for the total sample. This large wage differential found here is in line with the findings of several other studies for other countries, and so far has been the centrepiece of the empirical analysis in the past. If formal and informal workers are classified by educational mismatch the wage gap is not the same across the different categories. For instance, overeducated formal workers earn 90 per cent more than informal overeducated workers, while undereducated formal workers earn 40 per cent more than their informal peers. The formal – informal wage gap is also higher for the overeducated than for workers correctly matched in terms of education. Table 1 also presents the formal-informal wage gap at different quantiles. As it can be seen the wage gap is not homogeneous along the wage distribution and across the different educationoccupation mismatches. The first thing to be noticed is that the hourly wage at the lower quantile for correct and overeducated formal workers are both equal to the minimum wage, 6 while an undereducated formal worker perceives a wage slightly lower. 7 This finding conforms to the notion that the minimum wage is binding in the formal sector. The formal-informal wage gap among the least skilled, measured by the lower quantile of the wage distribution, is considerably lower for overeducated workers compare to correct and undereducated workers. This could be indicating that a formal worker in the lower part of the distribution and regardless of his education will be rewarded with a wage similar to the minimum wage, while informal wages are determined freely. 5. For purpose of brevity we only included the results obtained with the mean, as with the mode the results are not significantly different. The full set of results is available on request. 6 The monthly minimum wage in Colombia in 2010 was 515,000 pesos, equivalent to 2503.47 pesos per hour (this value is obtain by first dividing the monthly minimum wage by 4.3 to obtain weekly wage which in turn is divided by 48 weekly hours of work to reach hourly wage). 7 A close inspection of the data shows that on average undereducated workers at the lower part of the distribution earn a wage equal to the minimum monthly wage, however as some undereducated workers reported working more than 48 hours the wage observed at the lower quantile is slightly less than the computed minimum hourly wage.. 9.
(10) Research Institute of Applied Economics Regional Quantitative Analysis Research Group. Working Paper 2013/07, pàg. 10 Working Paper 2013/04, pag. 10. This possibility to set wages freely allows informal sector to pay a considerably lower wage to correct and undereducated workers, while somehow rewarding overeducated workers. In contrast, at the middle and, particularly, at the upper part of the distribution the formal-informal wage gap is substantially higher for overeducated workers compare to correct and undereducated workers. Thus, this simple preliminary evidence, at the mean and at different quantiles, indicates that educational mismatch may be a key aspect in order to get a better understanding of the formal – informal wage gap. Table 2 presents some basic summary statistics concerning the distribution of the observed workers’ and firms’ characteristics that may be driving the earnings differentials. It shows information for the entire sample of workers, and distinguishing between those working in the formal and in the informal sectors. From the raw data it is deduced that formal workers seems more likely to be overeducated than informal workers, while informal workers seems more likely to be undereducated than their formal counterparts. Furthermore the incidence of correctly educated workers is similar in the two sectors. However, these differentials in the incidence of over- and under education may just be caused by a composition effect, in other words, formal workers are more educated whereas informal worker are less educated 8. In fact, formal workers in our sample are more likely to have higher education or more (44 per cent), whereas informal workers are more likely to have basic secondary and secondary (22 per cent and 36 per cent respectively). There is not significant difference in age and experience between workers in both groups. In contrast, there are some notable differences in the average tenure between sectors; formal workers tend to accumulate much more tenure than informal workers, suggesting higher stability of employment for formal workers. As a matter of fact, 95 per cent of formal workers had signed a contract, and 65 per cent of them of a permanent type, in contrast with only 18 per cent of informal workers who have a contract, and only 10 per cent having a permanent one. On the other hand, as can be seen, the percentage of female workers in the formal sector is higher than in the informal. This may be due to the fact that our sample excludes self-employed individuals and unpaid family workers. A much larger proportion of the workforce in the formal sector is married. In terms of the occupational structure, informal workers are more likely to be found in unskilled manufacturing and agricultural occupations (43 per cent). Those in the formal sector are also more likely to be found in unskilled manufacturing and agricultural occupations like informal workers but at a lower rate (25 per cent),. 8. Herrera-Idárraga, López-Bazo, and Motellón (2012) show that a sorting effect drives the gap in the raw propensities, and, that when comparing formal and informal workers with similar individual and firm characteristics, those in the former group have a lower propensity to be overeducated.. 10.
(11) Research Institute of Applied Economics Regional Quantitative Analysis Research Group. Working Paper 2013/07, pàg. 11 Working Paper 2013/04, pag. 11. followed by administrative staff (24 per cent). There is little difference in the average hours of work in the two sectors. Firms with less than 3 regular employees are substantially more likely to be part of the informal sector. In contrast, larger firms employ much of the formal-sector labour force with a workforce greater than one hundred.. 3. Wage estimates - Empirical Strategy An important number of former studies that intended to measure the formal – informal sector wage gap have simply estimated a Mincerian wage equation using OLS. The framework for the empirical analysis is a model in which the wage of an individual i in sector j is given by: (1) where W ij denotes the log of the hourly wage of the individual i in sector j, formal (F) or informal (I), Sij the years of acquire education, Xij denotes the set of other characteristics (for example experience, tenure, gender) that affect the wage of this individual; Dj is the return to years of acquire education and Ej is a vector of prices or returns associated with other characteristics that affect wages. Finally, Hij is the error term for individual i in sector j. The typical specification adopted to estimate the effect on earnings of education – occupation mismatch is based also on the Mincerian wage equation. However, the general educational mismatch specification varies slightly in that the variable of acquired years of schooling is decomposed into three variables: required, surplus and deficit education, following Duncan and Hoffman (1981) formulation. Overeducation is the amount of years of schooling a worker has acquired in excess of the required education needed to perform his job. Under education entails the opposite. Under this framework wages are a function of over, required and deficit years of education (so-called ORU wage equation). That is: (2) where Sr is years of required education, So is years of surplus education above the required level. 11.
(12) Research Institute of Applied Economics Regional Quantitative Analysis Research Group. Working Paper 2013/07, pàg. 12 Working Paper 2013/04, pag. 12. and Su is years of deficit schooling below the required level 9. Then, under this wage equation the returns from additional education are Drj for required years, D0j for surplus years, and Duj for deficit years of education. Notice that instead of imposing the same return in the two sectors, we allow them to differ for workers in each sector j, formal or informal. Next we want to analyse the returns to education and the effects of occupation-education mismatch on the entire wage distribution for formal and informal workers, by using linear quantile regression estimates. By estimating linear quantile regressions we are able to examine the heterogeneous effect of education at different points in the wage distribution. Moreover, quantile regression estimates are robust to the outliers of the dependent variable and they are also more efficient than the OLS under non-normality of the error terms. For any worker i in sector j we can write the Wth quantile of the hourly wage distribution conditional on actual years of education (Sij) and other characteristics (Xij) as: ,. where. (3). is the Wth quantile of Wij conditional to Sij and Xij. The estimated quantile. regression (QR) coefficients can be interpreted as the rates of return to actual education and other characteristics at different points of the conditional wage distribution. Similarly, for any worker i in sector j we can write the Wth quantile of the hourly wage distribution conditional to years of required education (Srij), years of surplus education (Soij), years of deficit education (Suij), and other characteristics (Xij) as: ,. (4). The specifications formulated so far (eqs. 1 to 4) neglect the existence of non-observable characteristics that could simultaneously affect wages and the sector in which the individuals are currently working. This will cause to obtain not only biased, but also inconsistent coefficients of the return to education. To account for this concern, we implement the conventional approach of including a selection correction in the wage regressions for each sector. This entails a two-stage estimation process. In a first stage a reduced-form probit model of the formal vs. informal decision. 9. Years of acquire education equals years of required education plus years of surplus education minus years r o u of deficit education (S =S + S - S ).. 12.
(13) Research Institute of Applied Economics Regional Quantitative Analysis Research Group. Working Paper 2013/07, pàg. 13 Working Paper 2013/04, pag. 13. is estimated, and a sample selection correction term is obtained. In stage two, the correction term is incorporated into conventional Mincerian semi-log earnings functions for the formally employed and informally employed (see, for example, Gong and van Soest, 2002; Günther and Launov, 2012). The selection process of the sector of employment follows the latent model: (5) where Ei* is a latent variable that determines the sector j (= formal, informal) in which individual i is employed,. is a vector of observed individual characteristics included in. in the wages. equations plus some other variable(s) likely to affect the propensity to be employed in the formal or informal sector, and Pi is the error term. The observed binary variable Ei is related to the latent variable Ei* as follows: Ei =1 if the individual is in the formal sector (Ei*t0) Ei = 0 otherwise Estimates of returns based on the wage equations (1) to (4), leaving aside the selection equation (5), are biased and inconsistent if the error term of the selection equation and the error terms of the wage equations are correlated, for example cov[Pi,Hij] = Uj z 0 for the mean Mincerian wage equation in (1). In the case of estimates at the mean, consistency can be obtained by maximum likelihood considering the information from the selection and wage equations or, alternatively, by applying the two-step method proposed by Heckman (1979). The so-called Heckit method includes the inverse Mills ratio in the wage equation as an additional regressor to obtain wages conditional on being in the formal or informal sector. While the methods for correcting sample selection for mean regression are well acknowledged, there are few known approaches to correct for selectivity bias in quantile regression models and there is little consensus regarding the most appropriate correction procedure. Buchinsky (1998) suggests an approach to approximate the selection term by a power series expansion of the inverse of the Mill’s ratio and is the most common approach used so far for. 13.
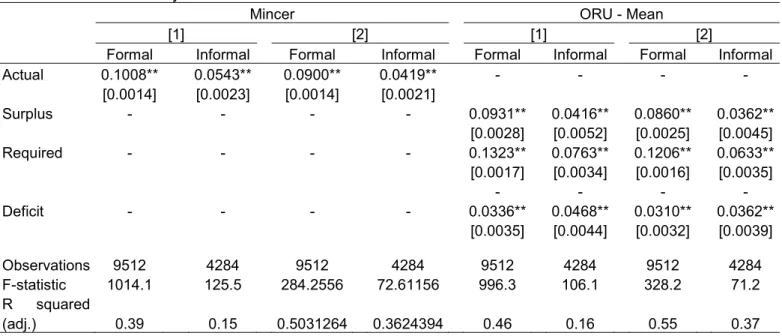
(14) Research Institute of Applied Economics Regional Quantitative Analysis Research Group. Working Paper 2013/07, pàg. 14 Working Paper 2013/04, pag. 14. correcting selectivity in quantile regression models (Garcia, Hernández, and López-Nicolás, 2001; de la Rica, Dolado, and Llorens, 2008; Albrecht, van Vuuren, and Vroman, 2009).. 4. Returns to education across sectors – empirical results 4.1 OLS regressions Table 3 presents the coefficients obtained from estimating the Mincer wage equation (1) and the coefficients of estimating the ORU wage equation (2). Estimates were done separately for formal and informal workers. A simple specification for the two wage equations was used to account fully the effect of human capital variables. It includes as explanatory variables the number of years of education (actual years of education in the Mincerian wage equation and years of education decomposed into surplus, required and deficit in the ORU wage equation), the years of experience and its square, the months of tenure with the current firm and its square, and the gender of the individual. The results of this simple specification are presented in the first column of each estimated wage equation. As it has been shown in the descriptive analysis, formal and informal workers differ significantly in firm and individual characteristics, beside those related to human capital. For instance, given that firms tend to be larger in the formal sector and larger firm pay more, formal workers could obtain a higher return to their education just because they are more prone to work in large firms while informal workers are more likely to work in small firms. Thus to ensure that the comparison of the returns to education across the two sectors is done for observably similar workers, a more comprehensive specification that includes additional controls was used for the two wage equations. Besides, including additional individual and job characteristics also allow us to disentangle to what extend these observable characteristics explain the average wage differentials across formal and informal workers. Those controls include dummy variables for marital status, head of household, occupation, contract signed, size of the firm, industry sector, hours worked and a dummy variable indicating the metropolitan area. The results of this more comprehensive specification are shown in the second column of each estimated wage equation in Table 3.. 14.
(15) Research Institute of Applied Economics Regional Quantitative Analysis Research Group. Working Paper 2013/07, pàg. 15 Working Paper 2013/04, pag. 15. We start by describing the results of the Mincerian wage equation for the simple specification (columns labelled 1). The results show that education is better rewarded in the formal sector than in the informal sector, since each additional year of schooling increases hourly wages by 10.08 per cent for formal workers, which is around double that for the informal workers, 5.43 per cent. As expected, once additional controls are accounted for (columns labelled 2) the return to schooling estimated for both sectors is lower. Each additional year of schooling increased hourly wage by 9.00 per cent for formal workers and by 4.19 per cent for informal workers. Nevertheless, the finding that formal workers have a higher return to their education than informal workers still holds. Considering the existence of educational mismatches gives an interesting picture of the difference in the returns to schooling across the two sectors. Table 3 also presents the returns associated with schooling when educational mismatches are present –the ORU wage equation (2). Consistent with previous literature i) the returns to surplus schooling are lower than the returns to required schooling, ii) a year of deficit schooling carries a wage penalty for both sectors, and iii) the returns on required education are higher than that on actual or attained education in the Mincer equation. As it can be seen, the returns to required and to surplus schooling are higher in the formal sector than in the informal. Results from the specification that does not include the full set of controls indicate that one additional year of required education raises hourly wages by 13.23 per cent in the formal sector and by 7.63 per cent in the informal. Years of surplus education are associated with an earning increase of 9.31 per cent for formal workers and 4.16 per cent for informal workers. Noteworthy is that the penalty of deficit schooling is not very dissimilar across the two sectors, 3.36 per cent for formal workers and 4.68 per cent for informal workers. As for the results when additional controls are introduced in the estimation of the ORU wage equation, it can be observed that the returns to required and surplus schooling diminish but only slightly, whereas the decrease in the estimate of the penalty of deficit schooling is more intense for informal workers. In any case, regardless of the inclusion or not of additional controls, results confirm that the returns to required and surplus education for formal workers are significantly higher than those for informal workers. To sum up, formal workers have higher returns to their years of education than informal workers, and this is so in the presence of educational mismatch. Moreover, overeducated informal workers are double penalized, since in addition to the lower return to years of required education for the fact of being in the informal sector, they face a second penalty associated with the lower. 15.
(16) Research Institute of Applied Economics Regional Quantitative Analysis Research Group. Working Paper 2013/07, pàg. 16 Working Paper 2013/04, pag. 16. returns they obtain because of the discrepancies between workers’ actual years of education and the level of education required for performing their job, that is considerably larger than that for their formal counterparts.. 4.2 Quantile regressions The OLS results provide the return estimates at the mean of the wage distribution, which may be hiding important differences in the return estimates at different points of the wage distribution. Table 4 presents the quantile regressions results obtained from estimating the Mincerian wage equation - eq. (3) - in the upper panel and the ORU wage equation - eq. (4) – in the lower panel. Both equations were estimated using all set of controls (dummy variables for marital status, head of household, occupation, contract signed, size of the firm, sector industry, hours worked and metropolitan area). 10 To facilitate the comparison of results at the different quantiles with those at the average, results of the OLS estimates are reproduced in the first group of columns in Table 4. The results reveal that schooling is not uniformly rewarded in the labour market along the wage distribution. More specifically, the return to actual education (upper panel of Table 4) increases along the wage distribution for formal workers, while a comparable pattern is not observable for informal workers. These results suggest that education may be a strong source of overall wage dispersion in the case of formal workers, while it seems to be weak for informal workers. However, education contributes to generate important wage differentials among formal and informal workers. Under the observed wage structures, more years of schooling would make the distribution of formal wages more disperse, but informal workers wages´ dispersion would not experience any significant increase. Interestingly, the difference in the return to actual education for formal and informal workers in the 25th quantile is minimal (4.61 per cent versus 3.23 per cent), while at the 75th quantile the return to actual education for formal workers is around three times higher than that for informal workers (9.99 per cent versus 3.39 per cent). That the returns to education for formal workers in the 25th quantile are very similar to those of informal workers counterparts can be the result of the existence of a minimum wage, binding only for the formal sector, which could be imposing an important distortion to the returns to education to formal sector workers at this part of the distribution. 10. Similar results were obtained with the simple specification that does not include the additional set of controls. They are available from the authors.. 16.
(17) Research Institute of Applied Economics Regional Quantitative Analysis Research Group. Working Paper 2013/07, pàg. 17 Working Paper 2013/04, pag. 17. The results obtained for the ORU specification in eq. 4 (bottom panel of Table 4) show that the behaviour of the returns to required education resembles that of actual education: they increase substantially along the wage distribution for formal workers, but only experience a moderate change for informal workers. Remarkably, results also suggest that the returns to surplus education behave similarly, increasing along the wage distribution for formal workers and remaining almost constant across the different quantiles for informal workers. In turn, the pattern of the penalty associated to deficit education is different for formal and informal workers, although the order of magnitude of the difference in this case is much lower than for required and surplus education. A clearer picture of these patterns is obtained by plotting the estimated returns at each percentile for formal and informal workers as in Figure 1. As it can be seen, returns to education are not homogenous along the wage distribution and this heterogeneous behaviour is very different for formal and informal workers. A more detailed inspection of the lower panel of Table 4 reveals additional key information. For instance, differences in the educational returns between formal and informal workers with the same educational-occupational mismatching are present at the 25th quantile, although less sizeable than the differences presented in the 75th quantile. Formal workers that possess the education required to do their job have a higher return to their education, slightly higher in the lowest quantile and more than double in the upper. An overeducated formal worker in the lower part of the distribution obtain a return of his years of surplus education similar to the return obtained by an informal worker for the years of education required to perform his job, 4.46 per cent and 4.73 per cent respectively. Meanwhile the returns to surplus education for formal workers at 75th quantile of the distribution are larger than the returns to required education for informal workers, 9.63 per cent and 5.65 per cent correspondingly. Summing up, the results from the quantile regression lead to the conclusion that formal workers are able to obtain a higher reward for their education even in the presence of educational mismatch, and this is so along all the wage distribution. Furthermore, the returns to surplus education increase considerably for formal workers along the wage distribution suggesting that this type of jobs represents better employment opportunities for overeducated workers. This probably reflects the fact that formal workers may take advantage of the higher productivity 11 that is present 11. The productivity of formal firms could be higher than that of informal firms because a higher capital-labour ratio caused by the fact that informal firms may have less access to credit (Amaral and Quintin, 2006). Another reason is that informal firms continue to operate at a small size that allows them to scape from government control and, therefore, cannot exploit possible economies of scale.. 17.
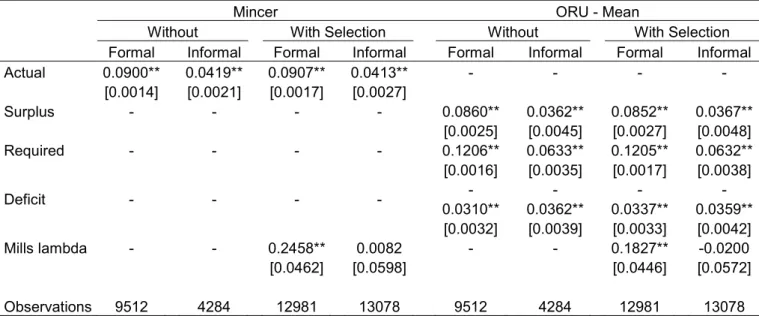
(18) Research Institute of Applied Economics Regional Quantitative Analysis Research Group. Working Paper 2013/07, pàg. 18 Working Paper 2013/04, pag. 18. in formal jobs, which may boost the returns to education. Meanwhile, informal workers receive a lower remuneration to their education compared to the one obtained by their formal peers. This difference in returns to education between formal and informal workers is even more accentuated in the upper part of the distribution. More importantly, informal overeducated workers do not face higher returns once they move up the wage distribution, implying that informal jobs may constraint the use of education and its returns.. 4.3 Sample selection Our estimates of the wage equations, when taking into account that unobservable variables might influence both wages and the choice of formal/informal employment, are summarized in Table 5 for the estimates at the mean. These results correspond to estimates of the wage equations augmented by a selection correction term for each sector, using the presence of children in the household and the average number of years of schooling of other household members as instruments for assignment into the formal or informal sector. The reason for choosing these selection variables is motivated by the fact that they should contain household-specific characteristics that influence an individual’s choice regarding formal or informal employment, but at the same time have no direct impact on the earning potentials of individuals (Günther and Launov, 2012 use similar variables as exclusions restrictions). As it can be seen, once the selectivity is corrected the returns to schooling remains higher for formal workers in the two wage equations estimated (Mincer and ORU). It is important to note that the selection term (Mills lambda) is positive and statistically significant for formal workers. This result can be interpreted as follows: a worker that has a higher probability of working in the informal sector, due to his observable characteristics, could end up working in the formal sector thanks to unobservable factors (for example, job-search networks or ability) and gets a higher return to his education (Tannuri-Pianto, Pianto, and Arias, 2004 find a similar result for Bolivia). In the case of informal workers the selection term is insignificantly different from zero. This implies that there is no correlation between the error terms of the selection equation in (5) and that of the wage equation for informal workers, and thus that the estimates given in Table 2 for informal workers are indeed unbiased.. 18.
(19) Research Institute of Applied Economics Regional Quantitative Analysis Research Group. Working Paper 2013/07, pàg. 19 Working Paper 2013/04, pag. 19. We also re-estimate the quantile regressions of eq. (3) and eq. (4) introducing the inverse of the Mills’s ratio and its square, following the Buchinsky (1998) procedure for correcting for selection bias. The results are presented in Table 6. It can be observed that the pattern of estimated returns and differences between formal and informal workers reported and discussed in the previous section do not vary significantly when selection is accounted for. All in all, from these results we can assert that the major conclusion on the higher penalty associated to educational mismatch for informal workers remains when controlling for the correlation between the error terms in the selection and the wage equations.. 5. Conclusions There is now substantial body of literature addressing the wage gap between formal and informal workers for developing countries, theoretically and empirically. In empirical analyses wage equations are estimated for each group of workers, where one of the key factors is education (and its returns). There are papers that have gone beyond the difference in the mean, finding that the wage gap is not stable along the wage distribution, estimating quantile regressions. Some works have questioned the existence of a wage gap (that is, market segmentation) given the endogeneity caused by unobservable characteristics of the individuals, such as skills. As far as we know there is no study that considered the fact that education-occupation mismatching is present in both formal and informal sector, and that this may be driving, at least in part, the formal/informal wage gap. In this paper we have re-examined the wage gap between formal and informal workers taking into consideration that education-occupation mismatch is present in both sectors, using the case study of Colombia. Results for Colombia show that formal workers have a higher return to their education, around double, compared with their informal counterparts. They also indicate that these returns vary along the wage distribution and that the pattern of variation along the distribution is not the same for formal and informal workers. But on the top of that, the main claim in this paper is that important information to the analysis of the formal–informal wage gap is obtained by adding measures of educational mismatch. In particular, we showed that the returns to required education in the informal sector are not only lower, but the penalty that informal workers face due to educational mismatches in terms of wages are considerable higher than the one faced by their. 19.
(20) Research Institute of Applied Economics Regional Quantitative Analysis Research Group. Working Paper 2013/07, pàg. 20 Working Paper 2013/04, pag. 20. formal counterparts. Therefore, we can conclude that there is a second penalty associated with educational mismatches that puts informal workers at a greater disadvantage compare to formal workers. If labour market segmentation is what is driving the existence of overeducation in a developing country, as Herrera-Idárraga, López-Bazo, and Motellón (2012) claim that it may be the case, then policies engaged with reducing informality could also have other positive effects apart from those commonly known, better quality jobs. Reducing informality may reduce the situation where a highly schooled worker takes a job with low-skill requirements and consequent a low pay. This evidence should be taken into consideration when assessing the issue of informality in the labour market of developing countries since it is likely to affect the allocation of skilled and unskilled workers in formal and informal jobs, and the incentives to accumulate education.. 20.
(21) Research Institute of Applied Economics Regional Quantitative Analysis Research Group. Working Paper 2013/07, pàg. 21 Working Paper 2013/04, pag. 21. References Abbas, Q. (2008). Over-education and under-education and their effects on earnings: Evidence from Pakistan, 1998–2004. SAARC Journal of Human Resource Development, 4, 109–125. Alba-Ramírez, A. (1993). Mismatch in the Spanish labor market: Overeducation? The Journal of Human Resources, 28, 259–278. Albrecht, J., van Vuuren, A., & Vroman, S. (2009). Counterfactual distributions with sample selection adjustments: Econometric theory and an application to the Netherlands. Labour Economics, 16, 383–396. Alpin, C., Shackleton, J. R., & Walsh, S. (1998). Over- and undereducation in the UK graduate labour market. Studies in Higher Education, 23, 17–34. Amaral, P. S., & Quintin, E. (2006). A competitive model of the informal sector. Journal of Monetary Economics, 53, 1541–1553. Amuedo-Dorantes, C. (2004). Determinants and poverty implications of informal sector work in Chile. Economic Development and Cultural Change, 52, 347–368. Arango, L. E., Herrera, P., & Posada C. E. (2008). El salario mínimo: Aspectos generales sobre los casos de Colombia y otros países. Ensayos sobre Política Económica, 26, 204–263. Badaoui, E., Strobl, E., & Walsh, F. (2008). Is there an informal employment wage penalty? Evidence from South Africa. Economic Development and Cultural Change, 56, 683–710. Bauer, T. K. (2002). Educational mismatch and wages: A panel analysis. Economics of Education Review, 21, 221–229. Bosh, M., & Maloney, W. F. (2010). Comparative analysis of labor market dynamics using Markov processes: An application to informality. Labour Economics, 17, 621–631. Botelho, F., & Ponczek, V. (2011). Segmentation in the brazilian labor market. Economic Development and Cultural Change, 59, 437–463. Büchel, F., & van Ham, M. (2003). Overeducation, regional labor markets, and spatial flexibility. Journal of Urban Economics, 53, 482–493. Buchinsky, M. (1998). The dynamics of changes in the female wage distribution in the USA: A quantile regression approach. Journal of Applied Econometrics, 13, 1-30. Castillo, M. (2007). Desajuste educativo por regiones en Colombia: ¿Competencia por salarios o por puestos de trabajo? Revista Cuadernos de Economía, 26, 107–145. Chevalier, A. (2003). Measuring Over-education. Economica, 70, 509–531. Chiswick, B. R., & Miller, P. W. (2008). Why is the payoff to schooling smaller for immigrants? Labour Economics, 15, 1317–1340.. 21.
(22) Research Institute of Applied Economics Regional Quantitative Analysis Research Group. Working Paper 2013/07, pàg. 22 Working Paper 2013/04, pag. 22. de la Rica, S., Dolado, J. J., & Llorens, V. (2008). Ceilings or floors? Gender wage gaps by education in Spain. Journal of Population Economics, 21, 751–776. Dolton, P., & Vignoles, A. (2000). The incidence and effects of overeducation in the U.K. graduate labour market. Economics of Education Review, 19, 179–198. Dominguez-Moreno, J. A. (2009). Sobreeducación en el Mercado Laboral Urbano de Colombia para el Año 2006. Revista Sociedad y Economía, 16, 139–158. Duncan, G. J., & Hoffman, S. D. (1981). The incidence and wage effects of overeducation. Economics of Education Review, 1, 75–86. Fields, G. S. (1975). Rural-urban migration, urban unemployment and underemployment, and jobsearch activity in LDCs. Journal of Development Economics, 2, 165–187. , C. E. (2002). The Function of the Urban Informal Sector in Employment: Evidence from Colombia 1984-2000. Documento CEDE no. 2002-04. , DC: Universidad de Los Andes. Garcia, J., Hernández, P. J., & López-Nicolás, A. (2001). How wide is the gap? An investigation of gender wage differences using quantile regression. Empirical Economics, 26, 149–167. Gindling, T. H. (1991). Labor Market Segmentation and the Determination of Wages in the Public, Private-Formal, and Informal Sectors in San José, Costa Rica. Economic Development and Cultural Change, 39, 585–605. Gong, X., & van Soest, A. (2002). Wage Differentials and Mobility in the Urban Labor Market: A Panel Data Analysis for Mexico. Labour Economics, 9, 513–529. Green, F., McIntosh, S., & Vignoles, A. (2002). The Utilization of Education and Skills: Evidence from Britain. The Manchester School, 70, 792–811. Groot, W., & van den Brink, H. M. (2000). Skill mismatches in the Dutch labor market. International Journal of Manpower, 21, 584–595. Günther, I., & Launov A. (2012). Informal employment in developing countries: Opportunity or last resort? Journal of Development Economics, 97, 88–98. Hartog, J., & Oosterbeek, H. (1988). Education, allocation and earnings in the Netherlands: Overschooling? Economics of Education Review, 7, 185–194. Heckman, J. J. (1979). Sample selection bias as a specification error. Econometrica, 47, 153–161. Herrera-Idárraga, P., López-Bazo, E., & Motellón, E. (2012). Informality and Overeducation in the Labor Market of a Developing Country. XREAP Working Papers 20/2012. International Labour Organization. (2011). 2011 Labour Overview: Latin America and the Caribbean. Geneva: International Labour Office. Kiker, B. F., Santos, M. C., & Mendes de Oliveira, M. (1997). Overeducation and undereducation: Evidence for Portugal. Economics of Education Review, 16, 111–125.. 22.
(23) Research Institute of Applied Economics Regional Quantitative Analysis Research Group. Working Paper 2013/07, pàg. 23 Working Paper 2013/04, pag. 23. Kugler, A., & Kugler, M. 2009. Labor market effects of payroll taxes in a in developing countries: Evidence from Colombia. Economic Development and Cultural Change, 57, 335–358. Leuven, E., & Oosterbeek, H. (2011). Overeducation and mismatch in the labor market. In E. A. Hanushek, S. Machin, & L. Woessmann (Eds.), Handbook of the Economics of Education, Vol. 4 (283–326). Amsterdam: Elsevier Science. Magnac, T. (1991). Segmented or competitive labor markets. Econometrica, 59, 165–187. Maloney, W. F. (1999). Does Informality Imply Segmentation in Urban Labor Markets? Evidence from Sectoral Transitions in Mexico. World Bank Economic Review, 13, 275–302. ez, J. (2004). Measuring the impact of minimum wages: Evidence from Latin America. In J. J. Heckman & C. Pagés (Eds.), Law and Employment: Lessons from Latin America and the Caribbean(109–130). Chicago: University of Chicago Press. Marcouiller, D., Ruiz de Castilla, V., & Woodruff, C. (1997). Formal Measures of the InformalSector Wage Gap in Mexico, El Salvador, and Peru. Economic Development and Cultural Change, 45, 367–392. McGoldrick, K., & Robst, J. (1996). Gender differences in overeducation: A test of the theory of differential overqualification. American Economic Review, 86, 280–284. McGuinness, S. (2006). Overeducation in the labour market. Journal of Economic Surveys, 20, 387–418. Mehta, A., Felipe, J., Quising, P., & Camingue, S. (2011). Overeducation in developing economies: How can we test for it, and what does it mean? Economics of Education Review, 30, 1334–1347. Mendes de Oliveira, M., Santos, M. C., & Kiker, B. F. (2000). The role of human capital and technological change in overeducation. Economics of Education Review, 19, 199–206. Mondragón-Veléz, C., Peña, X., & Wills, D. (2010). Labor market rigidities and informality in Colombia. Economia, 11, 65-101. Mora, J. J. (2005) (Colombia). ¿Desequilibrio temporal o permanente?: Algunas ideas, 2000-2003. Documentos Laborales y Ocupacionales, 2 , SENA. , J. A. (2002). .. , 210.. Organisation for Economic Co-operation and Development. (2011). OECD Employment Outlook 2011. OECD Publishing. Perry, G. E., Maloney, W. F., Arias, O. S., Fajnzylber, P., Mason, A. D., & Saavedra-Chanduvi, J. (2007). Informality: Exit and exclusion. Washington, DC: World Bank. Pradhan, M., & van Soest, A. (1995). Formal and informal sector employment in urban areas of Bolivia. Labour Economics, 2, 275–297. Pratap, S., & Quintin, E. (2006). Are labor markets segmented in developing countries? A semiparametric approach. European Economic Review, 50, 1817–1841.. 23.
(24) Research Institute of Applied Economics Regional Quantitative Analysis Research Group. Working Paper 2013/07, pàg. 24 Working Paper 2013/04, pag. 24. Quinn, M. A., & Rubb, S. (2006). Mexico's labor market: The importance of education-occupation matching on wages and productivity in developing countries. Economics of Education Review, 25, 147–156. Ren, W., & Miller, P. W. (2012). Gender Differentials in the Payoff to Schooling in Rural China. The Journal of Development Studies, 48, 133–150. Sicherman, N. (1991). “Overeducation” in the labor market. Journal of Labor Economics, 9, 101– 122. Tannuri-Pianto, M. E., Pianto, D. M., & Arias, O. (2004). Informal employment in Bolivia: A Lost proposition? World Bank, mimeo. Tansel, A. (2000). Formal versus informal sector choice of wage earners and their wages in Turkey. In T. Bulutay (Ed.), Informal Sector (I) (125-146). Ankara: State Institute of Statistics, Printing Division. Tokman, V. (1982). Unequal development and the absorption of labour: Latin America 1950–1980. CEPAL Review, 17, 121–33. Tsang, M. C., Rumberger, R. W., & Levin, H. M. (1991). The Impact of surplus schooling on worker productivity. Industrial Relations: A Journal of Economy and Society, 30, 209–228. Verdugo, R., & Verdugo, N. T. (1989). The Impact of Surplus Schooling on Earnings: Some Additional Findings. Journal of Human Resources, 24, 629–643.. 24.
(25) Research Institute of Applied Economics Regional Quantitative Analysis Research Group. Working Paper 2013/07, pàg. 25 Working Paper 2013/04, pag. 25. Table 1. Gross hourly wage gap at the mean and at different quantiles Mean All Mean sd Overeducated 4627.06 3847.00 Correct 3588.28 2747.15 Undereducated 2665.47 1364.69 Total 3662.58 2894.68. Formal Mean sd 5170.34 4116.13 4125.16 3007.49 3131.68 1443.82 4240.56 3193.62. Informal Mean sd 2714.70 1602.93 2366.05 1409.71 2197.83 1097.70 2379.11 1396.24. wf/wi 1.90 1.74 1.42 1.78. All 2503.47 2333.33 1944.45 2333.33. Formal 2503.47 2503.47 2417.59 2503.47. Informal 1944.45 1600.00 1555.56 1633.33. wf/wi 1.29 1.56 1.55 1.53. All 3111.11 2700.35 2503.47 2722.22. Formal 3402.78 3004.17 2654.46 3004.17. Informal 2434.78 2187.50 2097.62 2216.67. wf/wi 1.40 1.37 1.27 1.36. Formal 6003.47 4375.00 3402.78 4612.03. Informal 2986.67 2722.22 2561.36 2731.06. wf/wi 2.01 1.61 1.33 1.69. Quantiles Lower - q25 Overeducated Correct Undereducated Total Middle - q50 Overeducated Correct Undereducated Total Higher - q75 All Overeducated 5185.19 Correct 3888.89 Undereducated 3004.17 Total 3888.89 Note: Gross hourly wage in pesos.. 25.
(26) Research Institute of Applied Economics Regional Quantitative Analysis Research Group. Working Paper 2013/07, pàg. 26 Working Paper 2013/04, pag. 26. Table 2. Descriptive statistics for the main variables in the analysis Total. Formal. Informal. Mean. Std. Dev.. Mean. Std. Dev.. Mean. Std. Dev.. 3662.58. 2894.68. 4240.56. 3193.62. 2379.11. 1396.24. Formal. 0.69. 0.46. -. -. -. -. Overeducated. 0.16. 0.36. 0.18. 0.38. 0.11. 0.31. Correct. 0.75. 0.43. 0.76. 0.43. 0.74. 0.44. Undereducated. 0.09. 0.29. 0.07. 0.25. 0.15. 0.36. Basic Primary or below. 0.14. 0.34. 0.09. 0.28. 0.25. 0.43. Basic secondary. 0.13. 0.34. 0.09. 0.29. 0.22. 0.42. Secondary. 0.37. 0.48. 0.38. 0.48. 0.36. 0.48. Higher education or more. 0.36. 0.48. 0.44. 0.50. 0.16. 0.37. Gross hourly wage (pesos). Educational Attainment. Education (years). 10.86. 3.82. 11.73. 3.56. 8.92. 3.65. Age (years). 33.83. 10.23. 34.64. 9.73. 32.03. 11.03. Experience (years). 17.97. 11.47. 17.91. 11. 18.11. 12.45. Tenure (months). 47.75. 66.21. 57.7. 72.7. 25.67. 40.93. Women. 0.43. 0.49. 0.44. 0.5. 0.41. 0.49. Married. 0.52. 0.5. 0.55. 0.5. 0.46. 0.5. Household head. 0.43. 0.49. 0.45. 0.50. 0.38. 0.48. Occupation Unskilled. 0.31. 0.46. 0.26. 0.44. 0.43. 0.5. Professionals and Technicians 1. 0.07. 0.25. 0.09. 0.28. 0.02. 0.13. Professionals and Technicians 2. 0.04. 0.2. 0.05. 0.22. 0.03. 0.18. Managers and Public Officials. 0.03. 0.17. 0.03. 0.18. 0.02. 0.13. Administrative Staff. 0.21. 0.4. 0.24. 0.43. 0.12. 0.33. Merchant and Vendor. 0.16. 0.37. 0.15. 0.36. 0.18. 0.39. Service Worker. 0.18. 0.39. 0.18. 0.38. 0.20. 0.4 0.43. Type of contract No contract. 0.29. 0.08. 0.05. 0.06. 0.82. Permanent. 0.48. 0.50. 0.65. 0.48. 0.10. 0.3. Temporal. 0.23. 0.42. 0.30. 0.46. 0.08. 0.27. Hours of work (per week). 50.54. 10.59. 49.96. 9.17. 51.82. 13.13. Micro (1-10 workers). 0.33. 0.47. 0.14. 0.35. 0.74. 0.44. Small (11 - 50 workers). 0.2. 0.4. 0.21. 0.41. 0.16. 0.37. Medium (51- 100 workers). 0.06. 0.23. 0.08. 0.26. 0.02. 0.14. Large (101 workers or more). 0.42. 0.49. 0.57. 0.49. 0.08. 0.27. Agricultural, mining, electricity, gas and water. 0.03. 0.16. 0.03. 0.18. 0.01. 0.11. Industry. 0.23. 0.42. 0.23. 0.42. 0.22. 0.42. Firm size. Sector. Construction. 0.07. 0.26. 0.04. 0.21. 0.13. 0.34. Sales, Hotels and Restaurants. 0.29. 0.45. 0.24. 0.43. 0.41. 0.49. Transportation. 0.09. 0.28. 0.1. 0.29. 0.07. 0.25. Financial Intermediation. 0.12. 0.32. 0.15. 0.35. 0.06. 0.23. Social Services. 0.18. 0.38. 0.21. 0.41. 0.1. Observations. 13797. 26. 9513. 0.31 4284.
(27) Research Institute of Applied Economics Regional Quantitative Analysis Research Group. Working Paper 2013/07, pàg. 27 Working Paper 2013/04, pag. 27. Notes: Figures are in percentages, excepting gross hourly wage, education, age, experience and tenure, whose units of measurement are indicated in parenthesis.. Table 3. Returns to years of education. Mincer and ORU models Mincer. ORU - Mean. [1]. [2]. [1]. Formal 0.1008** [0.0014] -. Informal 0.0543** [0.0023] -. Formal 0.0900** [0.0014] -. Informal 0.0419** [0.0021] -. Required. -. -. -. -. Deficit. -. -. -. -. Actual Surplus. [2]. Formal -. Informal -. Formal -. Informal -. 0.0931** [0.0028] 0.1323** [0.0017] 0.0336** [0.0035]. 0.0416** [0.0052] 0.0763** [0.0034] 0.0468** [0.0044]. 0.0860** [0.0025] 0.1206** [0.0016] 0.0310** [0.0032]. 0.0362** [0.0045] 0.0633** [0.0035] 0.0362** [0.0039]. Observations 9512 4284 9512 4284 9512 4284 9512 F-statistic 1014.1 125.5 284.2556 72.61156 996.3 106.1 328.2 R squared (adj.) 0.39 0.15 0.5031264 0.3624394 0.46 0.16 0.55 Notes: [1] = experience (and its square), tenure (and its square) and gender are included as controls. [2] = [1] + marital status, head of household, hours worked, type of contract, size of the firm, sector region are included as controls. Standard errors in [].+ p<0.1, * p<0.05, ** p<0.01.. 27. 4284 71.2 0.37 and.
(28) Research Institute of Applied Economics Regional Quantitative Analysis Research Group. Working Paper 2013/07, pàg. 28 Working Paper 2013/04, pag. 28. Table 4. Returns to years of education at the mean and at various quantiles OLS. Actual. Surplus Required. Deficit. Formal 0.0900** [0.0014]. Informal 0.0419** [0.0021]. QR 25 Formal Informal 0.0461** 0.0323** [0.0009] [0.0029]. 0.0860** [0.0025] 0.1206** [0.0016] 0.0310** [0.0032]. 0.0362** [0.0045] 0.0633** [0.0035] 0.0362** [0.0039]. 0.0446** [0.0019] 0.0685** [0.0011] 0.0232** [0.0025]. 0.0298** [0.0058] 0.0473** [0.0044] 0.0307** [0.0051]. QR QR 50 Formal Informal 0.0771** 0.0321** [0.0017] [0.0021]. QR 75 Formal Informal 0.0999** 0.0339** [0.0025] [0.0018]. 0.0710** [0.0026] 0.1081** [0.0016] 0.0223** [0.0032]. 0.0963** [0.0034] 0.1375** [0.0023] 0.0188** [0.0039]. 0.0323** [0.0039] 0.0501** [0.0030] 0.0261** [0.0033]. 0.0306** [0.0036] 0.0565** [0.0029] 0.0281** [0.0031]. N 9512 4284 9512 4284 9512 4284 9512 4284 Notes: Experience (and its square), tenure (and its square), gender, marital status, head of household, hours worked, type of contract, size of the firm, sector and region are included as controls in all regressions. Standard errors in [].+ p<0.1, * p<0.05, ** p<0.01.. 28.
(29) Research Institute of Applied Economics Regional Quantitative Analysis Research Group. Working Paper 2013/07, pàg. 29 Working Paper 2013/04, pag. 29. Table 5. Returns to years of education. Mincer and ORU models – Correcting for selection. Actual Surplus. Mincer Without With Selection Formal Informal Formal Informal 0.0900** 0.0419** 0.0907** 0.0413** [0.0014] [0.0021] [0.0017] [0.0027] -. Required. -. -. -. -. Deficit. -. -. -. -. Mills lambda. -. -. 0.2458** [0.0462]. 0.0082 [0.0598]. ORU - Mean Without With Selection Formal Informal Formal Informal 0.0860** [0.0025] 0.1206** [0.0016] 0.0310** [0.0032] -. 0.0362** [0.0045] 0.0633** [0.0035] 0.0362** [0.0039] -. 0.0852** [0.0027] 0.1205** [0.0017] 0.0337** [0.0033] 0.1827** [0.0446]. 0.0367** [0.0048] 0.0632** [0.0038] 0.0359** [0.0042] -0.0200 [0.0572]. Observations 9512 4284 12981 13078 9512 4284 12981 13078 Notes: Experience (and its square), tenure (and its square), gender, marital status, head of household, hours worked, type of contract, size of the firm, sector and region are included as controls in all regressions. Standard errors in [].+ p<0.1, * p<0.05, ** p<0.01.. 29.
(30) Research Institute of Applied Economics Regional Quantitative Analysis Research Group. Working Paper 2013/07, pàg. 30 Working Paper 2013/04, pag. 30. Table 6. Returns to years of education at the mean and at various quantiles – Correcting for selection OLS. Actual. Mills lambda 1 Mills lambda 2. Surplus Required. Deficit. Mills lambda 1 Mills lambda 2. Formal 0.0907** [0.0017]. Informal 0.0413** [0.0027]. 0.2458** [0.0462]. 0.0082 [0.0598]. -. -. 0.0852** [0.0027] 0.1205** [0.0017] 0.0337** [0.0033]. 0.0367** [0.0048] 0.0632** [0.0038] 0.0359** [0.0042]. 0.1827** [0.0446]. -0.0200 [0.0572]. -. -. QR 25 Formal Informal 0.0489** 0.0367** [0.0008] [0.0037]. QR 75 Formal Informal 0.1057** 0.0332** [0.0029] [0.0029]. 0.3671** [0.0970]. 0.7524** [0.1456]. -0.1255 [0.1423]. 0.0495* [0.0206]. -0.1109* [0.0515]. 0.0503 [0.0309]. 0.0049 [0.0037]. 0.0398** [0.0039] 0.0557** [0.0031] 0.0312** [0.0034]. 0.0987** [0.0036] 0.1433** [0.0025] 0.0279** [0.0041]. 0.0320** [0.0040] 0.0590** [0.0034] 0.0281** [0.0035]. -0.4087* [0.1919]. 0.5327** [0.0421]. 0.4296** [0.1089]. 0.0501 [0.0386]. 0.2798** [0.0253]. 0.0618** [0.0230]. 0.6495** [0.0525] 0.1419** [0.0177]. -0.4065* [0.1777]. 0.0488** [0.0019] 0.0720** [0.0011] 0.0277** [0.0024]. 0.0363** [0.0069] 0.0516** [0.0055] 0.0337** [0.0062]. 0.6735** [0.0600] 0.1491** [0.0203]. QR QR 50 Formal Informal 0.0802** 0.0373** [0.0016] [0.0020]. 0.0454 [0.0359]. 0.7126** [0.0892] 0.1122** [0.0310] 0.0587** [0.0031] 0.0969** [0.0017]. 0.8644** [0.1100] 0.2020** [0.0391]. 0.1977+ [0.1137] 0.0602* [0.0247]. N 8955 3997 8955 3997 8955 3997 8955 3997 Notes: Experience (and its square), tenure (and its square), gender, marital status, head of household, hours worked, type of contract, size of the firm, sector and region are included as controls in all regressions. Standard errors in [].+ p<0.1, * p<0.05, ** p<0.01.. 30.
(31) Research Institute of Applied Economics Regional Quantitative Analysis Research Group. Working Paper 2013/07, pàg. 31 Working Paper 2013/04, pag. 31. Figure 1. Returns to surplus-required-deficit years of education over the entire distribution Formal. Informal. 31.
(32) Research Institute of Applied Economics Regional Quantitative Analysis Research Group. Working Paper 2013/07, pàg. 32 Working Paper 2013/04, pag. 32. 32.
(33)
Figure


+4


Documento similar