UNIVERSIDAD DE VALLADOLID
INSTITUTO DE OFTAMOBIOLOGIA APLICADA
Influencia de los Factores Ambientales
en los Tests Diagnósticos del Síndrome de Ojo Seco:
Estudio en una Cámara de Ambiente Controlado
Influencia de los Factores Ambientales
en los Tests Diagnósticos del Síndrome de Ojo Seco:
Estudio en una Cámara de Ambiente Controlado
Influencia de los Factores
Ambientales
en los T
ests Diagnósticos del Síndrome de Ojo Seco:
Estudio en una Cámara de
Ambiente Controlado
Marisa
Tesón
Y
udego
Tesis Doctoral
2013
TESIS DOCTORAL
INFLUENCIA DE LOS FACTORES AMBIENTALES EN LOS
TESTS DIAGNÓSTICOS DEL SÍNDROME DE OJO SECO:
ESTUDIO EN UNA CÁMARA DE AMBIENTE CONTROLADO
(Influence of environmental factors on the diagnostic tests of dry
eye syndrome: study in a controlled environmental chamber)
Presentada por MARÍA LUISA TESÓN YUDEGO para optar al grado de Doctora por la Universidad de Valladolid.
Dirigida por:
AGRADECIMIENTOS
Ahora soy verdaderamente consciente de que estoy ante las palabras más difíciles que he tenido que escribir en toda la tesis (¡qué razón tenías, Laura!); sin embargo, las considero también las más necesarias y sin las que todo lo que viene detrás carecería de esencia y de piel.
Hace unos días tuve la oportunidad de leer un artículo titulado “Investigadores: entre el tesón y la creatividad”, en el que hacían referencia a un ensayo publicado hace ya más de una década por Francisco Ponz, rector de la Universidad de Navarra entre 1966 y 1979, titulado “¿Para qué sirve un doctorado?”. En aquél ensayo aseguraba
que “durante la realización de una investigación se cultiva el amor a la verdad y, en su servicio, se ejercita la mente, se espolea la creatividad y se pone a prueba el tesón”. Decía también que con la investigación “se aprende a reflexionar, al pensar sereno y profundo, a relacionar conocimientos, a examinar las cuestiones desde distintas perspectivas”. Y añadía: “No se desea conocer para disparar respuestas ante las preguntas de un examen o de un concurso de televisión, sino para asimilar los conocimientos y usarlos con buen sentido”. Ahora que estoy al final de éste maravilloso y duro camino, no podría encontrar palabras que expresaran mejor lo que ha supuesto para mí, tanto a nivel intelectual como personal recorrerlo y haber llegado hasta aquí.
La Real Academia Española define el tesón como “decisión y perseverancia que se ponen en la ejecución de algo”, y su lista interminable de sinónimos engloba palabras como: firmeza, constancia, perseverancia, empuje, tenacidad, empeño, paciencia, ahínco, valentía, afán, esfuerzo, desvelo, dinamismo, interés, voluntad, dedicación o constancia. Siempre he puesto mucho “Tesón” en todos los aspectos de mi vida y me siento especialmente orgullosa por ser así y por tener un apellido con tanta fuerza (¡gracias, papá!).
he puesto a prueba mi tesón, y sé que sin él no habría llegado hasta aquí…pero el mayor valor y aprendizaje me lo han dado todas y cada una de aquellas personas que me han rodeado y acompañado durante este viaje de más de cuatro años… Son esas personas que han caminado día a día a mi lado, haciéndome avanzar cuando ya no me quedaban fuerzas, ayudándome a conocerme a mi misma y animándome a seguir adelante. Son esas personas que se preocupan por ti, que te aguantan lo inaguantable y te perdonan lo imperdonable, que celebran contigo llegar al final de cada uno de los pasitos que das y están a tu lado haciendo el tonto para sacarte una sonrisa cuando el día no ha sido el mejor de la semana… TODAS y cada una de ellas me han enseñado algo. TODAS y cada una de ellas me han hecho crecer como investigadora pero especialmente como persona. A TODAS ELLAS GRACIAS.
No me gustaría olvidarme de nadie pero ya me conocéis y sabéis que soy un poco despistada, por eso pido disculpas de corazón si olvido a alguien. ¡Prepararos porque va a ser largo!
No podría empezar por nadie que no fuera mi directora Marga, por todo su cariño, confianza e inagotable paciencia. Por enseñarme a no ponerme límites y a confiar en mí misma. Por haberme dejado formar parte de ese gran grupo llamado GSO, del que ella, sin ninguna duda, es el alma. Por mostrarme que la investigación y la vida son un constante descubrimiento, y por creer en mí. GRACIAS.
A mi directora María, por haber sido la antecesora en este mundo del “ambiente controlado” y especialmente por brindarme la oportunidad, hace ya más de seis años, de formar parte de este maravilloso mundo de la investigación que me ha permitido cumplir este sueño. GRACIAS.
Al Dr. Michael E. Stern, por su confianza, cariño y apoyo, por tener siempre una sonrisa para mí junto a una inconmesurable paciencia con mi “spanghish”… y por ver más allá de mí profesionalmente de lo que siempre han visto mis ojos. GRACIAS.
Este viaje no hubiera sido posible sin alguien muy especial y valioso, tanto humana como profesionalmente. Me estoy refiriendo a Alberto López Miguel, esa gran persona que ha vivido a mi lado en una cámara durante dos años velando porque todo fuera bien. Él no sólo ha sido un compañero ya desde la carrera, sino mi segunda mano derecha porque yo tan sólo tengo dos y no me hubiera llegado sólo con las mías, pero sobre todo, porque ha sido y siempre será un gran amigo. Por todas las experiencias vividas juntos, desde nuestros cafés y charlas sentados en el suelo muertos de frío esperando a oír pitar el “timer”, hasta las incontables horas trabajando delante del ordenador mano a mano para hacer de esta tesis una realidad, sin olvidar momentos estelares como el titulado ¡achicando agua! Estar ahora mismo aquí no hubiera sido posible sin toda tu ayuda. De todo corazón, GRACIAS.
¡Y qué decir de ese canario con “acento raro y tan salao”, como decían nuestros pacientes, llamado Vicente, que bajaba siempre a la carrera para ser mi segunda mano izquierda! Muchísimas gracias por toda tu ayuda, ¡desde el capilar de 4µl hasta “¡pon parafilm, quita parafilm!”, pero sobre todo, por esas risas, esa alegría que no tiene parangón y esos buenos ratos que nos has hecho pasar tanto a los pacientes como a Alberto y a mí, que conseguían que a todos las horas nos parecieran más cortas y que el cansancio no pesara tanto. GRACIAS.
Y por supuesto, quiero dar las gracias a cada una de aquellas personas que han colaborado voluntaria y desinteresadamente en esta investigación y sin los cuáles nada de esto tendría sentido. GRACIAS.
Hace ya más de seis años que llegué al IOBA. Por aquél entonces, yo era “esa chica nueva que es no sé qué de optometrista que está en un cuartito del sótano”. Doy GRACIAS porque la vida, el destino, el karma o como cada uno quiera llamarlo, me hiciera llegar a ese cuartito donde me encontré a una de las mejores personas que he conocido en mi vida, tanto profesional como personalmente…Jenice. GRACIAS por haberme acogido con los brazos abiertos, GRACIAS por todo lo que hemos vivido juntas, GRACIAS por cada “¡madrina!” de Natalia que hace que se me ilumine la cara, GRACIAS por ser mi amiga.
A este “casi sólo chicas”, fueron llegando poco a poco nuevos miembros, ¡algunos incluso de mi misma especie! ese super José, que siempre me arrancaba una sonrisa cuando de repente me hacía un “dile que no”; el increíble Toni, nuestro hombre “híbrido”, capaz de darte el mejor consejo del mundo mientras te soluciona tu quebradero de cabeza con una gráfica en un “plis plás”. Como olvidarme de nuestras Lauras, cada una de ellas con su encanto particular, de Isa y su maravillosa música, de Amar y sus espectaculares buffets o a todos aquellos que pasaron, “me tocaron” y dejaron en mí su huella: Pibito, Ceci, Eva y Paola, Miguel, Rolando y Marco, Erma y Verónica,… Y no, por supuesto que no me he olvidado del corazón de toda esta “tribu de los brady”, ¡nuestra M. Paz!, a la que traemos de cabeza cada día con papeles, sellos, firmas, consejos y yo especialmente con “nuestra OKI”, y pese a todo siempre está ahí para todos con una sonrisa y un “¡venga, va, pero por ser tú! M.Paz, no hay dos como tú, ¡vales un potosí! GRACIAS.
Todos y cada uno de ellos han sido mis compañeros de viaje pero, por encima de todo, mis amigos. Por haber estado ahí siempre, por esos cafés llenos de risas, esas comidas llenas de bromas que hacen que por mi cabeza en este momento pasen millones de anécdotas y me hagan sonreír, por esas carcajadas repentinas en medio de la biblioteca una tarde cualquiera, por esas cañas, por esas comidas nutritivas en el Mc.Donald’s, por esas fiestas temáticas, por esas barbacoas, por esas casas rurales…habéis sido lo mejor de este viaje. GRACIAS.
experiencias más enriquecedoras de mi vida. Por supuesto, que no me olvido del resto de miembros “satélite” de este maravilloso equipo, ¡Elena y Nery, sois extraordinarias! GRACIAS por todas las experiencias que hemos compartido. GRACIAS por ser como sois. GRACIAS.
Pero sin duda alguna, si ha habido alguien especial en esa experiencia, esa es Helena. No hay GRACIAS en el universo suficientes para ti y tu familia. ¡Eres excepcional! Doy GRACIAS a la vida por haberme dado esa segunda oportunidad de encontrarte y conocerte. GRACIAS de corazón por haberme dado tanto calor, por darme una familia cuando tenía la mía lejos, por darme tu amistad cuando más necesitaba una amiga. GRACIAS, GRACIAS, GRACIAS.
¡A David!, mi diseñador gráfico particular, sin el que no habría podido crear una envoltura tan maravillosa y que me ha sacado de tantos “atascos” con un “clic” y una sonrisa aunque fueran las tantas de la mañana. GRACIAS por toda tu ayuda, por todo tu tiempo, por todos tus consejos, por haber querido formar parte de esto y sobre todo, por esa gran calidad humana que tienes que hace que como amigo no tengas precio. GRACIAS.
GRACIAS a todos los miembros que forman parte del COOCYL, especialmente a M. Eugenia y Laura (mis mamis) por cuidarme tanto, a Nacho, Inma, Cosme, Lázaro (formamos un gran equipo), Luís Ángel y Alberto. GRACIAS.
las “secres”, por su paciencia conmigo, las historias y el OMI. GRACIAS a José, Sergi y Didac por permitirme colaborar con ellos durante estos años. GRACIAS.
GRACIAS a mis amigos de siempre (Javi, Maribel, Julián y todos los demás), por haber estado ahí de una forma u otra y, muy especialmente a mi familia de Aranda y a Inma, Montse y Pedro. GRACIAS a José Antonio, por nuestras cartas y nuestros ciclos (nos lleven a donde nos lleven). GRACIAS.
GRACIAS a todos los que se han compartido conmigo alguna parte de esta etapa de mi vida y me han cogido de la mano en algún momento para no dejarme caer; muy especialmente a Ángel y Virginia y esa alegría que es Emma, a las “dañinas” y sus respectivos “dañinos”, a la panda “friki” (Rebe, Vane, Silvi y Cesar), a Sergio (y a sus padres), por ayudarme a luchar por esto durante tres años porque esto no lo pudiste hacer mejor, a Fernando por nuestros pingüinos y nuestras piedras, a Alex por su amistad y porque la confianza que me dan sus manos y su cariño hacia Iris no tiene precio, a Germán por “ser Germán” y muy especialmente ¡a mi Leti! por lo que me has tenido que aguantar y por nuestra sincronía cósmica. GRACIAS.
Antes de llegar a lo más importante, he de cumplir una promesa, y la cumplo desde el corazón. GRACIAS a Cadena 100, por haberme acompañado a diario durante todos estos años, especialmente durante esas noches de trabajo, por esas canciones que te hacen desde soñar hasta entender una realidad, pero muy especialmente, GRACIAS por darme la oportunidad de decirle a ANA que es el apoyo más “mágico” que alguien puede tener y que, sin ella, yo no estaría completa. GRACIAS.
GRACIAS a toda mi familia, (Pilar y Alicia, ¡sabéis que vais en éste pack!), y en especial a mi tía Marisa por todo su calor y apoyo, y a aquellos que sé que de una forma u otra son mis ángeles de la guarda. GRACIAS.
GRACIAS a mi hermana Ana, por ser lo más extraordinario que me ha regalado la vida (∞∞∞∞∞∞∞∞∞∞, empate, ¿vale?). GRACIAS a Julio, por entender y respetar un vínculo tan especial y porque sus silencios y sus sonrisas valen más que mil palabras. GRACIAS.
GRACIAS a Iris, por su amor incondicional, por ser mi alegría al despertarme cada mañana y mí mejor motivo para llegar a casa.
Por último, y lo más importante, GRACIAS A MIS PAPIS, porque soy como soy por lo que me habéis dado, por lo que me habéis enseñado, por haber sido mi ejemplo en la vida. Porque si estoy hoy aquí, es ¡GRACIAS A VOSOTROS!. GRACIAS por enseñarme a caminar sola, por dejarme elegir mi propio camino y por apoyarme en todos los pasos que he dado en mi vida, y especialmente, por ese sentimiento que sólo pueden hacerte sentir los padres,…. estar justo detrás de ti a cada paso para levantarte si te caes, darte un beso que te cura las heridas y hacerte caminar de nuevo. OS QUIERO.
Never be satisfied with what you achieve, because it all pales in comparison with what you are capable of doing in the future.
FILOSOFIA DO SUCESSO
Se acreditas que estás derrotado, é que o estás. Se acreditas que não, não o estarás.
Se gostas de ganar, mas acreditas que não podes, É quase seguro que não ganharás.
Se acreditas que estás perdido, estás perdido pois no mundo encontrarás
que o éxito inicia-se na vontade e que tudo é um estado mental.
Se acreditas na tua inferioridade, assím será. Terás que pensar alto para prosperar
e terás que estar seguro de ti
antes que possas um premio ganar.
As batalhas da vida
não são ganhas pelo homem mais rápido ou mais forte e sim, mais cedo ou mais tarde, o homem que gana é aquele que PENSA GANHAR.
INDICE GENERAL
CONTENIDOS
Lista de abreviaturas / Abreviations ... 1 Financiación ... 5 Divulgación científica ... 9 Organización de la tesis ... 17 Summary
Organization of the Doctoral Thesis ... 21 Introduction ... 23 Hypotheses ... 27 Objectives ... 29 Comparative analysis between studies I and II ... 31 Study III. Justification Model ... 49 Conclusions ... 61
Introducción
I. El Síndrome de Ojo Seco (SOS) ... 67 II. Factores ambientales y SOS ... 93 III. Cámaras de Ambiente Controlado (CAC) ... 107 Justificación ... 117 Hipótesis ... 123 Objetivos ... 127 Metodología ... 131 Resultados
INDICE GENERAL
INDICE DE ANEXOS
ANEXOS
INDICE DE TABLAS
ÍNDICE DE TABLAS
TABLA 1. Cámaras de ambiente controlado (CAC) ... 108 TABLA 2. Resumen de los criterios de inclusión de los participantes en los estudios I, II y III ... 137 TABLA 3. Puntuación asignada a cada una de las respuestas del test
OSDI© ... 139
TABLA 4. Clasificación del grado de SOS según la puntuación del
índice OSDI© ... 140
TABLA 5. Cuestionario de sintomatología de SOS: SIDEQ ... 141 TABLA 6. Concentraciones mínimas detectables para cada una
de las 16 moléculas analizadas ... 147 TABLA 7. Magnitud de la concordancia del coeficiente de correlación
intraclase (ICC) y del índice kappa ponderado ... 178 TABLA 8. Distribución en edad y sexo de los participantes del estudio I ... 183 TABLA 9. Resultados de la visita de inclusión (V0) de los grupos del
estudio I ... 184 TABLA 10. Resultados de los tests clínicos. Estudio I ... 189 TABLA 11. Niveles de detección de las moléculas analizadas
en la lágrima. Estudio I ... 199 TABLA 12. Niveles de las moléculas detectadas en la lágrima
en un porcentaje mayor al 30%. Estudio I ... 205 TABLA 13. Distribución en edad y sexo de los participantes del estudio II .. 210 TABLA 14. Resultados de la visita de inclusión (V0) de los grupos del
estudio II ... 210 TABLA 15. Resultados de los tests clínicos. Estudio II ... 215 TABLA 16. Niveles de detección de las moléculas analizadas
INDICE DE TABLAS
TABLA 17. Niveles de las moléculas detectadas en la lágrima
en un porcentaje mayor al 30%. Estudio II ... 233 TABLA 18. Distribución en edad y sexo de los participantes
del análisis comparativo entre los estudios I y II ... 238 TABLA 19. Resultados de la visita de inclusión (V0) de los
participantes del análisis comparativo entre el Estudio I y II ... 238 TABLA 20. Resultados de los tests clínicos del análisis comparativo
entre los estudios I y II ... 245 TABLA 21. Niveles de detección de las moléculas analizadas en la lágrima. Estudio I y II. Análisis comparativo ... 249 TABLA 22. Niveles de las moléculas detectadas en la lágrima
en un porcentaje mayor al 30%. Estudio I y II. Análisis comparativo ... 253 TABLA 23. Coeficiente de correlación intraclase (ICC)
de las variables cualitativas de los tests diagnósticos de Valladolid ... 258 TABLA 24. Coeficiente kappa de las variables ordinales de los tests
diagnósticos de Valladolid ... 258 TABLA 25. Coeficiente de correlación intraclase de las variables
Cualitativas de los tests diagnósticos de Braga ... 259 TABLA 26. Coeficiente kappa de las variables ordinales de los tests
diagnósticos de Braga ... 259 TABLA 27. Valores de temperatura y RH en Valladolid y Braga
INDICE DE FIGURAS
ÍNDICE DE FIGURAS
FIGURA 1. Unidad Funcional Lagrimal (LFU) ... 73 FIGURA 2. Principales causas etiológicas del SOS ... 74 FIGURA 3. Esquema para la clasificación de la gravedad del SOS ... 90 FIGURA 4. Escala gráfica de la hiperemia conjuntival bulbar
(escala Efron)... 144 FIGURA 5. Escala gráfica de Oxford para la evaluación de la tinción
corneal y conjuntival ... 149 FIGURA 6. Escala de Baylor para la evaluación de la tinción corneal ... 150 FIGURA 7. Esquema de la CAC - CERLab ... 154 FIGURA 8. Imágenes del exterior de la CAC - CERLab ... 154 FIGURA 9. Panel de la CAC para el control
de las condiciones ambientales ... 155 FIGURA 10. Imágenes del interior de la sala de exposición de CERLab ... 156 FIGURA 11. Imágenes del equipamiento de la sala de evaluación
de CERLab ... 158 FIGURA 12. Esquema del procedimiento de los estudios I y II ... 165 FIGURA 13. Esquema del procedimiento del estudio III ... 175 FIGURA 14A. Resultados de los tests clínicos: SIDEQ (media),
osmolaridad lagrimal y PRTT. Estudio I. ... 191 FIGURA 14B. Resultados de los tests clínicos: test de Schirmer,
hiperemia conjuntival media (escala Oxford) y T-BUT. Estudio I. ... 192 FIGURA 14C. Resultados de los tests clínicos: tinción corneal
y tinción conjuntival media (escala Oxford). Estudio I. ... 193 FIGURA 15. Esquema de las áreas de tinción corneal con escala
INDICE DE FIGURAS
FIGURA 16. Imágenes de tinción corneal de los sujetos del estudio I ... 195 FIGURA 17A. Variación de los niveles de EGF e IL-1Ra en lágrima
durante el estudio I. ... 201 FIGURA 17B. Variación de los niveles de IL-6 y MMP-9 en lágrima
durante el estudio I ... 203 FIGURA 18A. Resultados de los tests clínicos: SIDEQ (media),
osmolaridad lagrimal y PRTT. Estudio II. ... 217 FIGURA 18B. Resultados de los tests clínicos: test de Schirmer,
hiperemia conjuntival media (escala Oxford) y T-BUT. Estudio II. ... 218 FIGURA 18C. Resultados de los tests clínicos: tinción corneal
y tinción conjuntival media (escala Oxford). Estudio II. ... 219 FIGURA 19. Esquema de las áreas de tinción corneal con escala
de Baylor modificada que han presentado diferencias entre la valoración pre- y post- exposición para cada uno de los grupos del estudio II ... 220 FIGURA 20. Imágenes de tinción corneal de los sujetos del estudio II ... 221 FIGURA 21A. Variación de los niveles de EGF e IL-1Ra en lágrima
durante el estudio II . ... 227 FIGURA 21B. Variación de los niveles de IL-6 e IL-8 en lágrima
durante el estudio II ... 229 FIGURA 21C. Variación de los niveles de RANTES y MMP-9 en lágrima durante el estudio II ... 231 FIGURA 22A. Resultados de los tests clínicos: SIDEQ (media),
osmolaridad lagrimal y PRTT.
Análisis comparativo entre los estudios I y II ... 242 FIGURA 22B. Resultados de los tests clínicos: test de Schirmer,
hiperemia conjuntival media (escala Oxford) y T-BUT.
INDICE DE FIGURAS
FIGURA 22C. Resultados de los tests clínicos: tinción corneal y tinción conjuntival media (escala Oxford).
Análisis comparativo entre los estudios I y II ... 244 FIGURA 23. Esquema de las áreas de tinción corneal con escala de Baylor modificada que han presentado diferencias entre la valoración pre- y post- exposición para cada uno de los grupos entre el estudio I y II ... 247 FIGURA 24. Moléculas en lágrima que mostraron cambios significativos en el análisis comparativo entre el estudio I y II ... 251 FIGURA 25. Gráfico de cajas del estudio comparativo entre Valladolid
LISTA DE ABREVIATURAS / ABBREVIATIONS
1
LISTA DE ABREVIATURAS / ABBREVIATIONS
Se han utilizado mayoritariamente las abreviaturas derivadas de la terminología inglesa, para mantener la correspondencia con los términos utilizados en los artículos científicos publicados.
CAC (Controlled environmental chamber): cámara de ambiente controlado.
CCL5/RANTES (regulated and normal T cell expressed and secreted): factor expresado y secretado por las células T normales y reguladas.
CEORLab (Clinical and Experimental Optometry Research Laboratory): Laboratorio de Investigación en Optometría Clínica y Experimental en Braga, Portugal.
CX3CL1/Fractalquina (fractalkine): fractalquina.
DED (dry eye disease): síndrome de ojo seco.
DEWS (International Dry Eye WorkShop): taller internacional sobre ojo seco.
EEM (standard error of the mean): error estándar de la media.
EGF (epidermal growth factor): factor de crecimiento epidérmico.
FDA (Food and Drug Administration): agencia de alimentos y medicamentos.
ICC (intraclass correlation coefficient): coeficiente de correlación intraclase.
IFN-γ(interferon-gamma): interferon gamma.
LISTA DE ABREVIATURAS / ABBREVIATIONS
2
IOBA – CERLab (IOBA – Controlled Environment Research Laboratory): IOBA - Laboratorio de Investigación de Ambiente Controlado en Valladolid, España.
LFU (lacrimal functional unit): unidad funcional lagrimal.
LH (low humidity condition): condición de baja humedad.
LHP (low humidity and pressure condition): condición de baja humedad y baja presión.
LoA (limits of agreement): límites de acuerdo.
m (meters): metros.
MMP-9 (metalloproteinase-9): metaloproteinasa – 9.
n (sample size): tamaño muestral.
NEI (National Eye Institute): Instituto Nacional del Ojo.
ºC (degrees centigrade / Celsius degrees): grados centígrados / grados Celsius.
OSDI© (ocular surface disease index): índice de enfermedad de la superficie
ocular.
PRTT (phenol red thread test): test de rojo de fenol.
PVD (visual display unit): pantallas de visualización de datos.
RH (relative humidity): humedad relativa.
LISTA DE ABREVIATURAS / ABBREVIATIONS
3
SEM (standard error of the mean): error estándar de la media.
SIDEQ (single item score dry eye questionnaire): cuestionario de valoración de ojo seco.
SOS: síndrome de ojo seco.
ST (standard condition): condición estándar.
T-BUT (tear break-up time): tiempo de ruptura lagrimal.
TNF-α(tumor necrosis factor): factor de necrosis tumoral. VAS (visual analogue scale): escalas de valoración visual.
FINANCIACIÓN
5
FINANCIACIÓN
Este trabajo de investigación ha sido posible gracias al apoyo económico recibido de diferentes organismos públicos y privados que han financiado los siguientes proyectos de investigación, en el seno del Grupo de Investigación de Superficie Ocular del IOBA (grupo de investigación reconocido de la Universidad de Valladolid), en los que he participado como personal investigador.
Proyectos en convocatoria pública:
29/03/2011-28/03/2013: Junta de Castilla y León. EDU-VA145A11-2: Desarrollo de un test de provocación en una cámara de ambiente controlado para el diagnóstico de enfermedades inflamatorias de la superficie ocular. I.P.: M. Calonge Cano.
FINANCIACIÓN
6
Proyectos con financiación privada:
• 12/04/2008-11/04/2009: Artículo 83 de la LOU con los Laboratorios Allergan Inc. (USA). Proyecto: Standardization of diagnostic tests under controlled environmental conditions. I.P.: M. Calonge Cano.
• 10/02/2009-09/02/2014: Artículo 83 de la LOU con los Laboratorios Allergan Inc. (USA). Proyecto: Allergan/IOBA Ocular Surface Inflammation Program. I.P.: M. Calonge Cano.
• 01/09/2009-31/12/2010: Artículo 83 de la LOU con los Laboratorios Allergan Inc (USA). Proyecto: Influence of controlled adverse environments on the ocular surface. I.P.: M. Calonge Cano.
• 30/12/2009-29/12/2010. Art. 83 de la LOU con los Laboratorios Allergan USA. Proyecto: “Biomarkers in Dry Eye Disease”. I.P.: M.J. González Garcia.
• 04/05/2010-31/12/2011: Artículo 83 de la LOU con los Laboratorios Allergan Inc (USA). Proyecto: Clinical trial on Dry Eye Syndrome under controlled environmental conditions. I.P.: M. Calonge Cano.
FINANCIACIÓN
7
Respecto a la financiación personal, durante el desarrollo de esta tesis doctoral he disfrutado de las siguientes becas, concedidas tanto por la Universidad de Valladolid como por la Universidad do Minho (Braga, Portugal).
• Beca de Formación de Personal Investigador (FPI-UVa) (2008-2012).
• Ayuda complementaria para estancias breves en el extranjero para becarios FPI (2012), que me permitió realizar una estancia de tres meses en el Laboratório de Investigação em Optometria Clínica e Experimental (CEORLab) del Centro de Física de la Universidade do Minho, Braga (Portugal), bajo la supervisión del profesor Mikhail Vasilevskiy.
• Beca complementaria asociada al proyecto de investigación “Soluções Multipropósito para Lentes de Contacto”. Duración: desde el 15/04/2012 hasta el 31/12/2012. a cargo del Dr. José Manuel González-Méijome en el Centro de Física de la Universidad de Minho.
DIVULGACIÓN CIENTÍFICA
9
DIVULGACIÓN CIENTÍFICA
Esta tesis doctoral ha dado lugar a las siguientes publicaciones científicas:
- Tesón M, González García MJ, López-Miguel A,
Enríquez-de-Salamanca A, Martín-Montañez V, Benito MJ, Mateo ME, Stern ME,
Calonge M. Influence of a Controlled Environment Simulating an
In-flight Airplane Cabin on Dry Eye Disease. Enviado a IOVS. En
segunda revisión.
- Martín-Montañez V, González-García MJ, Tesón M, Calonge M.
Procedimientos de valoración de la función visual en el síndrome de
ojo seco. Ver y Oír 2011:28 (241):35-42. ISSN: 0212-4394
- González-García MJ, Tesón M. Cap. 6: Alteración de la Superficie
Ocular por el uso de Lentes de Contacto: Problemas y Soluciones
Actuales. En: Lentes de Contacto: superficie ocular y biomateriales.
López-Alemany A (ed). Editorial Ulleye. Xativa, España. 2010; cápitulo
DIVULGACIÓN CIENTÍFICA
10
- Tesón M, González-García MJ, Calonge M. Cap. 7: Síndrome de Ojo
Seco. En: Lentes de Contacto: superficie ocular y biomateriales.
López-Alemany A (ed). Editorial Ulleye. Xativa, España. 2010; cápitulo
7. ISBN: 978-84-935497-2-5. CLAVE: CL.
- García MJ, Tesón M, Herreras JM, Calonge M,
González-Meijome JM. Lentes de Contacto y Síndrome de Ojo Seco. En:
Contactología. En proceso de edición por el Servicio de Publicaciones
DIVULGACIÓN CIENTÍFICA
11
Además, el trabajo realizado ha sido en los siguientes congresos científicos.
PONENCIAS INVITADAS
- Calonge M, Tesón M, López-Miguel A, Enriquez-de-Salamanca A, Martín-Montañez V, Benito MJ, Mateo ME, Herreras JM, Stern ME, González-García MJ. 6-8/06/2007: Panelista asesor. Contribución: Effect of a Controlled Adverse Environment (CAE) on the Ocular Surface: A Model for Human Studies. The Inflammation and Ocular Surface Focus Group. Allergan. Paris, Francia.
- Tesón M. Influencia de los Factores Ambientales en la Superficie Ocular. I Jornadas Hispanolusas de la Visión. 2–3/10/2010. Don Benito, Extremadura, España.
- Calonge M, Tesón M, López-Miguel A, Enriquez-de-Salamanca A, Martín-Montañez V, Benito MJ, Mateo ME, Herreras JM, Stern ME, González-García MJ. 23-25/09/2011: Panelista asesor. “Update in biomarkers for ocular surface inflammation”. The Inflammation and Ocular Surface Focus Group. Allergan, Barcelona, España. Internacional.
DIVULGACIÓN CIENTÍFICA
12
- Calonge M, Tesón M, López-Miguel A, Enriquez-de-Salamanca A, Martín-Montañez V, Benito MJ, Mateo ME, Herreras JM, Stern ME, González-García MJ 21-25/07/2012: “Clinical and inflammatory molcular response of the lacrimal functional unit to controlled environmental conditions”. XX Biennial Meeting of the International Society for Eye Research. ISER 2012. Berlin, Alemania. Internacional.
DIVULGACIÓN CIENTÍFICA
13
PONENCIAS
- Tesón M, Abengózar A, López-Miguel A, Stern ME, Calonge M, González-García MJ. Influencia de los Factores Ambientales en la Superficie Ocular. Conferencia Internacional en Optometría y Contactología OC’10. Red Temática en Optometría del Ministerio de Ciencia e Innovación y Universidad de Valencia. 17-18/04/2010. Valencia, España. Comunicación oral.
- Tesón M, Martín-Montañez V, López-Miguel A, Enríquez-de-Salamanca A, Benito MJ, Mateo ME, González-García MJ, Calonge M. Alteración de la superficie ocular por exposición a un ambiente adverso. Modelo de una cámara de control ambiental Cer-Lab. 22 Congreso internacional de Optometría Contactología y Óptica Oftálmica. 17-19/02/2012. Madrid, España. Comunicación oral.
- Tesón M, Martín-Montañez V, López-Miguel A,
DIVULGACIÓN CIENTÍFICA
14
- Martín-Montañez V, Tesón M, López-Miguel A, Neves H, Gonzalez-Meijome JM, Calonge M, Gonzalez-Garcia MJ. Determinación de la relación entre síntomas y signos en pacientes con sindrome de Ojo Seco. 22 Congreso internacional de Optometría Contactología y Optica Oftalmálmica. 17-19/02/2012. Madrid, España. Comunicación oral.
- García Vázquez C, Tesón M, Martín Montañez V, López Miguel A, Benito MJ, Mateo ME, González García MJ, Calonge M, Enríquez de Salamanca A. Alteración de los niveles de citoquinas y quimioquinas en lágrima por exposición a un ambiente adverso en una Cámara de Control Ambiental- CERLab. XXV Congreso Nacional de Técnicos Superiores en Laboratorio de Diagnóstico Clínico y Técnicos Superiores en Anatomía Patológica y Citología. 25-26/05/2012 Santiago de Compostela. Nacional. Comunicación oral.
PÓSTERS
DIVULGACIÓN CIENTÍFICA
15
- González-García MJ, Tesón M, Martín-Montañez V, López-Miguel A, Enríquez-de-Salamanca A, Benito MJ, Mateo ME, Herreras JM, Stern ME, Calonge M. Utility of a Controlled Environment in the diagnosis of Dry Eye Disease. Association for Research in Vision and Ophthalmology Annual Meeting (ARVO), Florida, Estados Unidos. 06-09/05/2012 Internacional. Comunicación en póster.
- Tesón M, Martín-Montañez V, López-Miguel A, Enríquez-de-Salamanca A, Benito MJ, Mateo ME, Calonge M, González-García MJ. Inter-Session Variability of the Clinical Ocular Surface Diagnostic Tests. 9th International Conference of Optometry and Vision Science (CIOCV’2012), 23-23/04/2012. Braga, Portugal. Póster.
ORGANIZACIÓN DE LA TESIS
17
ORGANIZACIÓN DE LA TESIS
Esta memoria de tesis se presenta en la modalidad tradicional y opta a la mención internacional en el título de doctor. Por lo tanto, su organización se ajusta a lo requerido por la comisión de doctorado de la Universidad de Valladolid.
Esta tesis doctoral se encuentra dividida y constituida por tres estudios complementarios entre sí. Teniendo como objetivo el facilitar la comprensión del trabajo realizado, se ha optado por organizarla de la siguiente forma: una introducción al tema de estudio de la tesis, la justificación del trabajo realizado, seguido de la hipótesis y los objetivos perseguidos y la metodología empleada en los estudios, especificando en este apartado las pequeñas diferencias en metodología existentes entre los estudios. Posteriormente, se reflejan los resultados de los estudios I y II, realizados en la cámara de ambiente controlado y de un análisis comparativo entre ambos estudios; para ello, se ha seleccionado la condición ambiental menos extrema del estudio I y se ha comparado con la condición más extrema a la que se han expuesto los sujetos del estudio II.
19
ORGANIZATION OF THE DOCTORAL THESIS
21
ORGANIZATION OF THE DOCTORAL THESIS
This PhD manuscript, presented in the “traditional format”, applies for eligibility to the so-called International Mention on the Doctor title. Therefore, its organization meets those specific requirements as dictated by the Doctoral Committee of the University of Valladolid.
This thesis is divided into three different studies: study I and II were carried out in the environmental chamber of the CERLab (University of Valladolid and Visión I+D, Valladolid, Spain) and study III was conducted at the Clinical and Experimental Optometry Research Laboratory (CEORlab, Braga, Portugal), where I spent three months to qualify for the International Mention.
In order to facilitate its understanding, this thesis manuscript is organized as follows: an introduction in the topic of the thesis study, the justification of the work performed, followed by the hypothesis and objectives. It then follows a commom methodology section, specifying small differences in each of the three studies. Then, results are shown separately, corresponding to study I, II and III. Results of the two first studies (I and II) are closely related, and where compared in a different section.
SUMMARY
23
INTRODUCTION
Dry eye is recognized as a multifactorial inflammatory disorder of the lacrimal functional unit (LFU) composed by the cornea, conjunctiva, accessory lacrimal glands, meibomian glands, main lacrimal gland, and the interconnecting innervation that integrates the activities of each component (Stern et al., 1998). In DED, the interactions of the LFU components become disrupted. It is a common disorder affecting between 5.5% (McCarty et al., 1998) and 33.7% (Lin et al., 2003) of the population, depending on the criteria used for diagnosis. It is characterized by ocular discomfort and pain, visual disturbance, tear film instability, and increased tear osmolarity (DEWS, 2007a), and inflammation of the LFU.
Currently, except for Cyclosporine A (CsA), there are no pharmacological therapies approved for the management of DED. Available treatments can decrease symptoms and signs, but have limited effect on the underlying cause of the disease. A clear example is artificial tears attempting to mimic human tears with physico-chemical properties (pH, osmolarity, viscosity, surface tension), and chemical elements (mainly ions) of their composing (sodium, potassium, phosphate, zinc, etc.). However, human tears have a number of more complex compounds which are impossible to mimic (antibodies, enzymes, growth factors, nutrients, etc.).
SUMMARY
24
signs and symptoms of DED, classify the disease and provide the most appropriate treatment. However, many of them have shown low reliability and reproducibility (Nichols et al., 2004). Addittionally, most studies found poor or no correlation between the clinical signs and symptoms in patients with DED (Hay et al., 1998; Schein et al., 1997; Bjerrum., 1996, Moore et al., 2009, Cuevas et al., 2012) and clinical evidence indicates that the available diagnostic tests do not always correlate well with symptoms (Begley y cols., 2003), especially in mild to moderate forms of DED (Cuevas et al., 2012).
During recent years, new techniques have been developed for the evaluation of both the ocular surface and the tear film, such as tear clearance test, study of growth factors and inflammatory molecules (cytokines/chemokines) in epithelial cells and tears (Lamibase et al., 2011; Enriquez-de-Salamanca et al., 2010). Some of these evaluation techniques can potentially be useful both to improve the correlation between signs and symptoms and the diagnosis of DED or other diseases of the ocular surface (DEWS, 2007d). The difficulty in demonstrating the correlation between clinical improvement of objective and subjective symptoms makes both the classification and diagnosis of DED as well as finding appropriate treatments, a complex aim to be reached. One of the most important factors implicated in this disconnection is the environment to which the LFU is exposed and which can abruptly vary. This variability is actually a well-recognized problem in the confirmation of therapeutic efficacy in the context of clinical trials (Foulks., 2003).
SUMMARY
25
controlled environments in their daily life, such as air-conditioned or heated rooms, vehicles, and/or airplane cabins. Thus, the LFU is exposed to multiple environmental variables including temperature, airflow, humidity, and in some cases, atmospheric pressure. These environmental variables could stimulate or retard tear film evaporation and increase or decrease symptoms and signs (Barabino et al., 2002; Rolando et al., 1998; González-García et al., 2007).
The control of the environmental conditions to which patients are exposed before being evaluated might minimize the influence that these have on the LFU, which may allow the obtaining of more reliable diagnostic test values. Similarly, the ability to "homogenize" patients before being evaluated to minimize the influence of the environment could be a crucial factor to improve the reliability and eventual success of therapeutical multicenter clinical trials, where each center is located in a different geographic location with different climatic characteristics.
SUMMARY
26
The Ocular Surface Group at IOBA, University of Valladolid is highly involved in the study of inflammatory diseases affecting the ocular surface, DED being its main focus. About 10 years ago, a research program in inflammation of ocular surface was started and co-directed by Prof. Margarita Calonge (IOBA, University of Valladolid) and Dr. Michael E. Stern (Allergan Inc). In the context of this program, a study with an environmental chamber located at the School of Architecture in the University of Valladolid was designed. Although this chamber was not adapted to be used with humans, but for studying the quality of air, a first study with humans was possible by performing some reformations (González-García et al., 2007). This study demonstrated the utility and the importance of this controlled environment. Thus, in 2008, an environmental chamber was constructed, becoming part of the so-called Controlled Environment Research Laboratory (CERLab). Within this chamber, environmental variables such as temperature, relative humidity (RH), and atmospheric pressure can be controlled.
SUMMARY
27
HYPOTHESIS
Adverse environmental conditions recreated within a controlled environmental
chamber can cause a deterioration of the LFU in both DED patients and
healthy individuals, as evaluated by the alteration of clinical diagnostic tests of
SUMMARY
29
OBJECTIVES
General objective
To evaluate the effects induced by various environmental conditions recreated in the controlled environment chamber (CERLab) in DED diagnostic tests (symptoms, signs, and tear molecules) in three study samples: control subjects, patients with mild-moderate DED, and patients with severe DED.
Specific objectives
1. To assess the effect of an environmental condition frequently found in Valladolid, Spain on the LFU of DED patients and healthy subjects, evaluated by the variation of clinical diagnostic tests of DED and tear molecule concentrations.
The specific environmental conditions recreated in the environmental chamber were: 23ºC of temperature, 45% RH, and 930 mb of atmospheric pressure (corresponding to the one in Valladolid whis is 690 m above sea level).
2. To assess the effect of an environmental condition frequently found in drier areas or in modern buildings (where RH is typically lower) on the LFU of DED patients and healthy subjects, evaluated by the variation of clinical diagnostic tests of DED and tear molecule concentrations.
SUMMARY
30
3. To assess the effect of the environmental condition frequently found in air cabins during in-flight conditions on the LFU of DED patients and healthy subjects, evaluated by the variation of clinical diagnostic tests of DED and tear molecule concentrations.
This specific environmental condition recreated in the environmental chamber was: 23ºC, 5% RH and 750 mb of atmospheric pressure (corresponding to 2500 m above sea level).
4. To evaluate the influence on the LFU induced by implementation of air flow on the three environmental conditions detailed above.
SUMMARY
31
COMPARATIVE ANALYSIS
STUDIES I AND II
METHODOLOGY
Participants
The study protocols were approved by the institutional review board of the Institute for Applied OphthalmoBiology (IOBA), University of Valladolid and the University of Valladolid Medical School Ethics Committee. The study adhered to the tenets of the Declaration of Helsinki. All enrolled subjects were informed of the nature of the study and consent forms were signed. The study was double-masked and thus neither the participants nor the examiners knew to which of the specific randomized environmental conditions the participants were exposed. The same examiner always performed the clinical subjective evaluation of corneal and conjunctival staining, conjunctival hyperemia, and fluorescein tear break-up time (T-BUT).
SUMMARY
32
We selected mild to moderate (level 1 and 2) DED patients as classified by the International Dry Eye Workshop (DEWS) dry eye severity grading scheme (DEWS, 2007a). During a preliminary visit, potential patients and subjects were screened for inclusion criteria. For DED patients, these included an ocular surface disease index (OSDI©) score (Schiffman et al., 2000) > 12 and corneal
fluorescein staining ≤ grade 2 (Oxford Scale) (Bron et al., 2003). For healthy
control subjects, theinclusion criteria were an OSDI© score < 12 and corneal
fluorescein staining ≤ grade 1 (DEWS, 2007a). In addition, individuals from
both groups had to be within normal limits in at least two out of the following four tests: fluorescein T-BUT > 7 sec (Lamp et al., 2009), conjunctival
lissamine green staining (Oxford Scale) ≤ grade 1 (DEWS, 2007a; Bron et al.,
2003; Xu et al., 1995), Schirmer test without anesthesia ≥ 5 mm in 5 min (van
Bijsterveld., 1969; DEWS, 2007a), and phenol red thread test (PRTT) > 20 mm in 15 seconds (Patel et al., 1998; Sakamoto et al., 1993)
SUMMARY
33
Only one eye of each individual was included in the study. The selection was performed during the screening visit and depended first on corneal staining. The eye having more severe corneal staining was selected for the DED group. For the control group, the eye with the least corneal staining was selected. If both eyes had the same corneal staining, then the most symptomatic eye was selected for the DED group, whereas for the control group, the least symptomatic one was chosen. If the latter criteria failed to select the study eye, the eye was finally selected following a computer-generated random table.
Environmental Chamber
Individuals were exposed to two different environment conditions within an environmental chamber (VISIÓN I+D, SL; Valladolid, Spain) inside the Controlled Environmental Research Laboratory (CERLab), located at the IOBA building at the University of Valladolid, Valladolid, Spain. This facility was composed of an exposure chamber with a maximum capacity of 8 subjects and an evaluation chamber (Figure 1). Both chambers were 6 ×3 meters (18 m2).
SUMMARY
34
after a two hour exposure to the environmental condition. Experimental sessions were run only when an anesthesiologist working at the surgery facilities (located on the same floor) was also available to take care of any possible medically adverse event.
Figure 1. Environmental Chamber of the Controlled Environmental Research
Laboratory (CERLab). A: engine room; B: exposure room; C: evaluation room.
Environmental Conditions
For two hours, each subject was exposed to either the Standard Condition or the Adverse Condition within the environmental chamber maintained at 23ºC. For the Standard Condition, the RH was 45% and the barometric pressure was 930 mb, the average atmospheric pressure found in Valladolid, which is 690 meters above sea level. For this condition, there was no localized air flow, and participants performed near vision tasks such as reading, playing cards,
A
B
SUMMARY
35
working crossword puzzles, doing board games, etc., for the whole exposure period.
For the Adverse Condition, the RH was 5% and the atmospheric pressure was 750 mb, similar to that usually found within an aircraft cabin at 2.500 m above sea level (Federal Aviation Administration, 1996). Pressure changes were designed to simulate an actual aircraft flight, with a 15 min ascent during which the pressure decreased at a rate of 12.7 mb/min, an 85 min cruise, and a 20 min descent during which the pressured increased at a rate of 9.5 mb/min. The Adverse Condition included localized air flow with a mean velocity of 0.43 m/s, provided by individual blowers (Belnor Engineering Inc., Ottawa, ON, Canada) located one meter away from each subject. During the exposure, participants watched a documentary on a conventional LED TV monitor of 1.4 m that was situated above eye level so that patients looked slightly upwards. These conditions were designed to achieve a larger LFU area exposed to the desiccating conditions.
Examination Procedure
The examinations were performed in the sequence outlined below, with a 2-5 min interval between each test.
SUMMARY
36
For this study, we assessed the same symptoms as the original one (Invest Ophthalmol Vis Sci 44 [Suppl]:2448, 2003); however, the level of discomfort was scored using a visual analogue scale (VAS) (Aitken., 1969) to increase test sensitivity. The VAS consisted of a horizontal line 100 mm long. At the left end of the line the number “0” indicated the absence of symptoms. At the right end of the line, the number “100” indicated severe symptoms. Participants performed the modified SIDEQ before beginning the chamber exposure, one hour after the beginning, and at the end of the two hour exposure.
Tear osmolarity. Tear osmolarity was assessed using the TearLab (TearLab Corporation, San Diego, CA, USA). This system is designed to collect and analyze tear osmolarity from a 50 nl tear sample. Collection was performed at the external canthus in a non-traumatic procedure to avoid reflex tear secretion. A disposable chip was used for each sample (Benelli et al., 2010). Prior to proceeding with any measurement, Tearlab calibration was performed following the manufacturer’s instructions. We used the recommended cut-off value of 316 mOsm/l for DED diagnosis (DEWS, 2007a; Tomlinson et al., 2006).
SUMMARY
37
Conjunctival hyperemia. Bulbar hyperemia was scored based on the Efron scale (Efron., 1998). Nasal and temporal areas were assessed independently; however, the final score was obtained after averaging both values.
Tear sample collection. Tear samples (4 µl) were obtained for cytokine/chemokine and matrix metalloproteinase (MMP)-9 analyses before instilling any vital staining. As previously described (Carreño et al., 2010), tears were collected from the external canthus in a non-traumatic manner to avoid as much as possible reflex tear secretion. The samples were collected using a glass capillary tube (Drummond Scientific Co, Broomall, PA, USA) and then diluted 1:10 by delivery with a Pipetboy (Integra Biosciences AG, Zizers, Switzerland) in a 0.5 ml microtube (Sarstedt AG&Co, Nümbrecht, Germany) containing Cytokine Assay Buffer (Merck Millipore, Millipore Iberica, Madrid, Spain). The samples were then frozen at -80°C until analysis.
SUMMARY
38
Corneal fluorescein staining. Corneal staining was evaluated using a slit-lamp biomicroscope (SL-D7; Topcon Corporation, Tokyo, Japan) with a cobalt-blue filter over the light source and a yellow Wratten #12 filter. Measurements were made two min after instillation of 5 µl of 2% sodium fluorescein (Colircusí Fluoresceína 2%) into the inferior fornix of the eye. Corneal fluorescein staining was graded using both the Oxford scheme (Bron., 1997) and a modified Baylor scheme Pflugfelder et al., 2004). The Oxford grading scheme included five panels (0, I, II, III, IV and V) that represented typical gradations of stain on either the cornea or conjunctiva.
SUMMARY
39
Conjunctival lissamine green staining. Conjunctival staining was evaluated with lissamine green strips (GreenGlo, HUB Pharmaceuticals, LLC, Rancho Cucamonga, CA, USA). The strips were wetted with 25 µl sodium chloride (NaCl 0.9%, B/Braun, Barcelona, Spain) and then gently applied into the inferior fornix. Staining was evaluated one minute after the instillation following the Oxford scheme grading system (Bron., 1997).
Schirmer test without topical anesthesia. One Schirmer sterile strip (Tearflo, HUB Pharmaceuticals, LLC) was placed in the lateral canthus of the inferior lid margin of both eyes (van Bijsterveld., 1969). The subjects were asked to maintain the eyes closed during the test. The length of wetting was measured in millimeters after 5 min. Results of 5 mm length or more were considered normal (DEWS, 2007a).
Analysis of Tear Molecules
Tear levels of cytokines, chemokines, and MMP-9 were determined by commercial immune-bead based assays in a Luminex IS-100 (Luminex Corporation, Austin, TX, USA). The concentrations of epidermal growth factor (EGF), CX3CL1/fractalkine, interferon (IFN)-γ, interleukin (IL)-1RA, IL-1β, IL-2, IL-6, CXCL8/IL-8, IL-10, IL-12p70, IL-17, CXCL10/IP-10, CCL5/RANTES, tumor necrosis factor (TNF)-α, and vascular endothelial growth factor (VEGF)
SUMMARY
40
specific for each cytokine/chemokine or MMP-9. After washing, the beads were incubated with biotinylated human cytokine/chemokine or MMP-9 antibodies for 1 hour, followed by incubation with streptavidin-phycoerythrin for 30 min. Standard curves, obtained from samples of known concentrations of recombinant human cytokines/chemokines or MMP-9 were used to convert fluorescence units to concentration units (pg/ml). The minimum detectable concentrations (in pg/ml) for molecules analyzed were EGF, 2.7; CX3CL1/Fractalkine, 6; IFN-γ and TNF-α, 0.1; IL-1RA, 2.9; IL-1β and IL-12p70, 0.4; IL-2, IL-6, and IL-10, 0.3; CXCL8/ IL-8 and IL-17, 0.2; CXCL10/IP-10, 1.2; CCL5/RANTES, 1; VEGF, 5.8; and MMP-9, 10. The data were stored and analyzed with the "Bead View Software" (Upstate-Millipore Corporation, Watford, UK). In some samples, the assayed molecule was undetectable. To include those samples in the statistical analysis, we assigned each the minimum detectable value (provided by the assay manufacturer). However, molecules that were detected in less than 30% of the population were not further analyzed.
Data Analysis
Data were expressed as the mean ± standard error of the mean (SEM). Statistical analyses were performed using the Statistical Package for the Social Sciences software (SPSS 18.0 for Windows; SPSS Inc., Chicago, IL, USA) and R (RDC Team., 2006) software by a licensed statistician (MEM). The U-Mann Whitney test was used for comparisons of two independent sample groups. For comparisons between tests performed prior to and after the environmental exposure, the Wilcoxon signed rank test was used for quantitative variables and McNemar test for qualitative variables. Two-sided P-values ≤0.05 were
SUMMARY
41
RESULTS
Screening Visit
For exposure to the Standard Condition, 19 control subjects (9 males; 10 females, 60.6 ± 1.7 years old) and 15 DED patients (5 males; 10 females, 60.3 ± 2.1 years old) were selected (Table 1). For exposure to the Adverse Condition, 20 control subjects (6 males; 14 females, 59.3 ± 1.9 years old) were paired with 20 DED patients (6 males; 14 females, 64.7 ± 1.8 years old). The screening evaluations for subjects in both groups were conducted under both standard and adverse environmental conditions. For both conditions, the OSDI© scores for DED patients were significantly higher than for control
subjects (Table 2). However, for all objective measures, there were no significant differences between the two groups under either environmental condition. No patients suffered any adverse event.
Table 1. Distribution gender and age of subjects.
GROUPS STANDARD CONDITION N (male/female) Age ADVERSE CONDITION N (male/female) Age TOTAL N (male/female) Age Control group 19 (9/10) 60.6 ± 1.7
20 (6/14) 59.3 ± 1.9
39 (15/24) 60.0 ± 1.3
DED group
15 (5/10) 60.3 ± 2.1
20 (6/14) 64.7 ± 1.8
35 (11/24) 62.8 ± 1.4
Total 34 (14/20)
60.5 ± 1.3
40 (12/28) 62.0 ± 1.4
74 (26/48) 61.3 ± 1.0
SUMMARY
42 Table 2. Screening evaluation of participants under standard and adverse conditions.
Standard Condition Adverse Condition
Control Group
DED Group
Control
Group
DED Group
OSDI© score 2.26 ± 0.90* 40.6 ± 5.97* 3.27 ± 0.85* 35.73 ± 2.79*
PRTT 20.84 ± 1.74 24.13 ± 1.60 23.44 ± 1.29 21.40 ± 1.29
T-BUT 5.39 ± 0.98 4.62 ± 0.86 4.22 ± 0.64 3.82 ± 0.57
Corneal Staining
(Oxford scale) 0.37 ± 0.11 0.33 ± 0.13 0.50 ± 0.11 0.75 ± 0.16 Conjunctival
Lissamine staining 0.51 ± 0.10 0.63 ± 0.18 0.45 ± 0.16 0.25 ± 0.09
Schirmer test 14.97 ± 2.15 14.50 ± 1.94 11.30 ± 1.28 12.70 ± 1.85
*Difference between groups under the same condition (Wilcoxon test, p≤0.001). DED: dry eye disease; OSDI©: ocular surface disease index; PRTT: phenol red thread
SUMMARY
43
Clinical Tests
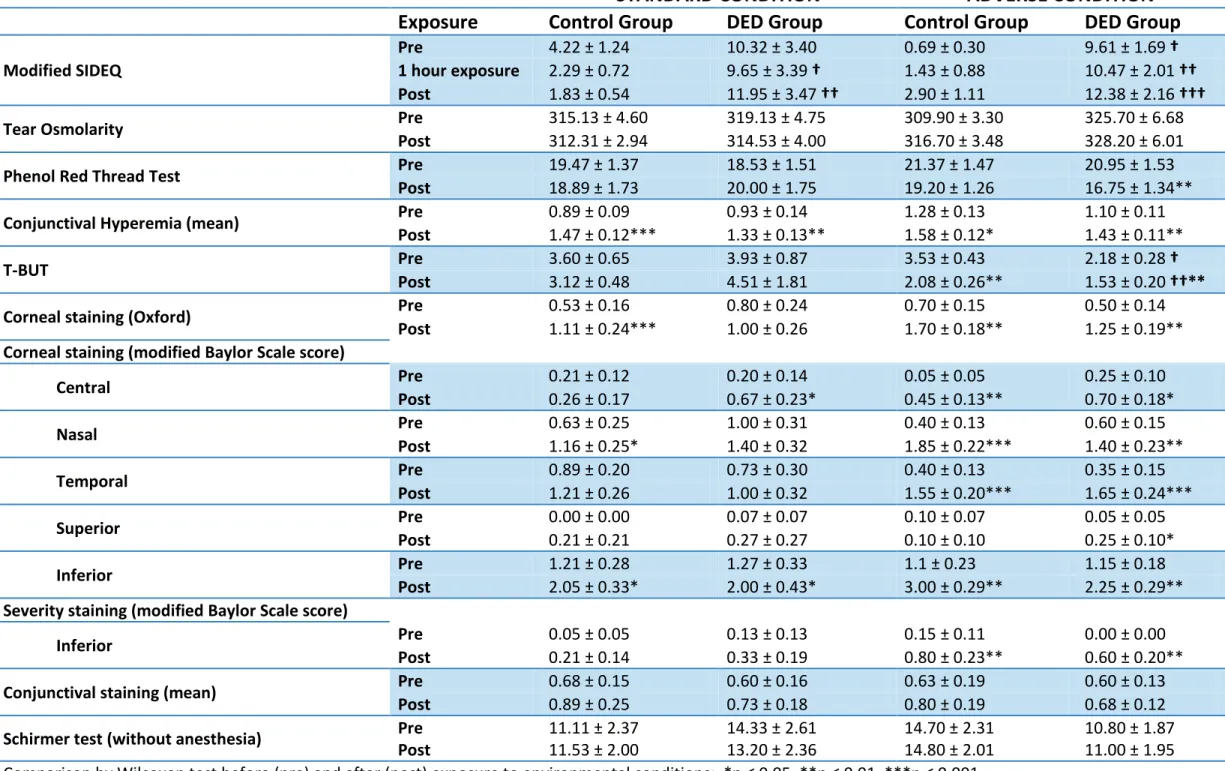
For tear osmolarity, conjunctival staining, and the Schirmer test, there were no statistically significant differences between the control and DED groups before or after exposure to either standard or control conditions (Table 3), nor did the adverse condition induce any significant changes from the pre-exposure state for these tests. The modified SIDEQ scores of the DED group were significantly higher than those of the control group after one and two hours of exposure to the Standard Condition (Table 3). Under the Adverse Condition, the scores of the DED group were significantly higher prior to, at one hour, and after two hours of exposure. For the DED group, PRT test scores were significantly decreased after two hours in the Adverse Condition (Table 3). Conjunctival hyperemia scores significantly increased in all individuals after both exposures (Table 3).
SUMMARY
45
Table 3. Clinical test results.
TEST
STANDARD CONDITION
ADVERSE CONDITION
Exposure
Control Group
DED Group
Control Group
DED Group
Modified SIDEQ
Pre 4.22 ± 1.24 10.32 ± 3.40 0.69 ± 0.30 9.61 ± 1.69 †
1 hour exposure 2.29 ± 0.72 9.65 ± 3.39 † 1.43 ± 0.88 10.47 ± 2.01 ††
Post 1.83 ± 0.54 11.95 ± 3.47 †† 2.90 ± 1.11 12.38 ± 2.16 †††
Tear Osmolarity Pre Post 315.13 ± 4.60 312.31 ± 2.94 319.13 ± 4.75 314.53 ± 4.00 309.90 ± 3.30 316.70 ± 3.48 325.70 ± 6.68 328.20 ± 6.01
Phenol Red Thread Test Pre Post 19.47 ± 1.37 18.89 ± 1.73 18.53 ± 1.51 20.00 ± 1.75 21.37 ± 1.47 19.20 ± 1.26 20.95 ± 1.53 16.75 ± 1.34**
Conjunctival Hyperemia (mean) Pre Post 0.89 ± 0.09 1.47 ± 0.12*** 0.93 ± 0.14 1.33 ± 0.13** 1.28 ± 0.13 1.58 ± 0.12* 1.10 ± 0.11 1.43 ± 0.11**
T-BUT Pre Post 3.60 ± 0.65 3.12 ± 0.48 3.93 ± 0.87 4.51 ± 1.81 3.53 ± 0.43 2.08 ± 0.26** 2.18 ± 0.28 1.53 ± 0.20 †††**
Corneal staining (Oxford) Pre 0.53 ± 0.16 0.80 ± 0.24 0.70 ± 0.15 0.50 ± 0.14
Post 1.11 ± 0.24*** 1.00 ± 0.26 1.70 ± 0.18** 1.25 ± 0.19**
Corneal staining (modified Baylor Scale score)
Central Pre 0.21 ± 0.12 0.20 ± 0.14 0.05 ± 0.05 0.25 ± 0.10
Post 0.26 ± 0.17 0.67 ± 0.23* 0.45 ± 0.13** 0.70 ± 0.18*
Nasal Pre 0.63 ± 0.25 1.00 ± 0.31 0.40 ± 0.13 0.60 ± 0.15
Post 1.16 ± 0.25* 1.40 ± 0.32 1.85 ± 0.22*** 1.40 ± 0.23**
Temporal Pre 0.89 ± 0.20 0.73 ± 0.30 0.40 ± 0.13 0.35 ± 0.15
Post 1.21 ± 0.26 1.00 ± 0.32 1.55 ± 0.20*** 1.65 ± 0.24***
Superior Pre Post 0.00 ± 0.00 0.21 ± 0.21 0.07 ± 0.07 0.27 ± 0.27 0.10 ± 0.07 0.10 ± 0.10 0.05 ± 0.05 0.25 ± 0.10*
Inferior Pre Post 1.21 ± 0.28 2.05 ± 0.33* 1.27 ± 0.33 2.00 ± 0.43* 1.1 ± 0.23 3.00 ± 0.29** 1.15 ± 0.18 2.25 ± 0.29** Severity staining (modified Baylor Scale score)
Inferior Pre 0.05 ± 0.05 0.13 ± 0.13 0.15 ± 0.11 0.00 ± 0.00
Post 0.21 ± 0.14 0.33 ± 0.19 0.80 ± 0.23** 0.60 ± 0.20**
Conjunctival staining (mean) Pre 0.68 ± 0.15 0.60 ± 0.16 0.63 ± 0.19 0.60 ± 0.13
Post 0.89 ± 0.25 0.73 ± 0.18 0.80 ± 0.19 0.68 ± 0.12
Schirmer test (without anesthesia) Pre Post 11.11 ± 2.37 11.53 ± 2.00 14.33 ± 2.61 13.20 ± 2.36 14.70 ± 2.31 14.80 ± 2.01 10.80 ± 1.87 11.00 ± 1.95
SUMMARY
47
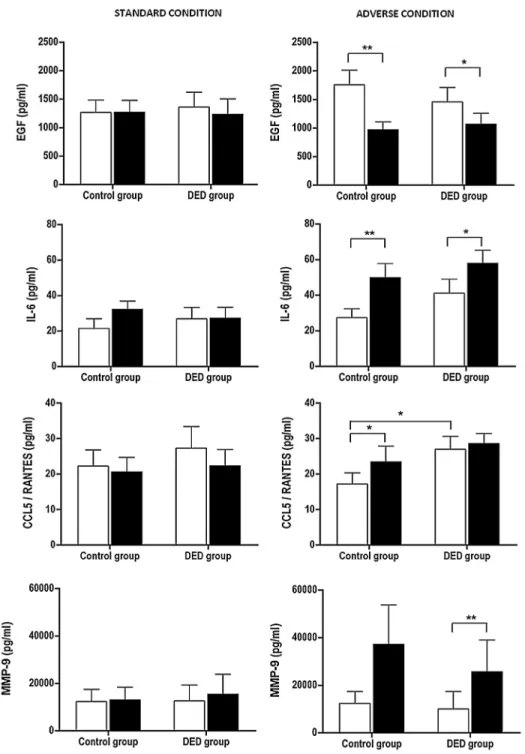
Analysis of Tear Molecules
Among the 16 molecules analyzed in tears, CX3CL1/Fractalkine, EGF, CXCL8/IL-8, IL-1RA, CXCL10/IP-10, and MMP-9 were detected in more than 90% of both groups prior to and after undergoing either controlled environmental condition. IL-6, CCL5/RANTES, and VEGF were detected in 58-80% of both groups prior to entering the environmental chamber and 69-90% after exposure to either environment. The detection rates for IFN-γ, IL-12p70, IL-17, IL-10, IL-1β, and TNF-α were below 30% for both groups under both
exposure conditions, and therefore not considered to be statistically relevant.
SUMMARY
48
Figure 2. Inflammatory molecules that showed significant changes. Standard Condition, left
SUMMARY
49
STUDY III.
JUSTIFICATION MODEL
HYPOTHESIS
Healthy subjects from two different parts of the world with different climatic
conditions will present different basal values” in the clinical diagnostic tests that
evaluate the LFU, due to the influence of environmental conditions.
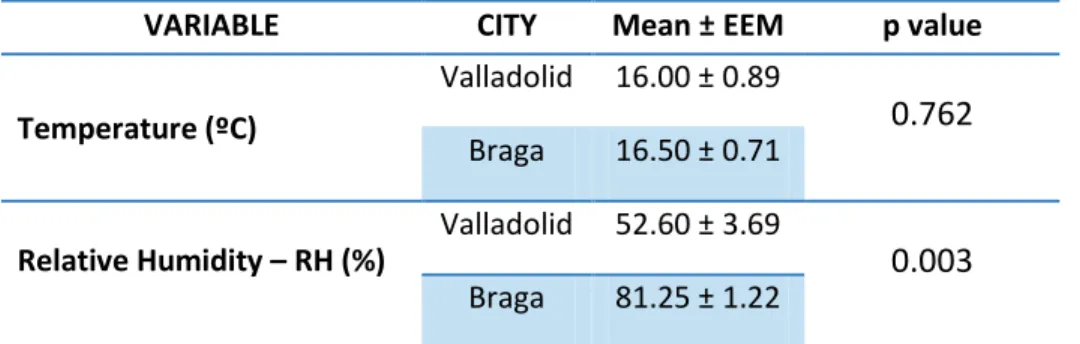
To test this hypothesis, we chose a geographic location climatically different
from Valladolid. Valladolid’s climatic characteristics correspond to a
cold-mediterranean (with continental-like features) weather. Braga, in the north
coast of Portugal, has temperate-cold maritime climate and there is where Dr.
Meijome’s team is located (CEORLab, Departament of Physics, University of
Minho).
OBJECTIVE
The objective of this study was to evaluate a sample of healthy subjects using
the same protocol previously detailed for Study I and II and compare them with
SUMMARY
50
METHODOLOGY
Participants
The study protocols were approved by the institutional review board of the
Institute for Applied OphthalmoBiology (IOBA), University of Valladolid and the
University of Valladolid Medical School Ethics Committee. The study adhered
to the tenets of the Declaration of Helsinki. All enrolled subjects were informed
of the nature of the study and consent forms were signed. The same examiner
of studies I and II (MTY) always performed all evaluation tests of this study.
A sample of 14 healthy controls (7 men and 7 women), belonging to the
previous studies I and II performed in Valladolid was selected. This group was
composed with all individuals who participated in both studies during the
months of April, May, and June 2011 and 2012, as these were the same
months in which the Braga study was carried out. During this period, 14 healthy
individual (7 men and 7 women), age and gender-matched to those previously
evauated were screened and eventually examined in two more visits.
The evaluation tests perfomed during the screening visit and during the 2
evaluation visits, as weel as their sequence, were the same previously used in
SUMMARY
51
Tear osmolarity measurement and analysis of molecules in tears could not be
perfomed because the TearLab® and the Luminex machine were not available
at the CEORLab and it was decided again their shipment.
Only one eye of each individual was included in the study. The selection was
performed with the same procedure using in the protocol of doctoral study in
Valladolid (see methodology: participants of comparative analysis studies I and
II).
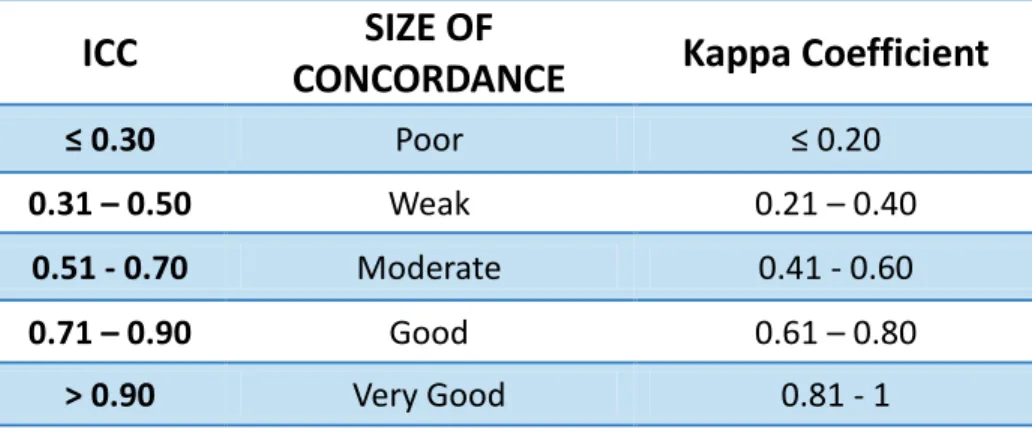
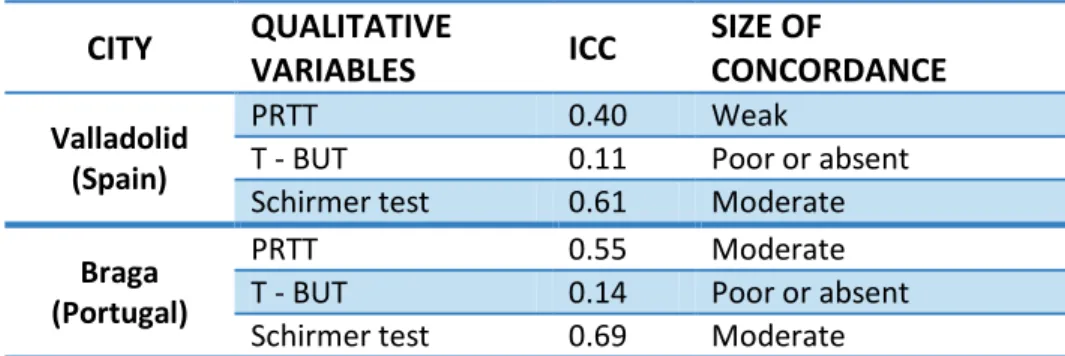
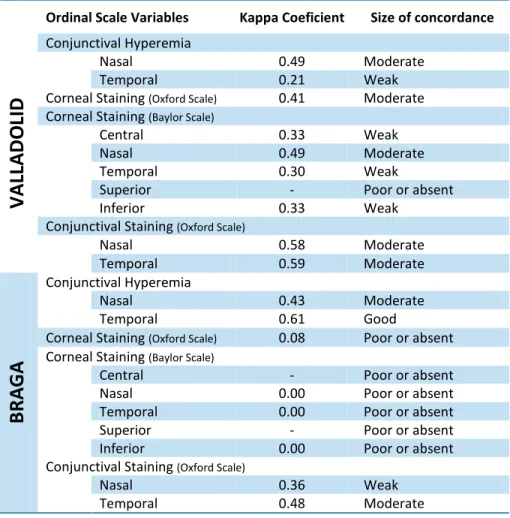
Data was analyzed with SPSS software (RDC Team., 2006). Reliability of
diagnostic tests was analyzed statistically to determine the best way to
compare the measurements obtained in both cities. Intraclass Correlation
Coefficient (ICC) (Fleiss et al., 1986) for quantitative variables (PRTT, T-BUT
and Schirmer test) and Kappa Coefficient (Landis., 1977) for ordinal scale
variables (corneal and conjunctival staining and conjunctival hyperemia) were
used to analyze variability of measures. Both ranges were between 0 and 1.
The total variability of the measurements had two components: the variability
due to differences between subjects and the variability due to differences
between the measurements for each subject (Table 4). The maximum possible
agreement corresponding to the value 1, which means that all the variability
observed is due to differences between subjects and not at the different
measurements taken at different times. A 0 value means that the observed
SUMMARY
52 Table 4. Magnitude of the concordance for ICC and Kappa Coefficient.
ICC
CONCORDANCE
SIZE OF
Kappa Coefficient
≤ 0.30 Poor ≤ 0.20
0.31 – 0.50 Weak 0.21 – 0.40
0.51 - 0.70 Moderate 0.41 - 0.60
0.71 – 0.90 Good 0.61 – 0.80
> 0.90 Very Good 0.81 - 1