1
Influence of protein source on the characteristics of gluten-free
layer cakes
Marta Sahagún*, Ángela Bravo, Guillermo Báscones, Manuel Gómez
Food Technology Area. College of Agricultural Engineering. University of
Valladolid, 34071 Palencia, Spain.
Tel: +34 979108495; fax +34 979-108302
*
Corresponding author e-mail:
msahaguncs@gmail.com
Abstract
The aim of this study was to examine the effect of four commercial proteins (pea, rice, egg white and whey) on the characteristics of gluten-free layer cakes. Rice flour was partially substituted with 15, 30 and 45% protein. Hydration properties, batter density and viscosity, cake characteristics (weight loss, specific volume, texture and colour) and consumer acceptability were analysed. In general, the addition of protein increased the viscosity of the batters, with higher protein contents exhibiting greater effects and with pea protein presenting the highest effect overall. The addition of egg white protein led to the hardest cakes (p<0.05) and whey protein, which also increased the cake hardness (p<0.05), gave rise to cakes with the highest specific volume. Both animal proteins increased the cake cohesiveness and springiness (p<0.05). On the contrary, pea and rice protein hardly modified hardness, colour and specific volume of cakes overall, but reduced their cohesiveness (p<0.05). Regarding sensory evaluation, all protein-enriched cakes presented lower acceptability with respect to control cake (p<0.05), but this effect was more pronounced when rice and egg white protein were added due to their taste, odour and texture. Whey protein cakes were, among the enriched samples, the ones with the highest acceptability.
2
1.
Introduction
Over recent years, the market demand for gluten-free products has increased significantly. One of the reasons for this increasing trend is the rise in diagnosed cases of celiac disease (Gallagher, Gormley, & Arendt, 2004). Although the prevalence of celiac disease is approximately 1% of the general population in Europe and the United States, the sole treatment is a unique gluten-free diet (Niewinski, 2008). However, there are also people who follow a gluten-free diet without suffering any celiac pathology, as they believe in its benefits for health orweight loss. (Staudacher & Gibson, 2015).
Currently, gluten-free products have lower protein content than their equivalent products with gluten (Miranda, Lasa, Bustamante, Churruca, & Simon, 2014; Wu et al., 2015). This lack should be compensated, as proteins are one of the basic nutrients necessary for various anabolic processes in the body (Hoffman & Falvo, 2004). In addition, some authors reported that a greater protein intake could have beneficial health effects for athletes (Phillips, 2014) and elderly people (Nowson & O’Connell, 2015). Due to this, the addition of different proteins to gluten-free bakery products could be a way to address the potential consequences of the current market demand.
3 animal proteins. To cover the existing gaps, the aim of this study was to study how three percentages (15, 30 and 45%) of different vegetal (pea and rice) and animal (egg white and whey) commercial proteins affected batter (density and viscosity), physical characteristics (specific volume, weight loss, texture and colour) and acceptability of gluten-free layer cakes.
2. Materials and methods
2.1 Materials
Rice flour (12.83% moisture, 8% protein and 85.4 μm particle size) was supplied by Harinera la Castellana S.A (Medina de Campo, Valladolid, Spain), Nutralys BF pea protein (78.13% protein and 134.0 μm particle size ) by Roquette (Leutrem, France), Remypro N80+G rice protein (79% protein and 95.2 μm particle size) by Beneo (Mannheim, Germany), egg white powder (81.66% protein and 30.7 μm particle size) by EPS S.P.A (Occhiobello, Italy) and Provon 295 IP whey protein (92% protein and 39.7 μm particle size) by Glanbia (Kilkenny, Ireland). Particle size was measured with a laser diffraction particle size analyser (Mastersizer 3000, Malvern Instruments, Ltd., Worcestershire, UK) and it was expressed as D(4;3), which reflects the size of those particles which constitute the bulk of the sample volume. Other ingredients were white sugar (AB Azucarera Iberica, Valladolid, Spain), UHT whole milk (President, Lactalis Food Service Iberia, S.L.U., Madrid, Spain), liquid pasteurized egg (Ovopack, Álvarez Camacho, S.L., Sevilla, Spain), refined sunflower oil (Langosta, F. Faiges, S.L., Daimiel, Ciudad Real, Spain) and baking powder “25 × 1” (Puratos, Gerona, Spain).
2.2 Methods
2.2.1 Cake elaboration
The layer cake was elaborated using the following formulation: 350 g rice flour, 315 g sugar, 210 g milk, 175 g liquid pasteurized egg, 105 g sunflower oil and 10.5 g baking powder. In the protein-enriched formulations, the rice flour was replaced by 15, 30 or 45% of each commercial protein (rice, pea, egg white and whey). The moisture of flour and flour-protein blends was adjusted to 13%. All ingredients were mixed using a KitchenAid Professional mixer (Kitchen Aid, St. Joseph, Michigan, USA) for 10 min: 1 min at speed 4 and 9 min at speed 6. The cake batter (185 g) was placed into oil-coated aluminium pans (159 × 119 × 35 mm) and baked at 190 °C for 25 min. After baking, the cakes were removed from the pan, left to cool for 1 h at room temperature and packaged in polyethylene bags to be stored at 24 ºC. All the cake elaborations were performed twice.
4 Batter density (at 20 °C) was determined by an Elcometer 1800 pycnometer (Manchester, UK) with a known volume (100 cm3). The density value was calculated as the relation of the weight (g) of batter placed in the filled pycnometer and the volume capacity of the container.
Batter viscosity was measured using a Rapid Viscoanalyser (RVA-4) (Newport Scientific model 4-SA, Warriewood, Australia). A batter sample (28 g) were placed in an RVA aluminum canister with a plastic paddle and submitted to a viscosity analysis (160 rpm at 30 °C).
For batter microstructure, a drop of the batter was placed on a microscope slide and covered with a coverslip. The slides were compressed under a constant weight (1 kg) to achieve a layer of batter of uniform thickness, removing the highest amount of air bubbles as possible. The batter samples were examined using a DM750 microscope (Leica Microsystems, Wetzlar, Germany). The microscope was equipped with a Leica EC3 video camera, and images were captured using LAS-EZ V1.7.0 for Windows software (Leica Microsystems, Heerbrugg, Switzerland).
The microscope was also equipped with a PE120 System equipped with PE95 controller, ECP water circulator (Linkam Scientific Instruments, Surrey, United Kingdom) and a GS3-U3-23S6C-C camera (FLIR Systems, Wilsonville, USA) to capture the videos. For that, the batter, prepared in the same way as that to capture images, was heated until reaching 30 ºC and was then maintained at this temperature for 3 min. Next, the sample was heated further until reaching 85 ºC with a heating rate of 14 ºC/min. Finally, the sample was warmed up until attaining 100 ºC (at 2.5 ºC/min heating rate) and was maintained at this temperature for 10 min. This temperature ramp was used to simulate the heating process that the batter undergoes during baking. All measurements were realized twice.
2.2.3 Cake characteristics
Cake volume was obtained from two pieces of each elaboration using a laser sensor with the BVM-L 370 volume analyser (TexVol Instruments, Viken, Sweden). Specific volume and weight loss were calculated according to de la Hera, Martinez, Oliete and Gómez (2013).
Crumb texture was determined using a TA-XT2 texture analyser (Stable Microsystems, Surrey, UK) with the “Texture Profile Analysis (TPA)” test. A 25-mm-diameter cylindrical aluminium probe was used in a double compression test, penetrating to 50% of the initial height at a speed of 2 mm/s, with a 30-s delay between the first and second compression and the measurements were realized on the centre of cake slices. From each cake batch, two cakes were sliced into slices of 20 mm in thickness and the three central ones of each cake were analysed. Hardness (N), cohesiveness and springiness were calculated from the TPA graphic.
5 five points of the surface of two cakes from each elaboration. Crumb colour was obtained from the measurements of two slices of two cakes from each preparation. Both results were expressed in the CIELAB colour space with the lightness coordinate L*, a green-red-oriented coordinate a* (-a*: greenness, +a*: redness) and a blue-yellow-oriented coordinate b* (-b*: blueness, +b*: yellowness) (Witt, 2007).
The measurement of cake characteristics was carried out 24 h after baking. 2.2.4. Consumer test
Sensorial evaluation of cakes was completed by 100 volunteers, who were from 16 to 65 years of age and usual consumers of cakes. Cakes were divided into pieces of 2 cm wide and presented on white plastic plates coded with four-digit numbers and served in random order. One entire cake was presented on the principal table for its appearance to be evaluated. The cakes were evaluated based on consumer acceptance of their appearance, odour, texture, taste and overall acceptability. This evaluation was completed by using a hedonic scale of 9 points. This scale ranged from “I like very much” (9 score) and “I dislike very much” (1 score).
2.2.5 Statistical analysis
The results obtained were assessed by an analysis of variance (one-way ANOVA) with the Fisher’s least significant differences (LSD) test and with significance level of 95% (p<0.05). Statistical analysis was completed using Statgraphics Centurion XVI software (StatPoint Technologies Inc, Warrenton, EEUU).
3. Results and Discussion
3.1. Batter characteristics
6 The increment of the protein added led to greater amount and size of bubbles, which was related to the drop of density whenever the percentage of whey protein went up. The addition of 45% whey protein increased the number of bubbles compared to control and their size was the highest, which led to the fact that this sample had the lowest density.
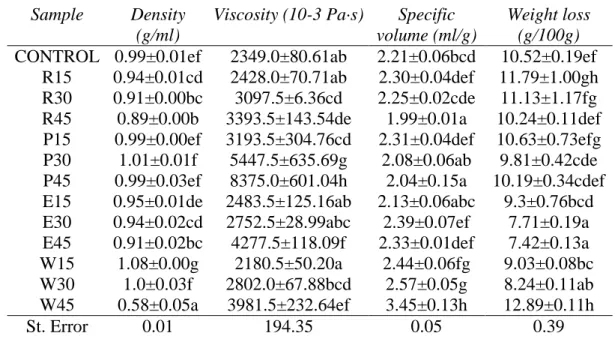
Table 1. Characteristics of batters and layer cakes elaborated with three percentages of pea (P), rice (R), egg white (E) and whey (W) proteins.
Sample Density
(g/ml)
Viscosity (10-3 Pa·s) Specific
volume (ml/g)
Weight loss (g/100g) CONTROL 0.99±0.01ef 2349.0±80.61ab 2.21±0.06bcd 10.52±0.19ef
R15 0.94±0.01cd 2428.0±70.71ab 2.30±0.04def 11.79±1.00gh R30 0.91±0.00bc 3097.5±6.36cd 2.25±0.02cde 11.13±1.17fg R45 0.89±0.00b 3393.5±143.54de 1.99±0.01a 10.24±0.11def P15 0.99±0.00ef 3193.5±304.76cd 2.31±0.04def 10.63±0.73efg P30 1.01±0.01f 5447.5±635.69g 2.08±0.06ab 9.81±0.42cde P45 0.99±0.03ef 8375.0±601.04h 2.04±0.15a 10.19±0.34cdef E15 0.95±0.01de 2483.5±125.16ab 2.13±0.06abc 9.3±0.76bcd E30 0.94±0.02cd 2752.5±28.99abc 2.39±0.07ef 7.71±0.19a E45 0.91±0.02bc 4277.5±118.09f 2.33±0.01def 7.42±0.13a W15 1.08±0.00g 2180.5±50.20a 2.44±0.06fg 9.03±0.08bc W30 1.0±0.03f 2802.0±67.88bcd 2.57±0.05g 8.24±0.11ab W45 0.58±0.05a 3981.5±232.64ef 3.45±0.13h 12.89±0.11h
St. Error 0.01 194.35 0.05 0.39
Data are expressed as means ± SD of duplicate assays. The numbers that appear in the sample name column indicate the percentage of protein added. The values with the same letter in the same column do not present significant differences (p<0.05).
Comparing animal and vegetal proteins, the main difference between them was the presence of coalescence phenomena, which only occurred with vegetal types. This different behaviour could be explained because whey and egg white proteins have good foaming properties, favouring bubble formation and stabilization (Richert, 1979).
7 mixtures reduces the amount of free water available to assist the movement of particles in batters and, accordingly, leads to higher viscosity. This could explain the higher viscosity of the batters with vegetal proteins since this increased the WBC of the blends (Mancebo, Rodriguez, & Gómez, 2016; Shin, Gang, & Song, 2010). However, animal proteins usually reduce the WBC (Sarabhai & Prabhasankar, 2015), so the previous explanation is not applicable to these proteins. Thus, the effect of animal proteins on batter viscosity could be explained by their foaming capacity, as this was further supported by the presence of a greater amount of bubbles in batters with higher percentages of protein. In fact, it is know that the higher amount of incorporated air in batters, the greater their consistency (Torres, Hallmark, & Wilson, 2015).
Fig. 1. Batter microstructure 100 times magnification of layer cakes elaborated without (control) and with three percentages of pea (P), rice (R), egg white (E), and whey (W) proteins.
3.2. Cake characteristics
8 bubbles decreases, and therefore, the consistency of this phase after starch gelatinization would also be reduced. This causes a greater mobility of bubbles in the last stage of baking (coalescence phenomena), generating bubbles with higher size and making it possible for them to escape out of the product. This effect was observed in the complementary videos (Video 1) and the Figure 1. In the case of animal proteins, a contrary effect was observed, asthe higher the protein substitution percentage, the greater the specific volume of cakes. The increasing effect was more significant with 45% whey protein, which is the cake with the highest specific volume, and this fact would be related to the lowest batter density as well as the distribution of bubbles However, the addition of 15% egg white protein did not produce significant differences with respect to control sample (p>0.05). Even so, Matos et al. (2014) already observed an increase in muffin volume with 13% egg white protein. This phenomenon of increased volume could be due to the stabilizing action of the bubbles by proteins. During baking, the coagulation of egg white protein (Kiosseoglou & Paraskevopoulou, 2006) and the aggregation process of whey proteins (Koo, Chung, Ogren, Mutilangi, & McClements, 2018) occurred. As egg white and whey are soluble proteins, they could surround the bubbles, stabilizing them and reducing the coalescence phenomena. In fact, in the Figure 1 and Video 1 it is observed that despite the high mobility of bubbles in the final stages of baking, once the starch is gelatinized, the bubbles do not join together and do not escape outwards.
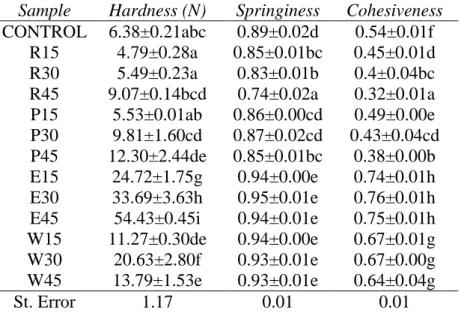
Table 2. Textural characteristics of layer cakes elaborated with three percentages of pea (P), rice (R), egg white (E) and whey (W) proteins.
Sample Hardness (N) Springiness Cohesiveness
CONTROL 6.38±0.21abc 0.89±0.02d 0.54±0.01f R15 4.79±0.28a 0.85±0.01bc 0.45±0.01d R30 5.49±0.23a 0.83±0.01b 0.4±0.04bc R45 9.07±0.14bcd 0.74±0.02a 0.32±0.01a P15 5.53±0.01ab 0.86±0.00cd 0.49±0.00e P30 9.81±1.60cd 0.87±0.02cd 0.43±0.04cd P45 12.30±2.44de 0.85±0.01bc 0.38±0.00b E15 24.72±1.75g 0.94±0.00e 0.74±0.01h E30 33.69±3.63h 0.95±0.01e 0.76±0.01h E45 54.43±0.45i 0.94±0.01e 0.75±0.01h W15 11.27±0.30de 0.94±0.00e 0.67±0.01g W30 20.63±2.80f 0.93±0.01e 0.67±0.00g W45 13.79±1.53e 0.93±0.01e 0.64±0.04g
St. Error 1.17 0.01 0.01
9 In different studies, a positive correlation between specific volume and weight loss was observed (de la Hera et al., 2013), because of a higher surface in contact with air (Zhou & Therdthai, 2008). In our study, this trend was observed in cakes with vegetal proteins but not with animal proteins. In these cases, the higher surface of contact could be compensated for by differences in the internal structure of cakes, with finer cell grain, complicating the exit of water from the interior of the cakes.
Regarding texture (Table 2), the cakes with vegetal proteins followed a trend observed in other studies (de la Hera et al., 2013), in which the lower the specific volume, the higher the cake hardness. However, only the cakes with 45% pea protein showed significant differences with respect to control (p<0.05). The effect of animal proteins was very different because, in spite of their higher specific volume, increased hardness were observed in all cases, with the cakes incorporating egg white protein exhibiting the highest hardness. The effect of whey protein could be explained by Díaz-Ramírez et al. (2016). Theses authors attributed the increment of hardness with the phenomena of competition between sugar and whey protein. Due to the high solubility of whey protein, the available water for sugar solubility was lower, and crystallization phenomenon was produced when sugar was exposed to heat. Thus, this crystallinity could decrease the quality of the cake by modifying the texture. In the case of cakes with egg white protein, as well as crystallization phenomenon, a process of coagulation was produced where the proteins denatured around 85 ºC, forming a protein network (Kiosseoglou & Paraskevopoulou, 2006; Wilderjans et al., 2013). This phenomenon together with the starch gelatinization would increase the viscosity of the batter during baking and impart solid character to the cake (Guy & Pithawala, 1981).
The addition of vegetal proteins also reduced the springiness and cohesiveness, with greater effect seen with the highest amount of protein and in the case of rice protein before pea protein. In fact, the cakes with 15 and 30% pea protein did not show significant differences in springiness with respect to control (p>0.05). On the other hand, the animal proteins presented a contrary effect, as they increased the springiness and cohesiveness of cakes. This is in agreement with Matos et al. (2014) who compared cakes with 13% of pea and egg white protein.
10 sugar, lysine has an important role because its ε-amino groups are a source of free amino groups (Pérez et al., 2013; Tamnak, Mirhosseini, Tan, Ghazali, & Muhammad, 2016). In this way, the differences of lightness between proteins could be explained by the different lysine content of each one.
Table 3. Crust colour parameters of layer cakes elaborated with three percentages of pea (P), rice (R), egg white (E) and whey (W) proteins.
Sample Crust L* Crust a* Crust b*
CONTROL 67.50±1.56e 7.69±1.58ab 30.94±3.87b R15 66.07±0.77e 8.20±1.82ab 31.03±4.29b R30 68.46±0.97e 6.17±2.52a 29.62±1.42b R45 63.71±2.48de 10.92±3.01b 28.62±0.99b P15 63.72±2.50de 11.0±2.59bc 28.87±2.86b P30 63.48±1.68cde 11.46±2.16bcd 25.56±1.93ab P45 57.38±3.60abcd 15.02±1.78de 25.19±4.27ab E15 52.69±6.94a 16.5±0.99e 26.67±9.09ab E30 55.43±1.87ab 17.79±0.77e 27.05±0.15b E45 55.80±5.17abc 17.90±0.19e 22.74±1.02ab W15 53.98±5.94a 16.6±1.56e 28.04±3.80b W30 52.14±4.57a 16.61±1.68e 18.51±5.75a W45 62.45±1.75bcde 14.95±1.02cde 27.98±1.45b
St. Error 2.56 1.30 2.78
Data are expressed as means ± SD of duplicate assays. The numbers that appear in the sample name column indicate the percentage of protein added. The values with the same letter in the same column do not present significant differences (p<0.05).
3.3. Consumer test
11 hardness and those with rice protein were the least cohesive. Control cakes were valued with the highest overall acceptability. Among protein-enriched cakes, those with whey protein presented the best evaluation, so it seems that the smell and taste have great importance in the global assessment of foods, something already observed in other studies (Pérez et al., 2013).
Table 4. Consumer test results of layer cakes elaborated with 30% of pea (P), rice (R), egg white (E) and whey (W) proteins.
Sample Appearance Odour Texture Taste Overall acceptability
CONTROL 6.83±1.19b 6.8±1.31d 6.74±1.68d 6.65±1.50e 7.02±1.42d R30 5.72±1.67a 4.55±2.03a 4.86±2.19b 3.49±1.93a 4.09±1.85a P30 5.78±1.64a 5.34±1.83b 6.02±1.84c 4.73±1.95c 5.33±1.71b E30 6.94±1.17b 4.78±1.61a 3.71±1.75a 4.02±1.89b 4.45±1.64a W30 6.79±1.47b 6.01±1.51c 5.62±1.78c 6.07±1.82d 6.07±1.59c
St. Error 0.15 0.17 0.19 0.19 0.17
Data are expressed as means ± SD of duplicate assays. The numbers that appear in the sample name column indicate the percentage of protein added. The values with the same letter in the same column do not present significant differences (p<0.05).
Fig. 2. Images of cakes without (control) and with 30% of pea (P), rice (R), egg white (E) and whey (W) proteins.
4. Conclusion
12 cake volume and generate harder crumb, while vegetal proteins give cakes similar to the control but with crumbs less cohesive and elastic. Therefore, it would be interesting to investigate the effect of mixtures of vegetal and animal protein in the future. Regarding acceptability of enriched layer cakes, the ones with whey proteins received the highest rating. In this research, it was proven for the first time, by microscopy analysis, that, although vegetal proteins yield batters with air bubbles that are less stables to heating, animal ones (whey and egg) help to stabilize these bubbles.
Acknowledgements
The authors acknowledge the financial support of the Spanish Ministry of Economy and Competitiveness (Project AGL2014-52928-C2) and the European Regional Development Fund (FEDER).
References
Brooker, B. E. (1993). The stabilisation of air in foods containing fat - A review. Food Structure, 12, 115–122.
de la Hera, E., Martinez, M., Oliete, B., & Gómez, M. (2013). Influence of flour particle size on quality of gluten-free rice cakes. Food and Bioprocess Technology, 6, 2280–2288.
https://doi.org/10.1007/s11947-012-0922-6
Díaz-Ramírez, M., Calderón-Domínguez, G., García-Garibay, M., Jiménez-Guzmán, J., Villanueva-Carvajal, A., Salgado-Cruz, M. de la P., … Del Moral-Ramírez, E. (2016). Effect of whey protein isolate addition on physical, structural and sensory properties of sponge cake. Food Hydrocolloids, 61, 633–639.
https://doi.org/10.1016/j.foodhyd.2016.06.020
Gallagher, E., Gormley, T. R., & Arendt, E. K. (2004). Recent advances in the formulation of gluten-free cereal-based products. Trends in Food Science and Technology, 15, 143–152. https://doi.org/10.1016/j.tifs.2003.09.012
Gómez, M., Ruiz-París, E., & Oliete, B. (2010). Influence of flour mill streams on cake quality. International Journal of Food Science and Technology, 45, 1794–1800.
https://doi.org/10.1111/j.1365-2621.2010.02338.x
Guy, R. C. E., & Pithawala, H. R. (1981). Rheological studies of high ratio cake batters to investigate the mechanism of improvement of flours by chlorination or heat treatment. International Journal of Food Science & Technology, 16, 153–166.
https://doi.org/10.1111/j.1365-2621.1981.tb01005.x
Hoffman, J. R., & Falvo, M. J. (2004). Protein - Which is best? Journal of Sports Science and Medicine, 3, 118–130.
Jyotsna, R., Manohar, R. S., Indrani, D., & Rao, G. V. (2007). Effect of whey protein
concentrate on the rheological and baking properties of eggless cake. International Journal of Food Properties, 10, 599–606. https://doi.org/10.1080/10942910601048986
13 Science and Technology (pp. 161–172). Ames, Iowa, USA: Blackwell Publishing.
https://doi.org/10.1002/9780470277553.ch8
Koo, C. K. W., Chung, C., Ogren, T., Mutilangi, W., & McClements, D. J. (2018). Extending protein functionality: Microfluidization of heat denatured whey protein fibrils. Journal of Food Engineering, 223, 189–196. https://doi.org/10.1016/j.jfoodeng.2017.10.020
Majzoobi, M., Ghiasi, F., Habibi, M., Hedayati, S., & Farahnaky, A. (2014). Influence of soy protein isolate on the quality of batter and sponge cake. Journal of Food Processing and Preservation, 38, 1164–1170. https://doi.org/10.1111/jfpp.12076
Mancebo, C. M., Rodriguez, P., & Gómez, M. (2016). Assessing rice flour-starch-protein mixtures to produce gluten free sugar-snap cookies. LWT - Food Science and Technology, 67, 127–132. https://doi.org/10.1016/j.lwt.2015.11.045
Matos, M. E., Sanz, T., & Rosell, C. M. (2014). Establishing the function of proteins on the rheological and quality properties of rice based gluten free muffins. Food Hydrocolloids, 35, 150–158. https://doi.org/10.1016/j.foodhyd.2013.05.007
Miranda, J., Lasa, A., Bustamante, M. A., Churruca, I., & Simon, E. (2014). Nutritional differences between a gluten-free diet and a diet containing equivalent products with gluten. Plant Foods for Human Nutrition, 69, 182–187. https://doi.org/10.1007/s11130-014-0410-4
Niewinski, M. M. (2008). Advances in celiac disease and gluten-free diet. Journal of the American Dietetic Association, 108, 661–672. https://doi.org/10.1016/j.jada.2008.01.011 Nowson, C., & O’Connell, S. (2015). Protein requirements and recommendations for older
people: A review. Nutrients, 7, 6874–6899. https://doi.org/10.3390/nu7085311
Pérez, S., Matta, E., Osella, C., de la Torre, M., & Sánchez, H. D. (2013). Effect of soy flour and whey protein concentrate on cookie color. LWT - Food Science and Technology, 50(1), 120–125. https://doi.org/10.1016/j.lwt.2012.06.015
Phillips, S. M. (2014). A brief review of higher dietary protein diets in weight loss: a focus on athletes. Sports Medicine, 44, 149–153. https://doi.org/10.1007/s40279-014-0254-y Richert, S. H. (1979). Physical-chemical properties of whey protein foams. Journal of
Agricultural and Food Chemistry, 27, 665–668. https://doi.org/10.1021/jf60224a036 Ronda, F., Oliete, B., Gómez, M., Caballero, P. A., & Pando, V. (2011). Rheological study of
layer cake batters made with soybean protein isolate and different starch sources. Journal of Food Engineering, 102, 272–277. https://doi.org/10.1016/j.jfoodeng.2010.09.001 Sahi, S. S., & Alava, J. M. (2003). Functionality of emulsifiers in sponge cake production.
Journal of the Science of Food and Agriculture, 83, 1419–1429. https://doi.org/10.1002/jsfa.1557
Sarabhai, S., & Prabhasankar, P. (2015). Influence of whey protein concentrate and potato starch on rheological properties and baking performance of Indian water chestnut flour based gluten free cookie dough. LWT - Food Science and Technology, 63, 1301–1308. https://doi.org/10.1016/j.lwt.2015.03.111
14 properties and application in gluten-free rice muffins. LWT - Food Science and Technology, 63, 927–933. https://doi.org/10.1016/j.lwt.2015.04.058
Shevkani, K., & Singh, N. (2014). Influence of kidney bean, field pea and amaranth protein isolates on the characteristics of starch-based gluten-free muffins. International Journal of Food Science and Technology, 49, 2237–2244. https://doi.org/10.1111/ijfs.12537
Shin, M., Gang, D. O., & Song, J. Y. (2010). Effects of protein and transglutaminase on the preparation of gluten-free rice bread. Food Science and Biotechnology, 19, 951–956. https://doi.org/10.1007/s10068-010-0133-8
Staudacher, H. M., & Gibson, P. R. (2015). How healthy is a gluten-free diet? British Journal of Nutrition, 114, 1539–1541. https://doi.org/10.1017/S000711451500330X
Subagio, A., & Morita, N. (2008). Effects of protein isolate from hyacinth beans (Lablab purpureus (L.) sweet) seeds on cake characteristics. Food Science and Technology Reasearch, 14, 12–17. https://doi.org/10.3136/fstr.14.12
Sung, M.-J., Park, Y.-S., & Chang, H.-G. (2006). Quality characteristics of sponge cake
supplemented with soy protein concentrate. Food Science and Biotechnology, 15, 860–865. Tamnak, S., Mirhosseini, H., Tan, C. P., Ghazali, H. M., & Muhammad, K. (2016).
Physicochemical properties, rheological behavior and morphology of pectin-pea protein isolate mixtures and conjugates in aqueous system and oil in water emulsion. Food Hydrocolloids, 56, 405–416. https://doi.org/10.1016/j.foodhyd.2015.12.033
Torres, M. D., Hallmark, B., & Wilson, D. I. (2015). Effect of bubble volume fraction on the shear and extensional rheology of bubbly liquids based on guar gum (a Giesekus fluid) as continuous phase. Journal of Food Engineering, 146, 129–142.
https://doi.org/10.1016/j.jfoodeng.2014.09.012
Wilderjans, E., Luyts, A., Brijs, K., & Delcour, J. A. (2013). Ingredient functionality in batter type cake making. Trends in Food Science and Technology, 30, 6–15.
https://doi.org/10.1016/j.tifs.2013.01.001
Wilderjans, E., Pareyt, B., Goesaert, H., Brijs, K., & Delcour, J. A. (2008). The role of gluten in a pound cake system: A model approach based on gluten-starch blends. Food Chemistry, 110, 909–915. https://doi.org/10.1016/j.foodchem.2008.02.079
Witt, K. (2007). CIE Color Difference Metrics. In J. Schanda (Ed.), Colorimetry: Undestanding the CIE System (pp. 79–100). Hoboken, NJ, USA: John Wiley & Sons, Inc.
https://doi.org/10.1002/9780470175637.ch4
Wu, J. H. Y., Neal, B., Trevena, H., Crino, M., Stuart-Smith, W., Faulkner-Hogg, K., … Dunford, E. (2015). Are gluten-free foods healthier than non-gluten-free foods? An evaluation of supermarket products in Australia. British Journal of Nutrition, 114, 448– 454. https://doi.org/10.1017/S0007114515002056
Zeng, X., Bai, W., Zhu, X., & Dong, H. (2017). Browning intensity and taste change analysis of chicken protein-sugar maillard reaction system with antioxidants and different drying processes. Journal of Food Processing and Preservation, 41, e13117.
15 Zhou, W., & Therdthai, N. (2008). Heat and mass transferts during baking of sweet goods. In S.