Land Reform, Latifundia and Social Development at Local Level
in Colombia, 1961-2010*
Jean-Paul Faguet
Fabio Sánchez
Marta-Juanita Villaveces
SERIE DOCUMENTOS DE TRABAJO
No. 177
Land Reform,
Latifundia
and Social Development at Local Level
in Colombia, 1961-2010
*Jean-Paul Faguet† Fabio Sánchez‡ Marta-Juanita Villaveces§
February, 2015
Abstract
The paper analyzes the effects of land reform on social development –poverty and land distribution- at the local level. Land reform in Colombia, understood as the allocation of public land to peasant, has granted 23 million hectares which comprises around 20% of Colombian territory and about 50% of usable productive land. Theoretically, the net impact of land reform on development is the combination of a poverty effect and a land distribution effect. Our findings suggest that land reform from 1961 onwards has slightly reduced poverty and mildly improved land distribution. Nonetheless, municipalities with strong presence of latifundia prior to 1961 have experienced both a slower drop in poverty and a weaker improvement of land distribution. This paper finds that prevalence of latifundia partially offset the positive effect of land reform in promoting social development.
Keywords: Land reform, land distribution, latifundia, poverty, local economic development, Colombia
JEL classification Q15, N16, H27
* We thank the comments of Timothy Besley, Xu Guo, Ana María Ibáñez, Leopoldo Fergusson, and several seminar audiences at
London School of Economics, Universidad de los Andes, Universidad del Rosario, Congreso Lationamericano de Historia Económica for their comments and helpful feedback. We are grateful to Laura Salas and Ramón Hernández for research assistance. We also acknowledge the INCODER for giving us access to historical database of land reform. Villaveces thanks the Department of International Development at LSE, for its support as a Visiting Scholar during 2014. The usual disclaimer applies.
† Professor, Department of International Development, London School of Economics,[email protected]
1
1. Introduction
It has been well established that unequal land distribution is negatively related to economic and social development and has been associated with low rural productivity, lack of access to land for peasants and high poverty indicators (Binswanger and Deinninger, 1993). Throughout the 20thcentury, land reform policies have been adopted as strategies to tackle land inequality and reduce poverty in rural areas. Despite the large number of land reform experiences across the world, results vary widely in terms of reduction of land inequality and poverty. Scholars suggest that the effect of land reform on development depends on the extent to which peasants have access to land and the degree of land transferability. In this paper, we found that the pre-existence of high land concentration in the form of latifundia is associated with the meager results of land reform in reducing poverty and improving the land ownership structure.
In Colombia, various land reform efforts have been made since Independence in the early 19th century to the present. Land reform has been a continuous policy over time aiming at providing land access based on three fundamentals: economic productivity, social development and peace. The central mechanism of land reform has been the transfer of state-owned land –the so-called baldios- to peasants in the form of property rights. As a long-term policy of delivering property rights to peasants, land reform would be expected to improve development indicators. However, to our knowledge, there has not been a systematic analysis of the effect of land reform on development, perhaps due to the lack of disaggregated information on public land allocation5.
Colombia´s land inequality has historically been high and currently is among the highest in Latin America (national land Gini coefficient was about 0.86 in 2010).6 After Independence, a dual landholding structure developed in Colombia with latifundia (large landholdings) dependent on large numbers of peasants and rural laborers, and minifundios (smallholdings) that made up the peasant subsistence economy. Over time, latifundia have grown, and land ownership has become even more concentrated (UN-Habitat , 2005); (Reyes, 2009)(Fajardo, 2000).
Therefore, long-term land reform policies are expected to be beneficial for economic development by reducing poverty and improving land distribution. Nonetheless, land reform policy is implemented under existing institutional arrangements that may positively or negatively affect its impact. Our research intends to show that if land reform occurs in places with high concentration of land –latifundia- its effects on poverty and inequality may be lower or even negative, which goes in line with what has been said about
5
Public vacant lands are called “baldíos” in Colombia.
6 Colombia is, after Paraguay, the most unequal country in terms of land distribution in Latin America. According to
2
land reform in Latin America. For instance, Lipton (2009) suggests that land reform has proven to be less effective in reducing poverty and creating employment in regions where great landlords own vast amounts of farmland, as is the case in Latin America.
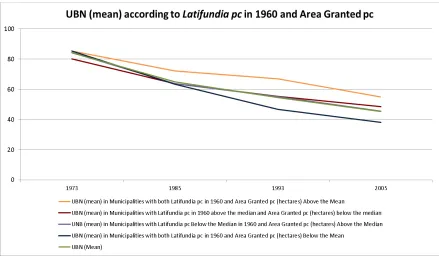
[image:4.612.85.524.281.543.2]In Colombia, the presence of previous latifundia and the extent of land reform display different patterns across municipalities and over time. For instance, not all municipalities with land reform show the same pattern of economic development and land structure. The data suggest an important interaction between former existence of latifundia and poverty in municipalities with land reform. The higher the prevalence of latifundia, the lower is the reduction of poverty over time. Besides if land reform occurs in places with previous high prevalence of latifundia, the impact of land reform on poverty and distribution is not only lower but can also have the opposite effect from what was intended.
3
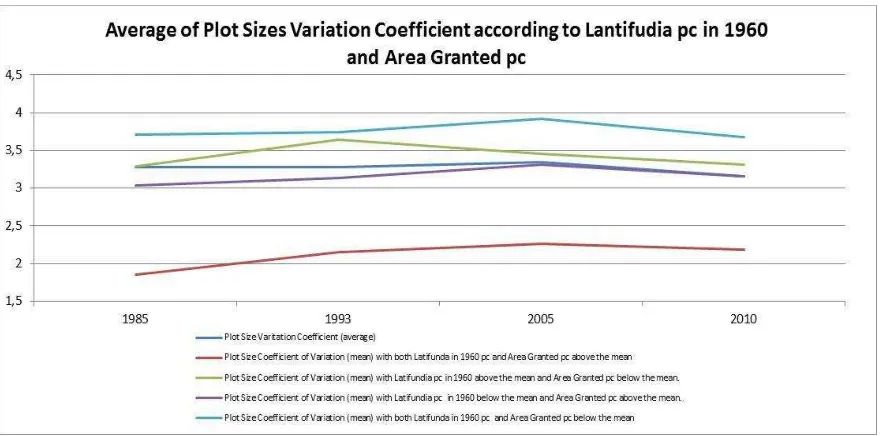
Figure 2.
Figures 1 and 2 exhibit the central thesis of our paper. Figure 1 illustrates that unmet basic needs (UBN) has dropped in municipalities with land reform and illustrates that in municipalities with greater prevalence of latifundia prior to land reform, poverty has decreased less than in municipalities with less prevalence of latifundia. In fact, municipalities with low and high levels of previous latifundia had about the same level of UBN (82%) in 1973, but subsequently UBN fell by about 40 points in municipalities with
low latifundia, with a difference of 10 points compared to municipalities with large
latifundia. The evidence suggests that land reform has had heterogeneous effects on
poverty reduction. While land reform may have improved UBN over time, the stylized facts of Figure 1 is also consistent with numerous descriptive and non-empirically tested analyses that emphasize the negative effects of Colombian land reform in areas with substantial presence of large landholdings.
4
Hence, this paper will attempt to address such findings more systematically and with the adequate empirical strategies.
We also hypothesize that the effects of land reform on poverty and land distribution are affected by the persistence of previous structure of land ownership. We suggest that land structures persist over time and attempts to lower land concentration through land reform policies would be hindered for the previous institutional arrangements that characterized latifundia. The result is that land is more likely to be concentrated in places with a presence of large landholdings whereas the opposite is likely to occur in regions with lower incidence of them. Thus, locations where the proportion of large landholdings prior to 1961 was relatively high land reform might have reinforced this pattern. This leads us to inquire extent to which the previous structure of land ownership affect the impact of land reform on development outcomes.
We explore this hypothesis using Colombia’s experience where land reform has a long history that continues to the present. The results indicate that land reform has contributed to poverty reduction measured in terms of unmet basic needs (UBN). Furthermore, public land allocations are associated with reduction of the indicators of land concentration –diminution of the Gini coefficient and of the coefficient of variation of plot sizes. However, we also found that the existence of latifundia prior to land reform curtails the effect of land reform on poverty reduction and land inequality. Hence, our findings match the literature on the negative impact of the concentration of wealth on development outcomes.
Our main contribution is that we quantitatively assess the effects of land reform on poverty and on land distribution at the municipal level. We empirically find that land reform reduces poverty nonetheless we do not have a clear idea of the channel whereby it occurs. We speculate land titling stemming from public land allocation may help to strengthen formal ownership and facilitate economic activity of the grantees. In addition, we analyse the heterogeneous effect of land reform on poverty in municipalities according to pre-existing prevalence of latifundia. To our knowledge, this is the first paper addressing the effects of land reform on development at the local level with panel data that takes into account 50 years of land reform. Furthermore, it is a genuine contribution to measuring the effect of land reform on poverty, and specifically to quantitatively determining the effects of prevalence of latifundia prior to the implementation of land reform of those indicators.
5
2. Related Literature
The effects of land reform on productivity, inequality, poverty, conflict and local politics has been a significant matter for scholars in terms of its policy relevance (e.g, (Berry & Cline, 1979); (World Bank, 1993); (Binswanger, Deininger, & Gershon, 1995); (de Janvry, Saboulet, & Davis, 1996);(Besley, Leight, Pande, & Rao, 2013); (Besley& Burgess, 2000; among others). Still, more attention has been given to the effects of land reform on productivity and poverty reduction than on inequality. As some scholars highlight (Bardhan, Mookherjee, Luca, & Pino, 2014), the effectiveness of land reform in changing the distribution of land ownership has not been seriously studied. This might be because the effect on distribution is not clear-cut and will depend on the type of land reform and the transferability of the land granted. Since our paper deals with the effects of land reforms on poverty, land distribution and latifundia in the Colombian context we will present in this section the relevant literature about these aspects.
Land Reform and Economic Development. The analyses on the economic effects of land reform do not provide conclusive results. Literature has presented three main factors associated with the effects of land reform on poverty: the type of contracts, the extent of land granted and the agricultural activities involved. In addition, the reasons that are presented to explain the results on inequality are: population growth, type of contracts and the extent of the property rights given to peasants.
6
Banerjee, Gertler and Ghatak (2002) examine the particular case of the West Bengal tenure reform on efficiency and underline the positive results on agriculture when reform incorporates laws that regulate rents, sharecropper tenure and transferability. Their empirical results suggest a twofold effect. On one side, reform increases the bargain effect of tenants by raising their share of landlord crops. On the other side, secure tenure may reduce efficiency if the landlord threatens eviction, and may increase efficiency if the tenant increases investment as a result of guaranteed tenure. In addition, they find empirical support of positive effects on productivity measured by differences with Bangladesh (without tenure reform and sharecropper registration). They find greater productivity in West Bengal where the share of Operation Barga in this improvement was 28 % compared to Bangladesh. In the same perspective, Bardhan and Mookherjee (2007) confirm the positive effects on agriculture; however their empirical analysis shows that direct effects on tenant farms are overshadowed by spill-over effects on non-tenant farms.
In the same line, Gauster and Isakson (2007) find that land reform in Guatemala has a marginal effect on land distribution, explained by three reasons: land reform was narrow in terms of the amount of land given to peasants, the quality of land was not good and access to land did not guarantee access to credit markets. Besides, Besteman (1994) suggests that land reform in Somalia benefits some groups; generally the less needy such as urban elites and civil servants instead of the poor; men rather than women and old people rather than the young population. Assunção (2006) studies the Brazilian land reform and finds differentiated effects of land reforms according to household income. He concludes that the policy implemented during the 1980s increased land ownership of poor families and also increased land concentration across the group of landholding families. By contrast, the findings of Sabourin (2008) indicate that land reform programs during the 1990s -loan-oriented- have been insufficient to drive up household income, suggesting that beneficiaries still depend on income from off-farm occupations. As Souza (2012) states, at the municipality level, even though the proportion of cultivated area increased significantly in the years coinciding with land allocation, this happened in the context of a much less promising crop output growth rate. He implemented a survey and concluded that from the peasant point of view, just owning a plot of land is not enough to enhance their standard of living.
The Mexican agrarian reform presents striking results. The case of Mexico is interesting because about half of the surface of the country was redistributed during the Revolution period in the form of Ejidos or collective lands.7There is a great consensus on the negative effects of agrarian reform on long term economic development. While land reform was a positive policy in terms of bringing stability to regions with insurgent activity (Dell, 2012) the effect on economic development was negligible in the sense that GDP could have been 124% higher in 1995 without land reform (Magaloni, Weingast, &
7
Cayeros, 2008) and (Albertus, Díaz-Cayeros, Magaloni, & Weingast, 2014); and unimportant for industrialization by preventing the establishment of agro-industrial activities (Dell, 2012). The empirical analysis of Dell (2012) shows that municipalities with revolutionary insurgency had about 22 percent more of their municipal surface area redistributed through land reform. However, municipalities with more insurgency are around 30 percent poorer today than nearby municipalities that did not have a revolutionary insurgence; and about 20% more of the labour force is in agricultural activities and 10% less in industry.
Land Reform and Land Concentration. In this paper we are interested in the combined effects of land reform and lantifundia, which denotes a situation of land concentration. There is a growing amount of literature addressing the economic effects of land inequality or land concentration: while the effect of land inequality on economic performance is usually regarded as negative, there is no unique reason to explain how it operates. Whereas some argue that the effects are negative (Galor, Moav , & Vollrath, 2009) others show that after a long period of time the negative effects disappear and no longer explain differences in development performance (Summerhill, 2010); (Acemoglu, Bautista, Querubín, & Robinson, 2007).
The institutional and economic history literature has pointed out the relevance of land distribution to explain economic performance. For instance, (Galor, Moav , & Vollrath, 2009) claim that before the industrial revolution opposing interests of landlords and capitalists reveal different intentions toward education policies. Landlords were mainly interested in reducing rural labour mobility, whereas industrialists needed an educated workforce to boost industrial productivity. Moreover, they find evidence showing that in societies with high land concentration, inefficient education policies persist, delaying growth and industrialization. By contrast, in societies with land ownership distributed more equally, growth-enhancing education policies were implemented at earlier stages, positively affecting the process of development.
8
Baland and Robinson (2008) and Conning and Robison (2002) present the microeconomic foundations for a political-economic equilibrium with high land inequality and production inefficiency that persists over time. Those works suggest that when the agricultural and land structure is closely and jointly determined by the political arrangement, there are greater chances of an inefficient equilibrium with latifundia. Accordingly, “where land inequality is highest, there is a greater incentive to challenge property rights via the political system, and this makes landlords more likely to organize agriculture in a politically defensive manner, by limiting tenancy” (Baland and Robinson, 2008: 4).
Martinelli (2012) assesses latifundia in the context of Italian post WWII land reform and its implication on development arguing that negative effects of land distributions operate through market mechanisms rather than through political or cultural mechanisms. His empirical evidence shows that local latifundia in the context of barriers to factor mobility will give market power to landowners having an impact on the resulting market equilibrium. In a similar way, Conning (2003) is concerned with the effects of latifundia and proposes a theoretical framework to understand why initial land inequality could lead to persistently inefficient allocations and slower growth. By modelling landlord market decisions he concludes the rent advantages of land inequality in the context of unsecure property rights.
Deininger and Squire (1998), present a cross-country analysis of the relation between initial land inequality and economic growth. They find that land inequality measured as the distribution of landholdings in agricultural activities according to the FAO, is negatively associated with long-term growth, but this inequality affects the income of the poor rather than the wealthy households. Summerhill (2010) analyses the long-term effects of colonial institutions on economic performance in Brazil. In terms of land distribution, he finds that the colonial land arrangement called aldeamento8 is positively correlated with current income per capita. In other words, historical land concentration is associated with better income per capita in the 20th century in opposition with the reversal of fortune hypothesis. In the same perspective, Acemoglu et al. (2007) find that municipalities that had unequal land distribution in Cundinamarca in the 19th century are more developed today.
Land Reform in Colombia. Lastly, Colombian literature on land reform has mainly addressed the political and social unrest related with competing land interests and public land allocation (LeGrand, 1988); (Bejarano, 1987); (Palacios, 2009); (Machado, Ensayos para la historia de la política de tierras en Colombia. De la Colonia a la creación del Frente Nacional, 2009); (PNUD, 2011)(García A. , 1980), among others. The general
8
Aldeamentos were settlements assigned by the Crown to Jesuits, including the existing native populations, in exchange of
9
argument is that land reform does not succeed as a social mechanism to stop violence. The persistence of social conflict in rural areas is a consequence of negative land reform effects and its inability to foster economic development and reduce inequality; a strong statement that does not differentiate economic performance of rural areas as a whole from regions with land reform, implying that negative rural performance might be a result of land reform.
Available studies dealing with the economic effects of land reform offer scarce data and empirical evidence. Balcázar, López and Vega (2001) assess the social and economic effects of the 1961 Land Reform Act. They surveyed households that benefitted from land awards in 1962 in three departments of Colombia, finding that land reform did have an effect on productivity, but that the household income of beneficiary families was lower than that of non-beneficiary families. This result is striking as it suggests that land reform entails greater land productivity, but it is insufficient to achieve household income and quality of life similar to that of other families in the region. Heshusius (2005) finds positive effects on income, associated with access to credit and work training of at least one household member.
In addition, Colombia´s literature on land reform places special emphasis on the correlation between land allocation and conflict and inequality, in a circular argument where land reform is cause and effect of conflict and unequal distribution, but lacking empirical support for this statement. Nonetheless, a great consensus among scholars suggests that land reform has been inefficient in reducing poverty and land inequality. One of the major reasons they give is that the large landholder elite has sufficient power to re-concentrate the land that was given to peasants by buying back or encroaching on their lands. In addition, it has been said that in Latin America land property rights were often granted to people who were politically well-connected but not necessarily productive farmers, therefore land access had some limits as a path for development (Bardhan and Mookherjee, 2007). In terms of land distribution, we do not find any work that assesses the effects of land reform on land concentration. Still, some studies do point out that land inequality has risen from 2000 to 2009 and is higher in regions that have been recently settled and where the presence of the state is weak (Gáfaro, Ibáñez, & Zarruk, 2012); and (Gutiérrez, 2014).
10
economic outcomes of latifundia compared to the traditional view in the sense that some current positive effects are found in regions where land was highly concentrated in the 19th century (Acemoglu, Bautista, Querubín, & Robinson, 2007); (García C. , 2005); (Galán, 2011).
Our paper is therefore related to the growing literature on the economic effects of land reform on local development (Besley& Burgess, 2000; Besley et al, 2013; Bardhan and Mookherjee, 2007; Bardhan et al. 2014, Magaloni, 2008; Dell, 2012). The literature focuses primarily on the motivation and extent of land reform and its linkage to poverty reduction, land distribution and economic activity enhancement at the local level, but empirical work on the long run economic effects of land reform is limited. Our paper is also related to recent literature on latifundia and economic outcomes (Conning, Martinelli, 2012; Galoret al., 2009), which assesses the impact of latifundia and land inequality on economic performance mainly through the detriment of human capital investment and control over the land market by the landed elite. Lastly, this paper contributes to the political economy approach to the relationship between inequality, redistribution and economic growth.
3. Latifundia and Land Reform in Colombia
3.1.Historical background of latifundia
Land distribution in Colombia is extremely unequal, with concentration of land ownership among the highest in the world and second highest in Latin America after Paraguay. Inequality in access to land is closely linked to rural poverty and the economic exclusion of the rural population. Attempts to reverse the concentration of land ownership have so far been unsuccessful, as large estates –latifundia- have never been affected (USAID, 2010)(USAID, 2010)
The highly concentrated Colombian land distribution is deeply rooted in the colonial and 19th century agrarian frontier expansion. During the colonial period, large properties emerged as a result of the system of encomiendas established by the Spanish Crown and later with the formation of the haciendas. Encomiendas were a grant from the Crown to produce, extract tributes and use the labour force of the indigenous peoples who lived in the area granted in exchange for protecting and Christianising them. Technically the
encomienda did not assign ownership to the encomendero but an inheritable right to use the
land. However, in practice encomiendas were treated as private property. The system of
hacienda was the emergence of private properties as landlords expanded their land titles.
11
smaller plots of land as well. Changes in land structure were also affected by changes in the population and new demand for land by groups of outsiders (mainly mestizos). On one side, the reduction of the indigenous population reduced the size of the reservations as landless mestizos invaded them and, on the other side, the Crown responded to the demand for land by selling existing public lands to peasants and landlords.
As Colmenares (1997) suggested, colonial encomiendas gave birth to great estates –the
latifundia9. And the colonial indigenous reservations –Resguardos- gave rise to small
estates –minifundios- in certain Colombian regions. According to Ankersen and Rupert (2006), the early land policy of the Crown inevitably led to the inequitable distribution of land in much of the New World. During the 19th century, land concentration persisted with the existing system of haciendas and the concentration of public land given to private parties to redeem government debt bonds. However, the demand for land arising from a growing population created a process of frontier settlement by squatters who enforced de facto ownership, giving rise to medium and small rural holdings, thereby accentuating unequal distribution.
In spite of the continuous land reform efforts in Colombia, land concentration persists. Some suggest that land policies have played in favour of large landholders, who not only benefited from specific subsidies and credits, but also by capturing small plots of land held by peasants. As a result, there has not been a significant change in land structure, and the
latifundia remain and even have increased in size (Mora, 2007). Scholars suggest that land
distribution and concentration reveals the inability of policies to affect land ownership and reduce unequal distribution (Machado, 1998);(PNUD, 2011); (Reyes, 2009); (Kalmanovitz and López, 2003), among others).
Overall, the area of Colombia is 114.2 million hectares, of which about 32 million hectares have been handed over and titled as indigenous reservations (28%); 5.2 million were granted to ethnic communities of African descent (about 4.5%); and 15 million hectares belong to the National Parks and Reserves (13%). According to cadastral data, about 60 million hectares are registered as private property (both individuals and state-owned, equivalent to around 52%). From 1901 to 2012, the State has granted nearly 23
9The relationship between proportion
of latifundia in a particular municipality in 1961 and the structure
of the colonial institutions can be established through the following equation:
N=634 R2=0.16. All variables are significant at 1%.
The equation suggests that the formation of latifundia were affected by two forces: a positive one driven by
12
million hectares (20%) of Colombian total area to peasants and agricultural businesses in over approximately 565,000 plots.
For us, these figures clearly demonstrate the magnitude of land reform in Colombia since the 20th century. Taking into account the allocation of collective land to ethnic communities (indigenous and afro) plus the allocation to peasants, 57% of the nation’s land has been transferred from the State to private owners. Nonetheless, leaving aside collective grants, land reform accounts for about one-third of the rural private cadastre in Colombia, meaning that a very large number of rural properties have been allocated through the mechanism of land reform. Therefore, it would be naïve to underestimate the effect of this enormous policy on economic, social, political and territorial matters. In addition, the persistence of land reform for over more than a century reveals the importance and magnitude of this state policy.
Despite the magnitude of the land reform policy, rural land distribution in Colombia has been characterized by a dualistic ownership structure –few large landowners and many
small landholders- since colonial times. This high level of land inequality has actually
increased in the last two decades. As Helo and Ibañez (2011) highlight, around 42% of land is concentrated in large properties of more than 200 hectares. About 40% of landholdings are mid-sized and 18% are properties of less than 20 hectares. In addition, the land Gini coefficient was 0.863 in 2009. In this sense, it is of interest to study the effects of land reform on land distribution.
In terms of development, rural areas have experienced important but insufficient changes in the past decades. Rural poverty has dropped in the past decade from 79% of the rural population to 49% in 2008; however, extreme poverty is still high and greater than urban extreme poverty. Furthermore, rural wealth is lower than urban wealth and extremely concentrated, thereby deepening income inequality (Castañeda & Escobar, 2011). In addition, rural jobs are highly concentrated in agrarian activities (about 61%) with a tendency to fall in the past 10 years but with a growth trend between 2007 and 2012, when about 820,000 new jobs were created. Most workers are self-employed (51%); followed by employees (17%) and the rest are day workers (Merchán, 2014). This leads us to assess the relative importance of land reform on rural development and land distribution.
3.2.Historical Trends of Colombian Land Reform
13
Land reform policy is not intended to produce a radical transformation of land ownership as in the Mexican or Bolivian cases, where property was transferred from large landlords to peasants. The singularity of Colombian land reform is the transfer of State ownership to peasants after a long-run process of previous squatter occupation of vacant lands (baldíos10), which is equivalent to a land reform in the sense that it delivers private land to landless peasants, it recognizes previous settlers on agrarian frontiers, and through the allocation of private properties, it attempts to foster economic development and reduce poverty and inequality.
In Colombia land reform legislation began in the 19th century as a mechanism to foster a land market and as a strategy to use public land to raise funds to pay off obligations with creditors. From legislation purely focused on the allocation of the vast area of public land it became a mechanism to promote agrarian development and efficient use of the land at the end of the century. Later, during the 20th century, land legislation focused increasingly on growing rural conflicts involving land ownership and uses. The seminal law in 1936 –Law 200- shows a liberal ideology aiming to “de-individualize” the concept of rights that national constitutions defended in order to guarantee squatters’ rights.11 It intended to change land use by promoting efficiency and defining for the first time the social function of property.
Even though the legislation was aimed at redistributing land, creating new conditions for access to land and promoting private ownership over land, it was not until the 1960s when large amounts of public lands were allocated. At that time, Law 135 of 1961 generated a growing process of public land allocation from about 90,000 hectares per year on average allocated before 1961 to around 600,000 hectares per year during the 1960s. Land reform pursued three main aims: the pacification of rural areas, to pursue economic and food supply development, and to alleviate foreign pressure from US-initiatives such as the Alliance for Progress.12
From 1973 to 1994, INCORA continued its task of allocating land, but at a slower rate.13 After 1988 land allocations increased again, because at the time the government was committed to addressing the rural conflict, partly by providing incentives to allocate land in conflict-related zones. In 1994, as part of the institutional changes associated with the 1991
10 According to Colombian legislation, a
baldío is real estate property owned by the Nation and located in rural areas. As a
general rule it should be awarded to those who occupy it and meet the requirements set by law.
11 Law 200 of 1936 gave ownership to those who were using it and who in good faith thought there were no previous
owners (Alvear, 2013).
12 Furthermore, the 1961 law was enacted in the context of the Alliance for Progress and the National Front in Colombia,
when there was a strong consensus on the need to stop any insurgent movement mainly through economic development strategies.
13 The momentum of the 1961 land reform was sharply interrupted in 1973 as a result of a political pact named “Pacto de
Chicoral”, through which large landowners and the conservative government of President Misael Pastrana agreed to
14
Constitution and in the context of a market economy, the government enacted Law 160 designing a loan-based market-oriented approach to land reform aimed at lowering the cost for poor landless peasants to obtain farmland.
After 1994, access to land did not depend on living and cultivating it, but on standard of living eligibility conditions such as being rural workers in conditions of poverty and claiming that their income is derived mainly from rural activities. Once these conditions are fulfilled, a peasant is entitled to receiving a loan equal to 30% of the price of the land, and INCODER subsidizes the remaining 70%. Therefore, land reform is a subsidized transaction that allows peasants to access land even if they have not formerly lived on it. Nevertheless, as previous land reform laws, Law 160 of 1994 does not provide a property title as such, but only an Administrative Resolution of allocation to a private party.
Graph 1 offers a complete picture of land reform trends –total area and number of plots allocated, from 1901 to 2012.
Graph 1. Number of Plots and Area (hectares) Allocated - 1901-2012
Source: author’s calculation– Information System of Rural Development - SIDER-INCODER
During the early 20th century the amount of land allocated and the number of awards remained at a low level. An upward trend is observed in the late 1930s, following the enactment of Law 200 of 1936, which established a land reform. Contrary to widespread belief, this land reform was very modest, and a substantial increase in the allocation of public lands did not occur until after the enactment of Law 100 of 1944, which reversed some of the reforms of Law 200.
The major upturn in land allocation took place in the 1960s as a result of the 1961 land reform act. The magnitude of this reform is notorious, not only in terms of the area allocated, but also in the number of plots, and therefore of beneficiary families. Here again,
0 100.000 200.000 300.000 400.000 500.000 600.000 700.000 800.000 900.000 1.000.000 0 2.000 4.000 6.000 8.000 10.000 12.000 14.000 16.000 18.000 20.000 190 1 190 7 191 2 191 7 192 2 192 7 193 2 193 7 194 2 194 7 195 2 195 7 196 2 196 7 197 2 197 7 198 2 198 7 199 2 199 7 200 2 200 7 201 2 H e ctar e s N u m b e r o f Pl o ts
15
there is a downward trend after 1973. Later, in the 1990s the change in the land reform mechanisms once again produced a downturn in land allocation, suggesting that the market-led land reform actually reduced land access for peasants (Mondragón, 2001)
In this paper, we document that the differential changes in poverty as a result of land reform policy are greatly accounted for by the land reform after 1961. Throughout the document, the term land reform refers to the allocation of public land to peasants as defined in Law 135 of 1961, which aims to deliver property rights to landless peasants in order to foster economic development, reduce local poverty, improve land distribution and prevent social unrest over land. The term Potential Land Reform refers to the amount of land potentially available to be granted to landless peasants based on the area of the municipality as presented in the following section.
4. Land Reform and Latifundia in Colombia: effects at municipal level
The central hypothesis of this paper, that previous latifundia adversely affected the results of land reform on development, is examined empirically by means of changes in unmet basic needs (UBN), land Gini coefficient and size of rural properties across municipalities and over time in Colombia during the land reform period of 1961 to 2010.
4.1.Data
The historical data we use in this paper is gathered from several sources. Land reform data is from INCODER, which gathers information on the number and area of plots allocated in all municipalities from 1961 to 2012. This data specifies the number of hectares awarded in a single plot by year and municipality. To calculate the area allocated per capita we use lagged population, given that population is endogenous to land reform. We extrapolate population from National Census data in order to have the initial population in 1961 (which did not match the census). Therefore, the information takes into account the t-1 population data of each cumulative period.
The information of Unmet Basic Needs (UBN) came from the National Statistics Department of Colombia (DANE) and includes information from 1973 to date. The UBN takes values between 0 and 1, where 1 is a situation of complete UBN and 0 is the situation where all basic needs are fulfilled.
16
including all municipalities and 0.86 when only measuring municipalities with land distribution information. In addition, we calculate the Gini coefficient of rural land values within each municipality using land value data from IGAC for years 1985, 1993, 2005 and 2010.
The average size of rural plots and the coefficient of variation of the average size of plots are constructed with cadastral information from IGAC. The average size is the area of rural plots divided by the total number of rural plots in municipality i in year t. The coefficient of variation is calculated using the same information and takes into account the average size and its standard deviation.
To measure rural property size we calculate the per capita proportion of plots in five ranges of plot sizes: less than 3 hectares, from 3 to 5 hectares, from 5 to 10 hectares, from 10 to 50 and from 50 to 500 hectares and greater than 500 hectares. These ranges of plot sizes are used by the IGAC to categorize properties. We use lagged population to calculate per capita proportion of property according to size.
17
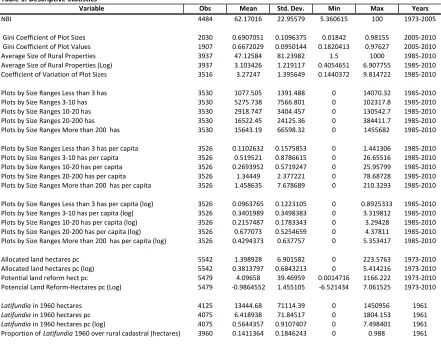
Table 1 presents descriptive statistics of all the variables used in our empirical approach. As can be seen, land reform has taken place in almost all municipalities in Colombia, allocating on average one hectare per capita over a potential of land reform of 4.09 hectares per capita. The average size of rural properties is about 47 hectares and the coefficient of variation is positive meaning that in average, plots are more unequal in size. A vast proportion of rural area corresponds to medium size properties and latifundia, about 40% is medium size properties and 37% latifundia. Small properties account for 33%, where properties less than 3 hectares are about 2.6%; properties in the range of 3 to 10 hectares are about 12.7% and properties in the range of 10 to 20 hectares around 7%. In addition, UBN is about 62.17 and land Gini coefficient 0.69, where some municipalities display a tremendous land concentration of 0.98 and others very low land concentration of about 0.0189. On average, municipalities had about 13.500 hectares of latifundia in 1960 representing 14% of rural properties area but with municipalities where about 98% of rural properties were latifundia.
4.2.Empirical Strategy Table 1. Descriptive Statistics
Variable Obs Mean Std. Dev. Min Max Years NBI 4484 62.17016 22.95579 5.360615 100 1973-2005
Gini Coefficient of Plot Sizes 2030 0.6907051 0.1096375 0.01842 0.98155 2005-2010 Gini Coefficient of Plot Values 1907 0.6672029 0.0950144 0.1820413 0.97627 2005-2010 Average Size of Rural Properties 3937 47.12584 81.23982 1.5 1000 1985-2010 Average Size of Rural Properties (Log) 3937 3.103426 1.219117 0.4054651 6.907755 1985-2010 Coefficient of Variation of Plot Sizes 3516 3.27247 1.395649 0.1440372 9.814722 1985-2010 Plots by Size Ranges Less than 3 has 3530 1077.505 1391.488 0 14070.32 1985-2010 Plots by Size Ranges 3-10 has 3530 5275.738 7566.801 0 102317.8 1985-2010 Plots by Size Ranges 10-20 has 3530 2918.747 3404.457 0 130542.7 1985-2010 Plots by Size Ranges 20-200 has 3530 16522.45 24125.36 0 384411.7 1985-2010 Plots by Size Ranges More than 200 has 3530 15643.19 66598.32 0 1455682 1985-2010 Plots by Size Ranges Less than 3 has per capita 3526 0.1102632 0.1575853 0 1.441306 1985-2010 Plots by Size Ranges 3-10 has per capita 3526 0.519521 0.8786615 0 26.65516 1985-2010 Plots by Size Ranges 10-20 has per capita 3526 0.2693952 0.5719247 0 25.95799 1985-2010 Plots by Size Ranges 20-200 has per capita 3526 1.34449 2.377221 0 78.68728 1985-2010 Plots by Size Ranges More than 200 has per capita 3526 1.458635 7.678689 0 210.3293 1985-2010 Plots by Size Ranges Less than 3 has per capita (log) 3526 0.0963765 0.1223105 0 0.8925333 1985-2010 Plots by Size Ranges 3-10 has per capita (log) 3526 0.3401989 0.3498383 0 3.319812 1985-2010 Plots by Size Ranges 10-20 has per capita (log) 3526 0.2157487 0.1783343 0 3.29428 1985-2010 Plots by Size Ranges 20-200 has per capita (log) 3526 0.677073 0.5254659 0 4.37811 1985-2010 Plots by Size Ranges More than 200 has per capita (log) 3526 0.4294373 0.637757 0 5.353417 1985-2010 Allocated land hectares pc 5542 1.398928 6.901582 0 223.5763 1973-2010 Allocated land hectares pc (log) 5542 0.3813797 0.6843213 0 5.414216 1973-2010 Potential land reform hect pc 5479 4.09658 39.46959 0.0014716 1166.222 1973-2010 Potencial Land Reform-Hectares pc (Log) 5479 -0.9864552 1.455105 -6.521434 7.061525 1973-2010
Latifundiain 1960 hectares 4125 13444.68 71114.39 0 1450956 1961
Latifundiain 1960 hectares pc 4075 6.418938 71.84517 0 1804.153 1961
Latifundiain 1960 hectares pc (log) 4075 0.5644357 0.9107407 0 7.498401 1961
[image:19.612.86.527.77.424.2]18
The model. In order to determine the impact of land reform in a particular municipality we estimate the following equation:
(1)
Where is the dependent variable in municipality i in year t (here t indicates the years 1973, 1985, 1993, 2005, and 2010 respectively); dependent variables are development variables (UBN, land Gini of property (plots) sizes, land Gini of property values, average size of rural properties and coefficient of variation of property size). The variable Land Reform per capita is the independent variable in year t, are municipality fixed effects and are year fixed effect. Land reform per capita is accumulated number of hectares granted in each municipality from 1961 to year t. For instance is the per capita hectares granted between 1960 and 1973 in municipality i. Likewise is the per capita hectares granted between 1960 and 1985 in municipality i
GL1960i is per capita latifundia (plots greater > 500 hectares) in 1960 -previous to
the land reform of 1961- capturing the per capita size of large landholdings in municipality
i. This variable would indicate the prevalence of latifundia and the relative power of the
landed elite prior to land reform.
In equation (1) we expect the coefficient associated to the effect of land reform
on poverty or on the land distribution to be negative while to be positive the
coefficient related to the prevalence of latifundia in 1960 as.–according to the reviewed literature – presence of large landholding and hence of landed elites may curtail the effects of land reform. Equation (1) only include as control variables municipal and time fixed effects given that any possible economic or social control variable would be endogenous to our variables of interest. For instance, social variables such as education enrolment, health access and local tax revenues may have been the result of land reform. By the same token, political and conflict variables are also associated with the performance and intensity of land reform, as described in the previous section.
19
In order to correct the likely bias of the OLS coefficients in equation (1) we construct an exogenous measure of land reform called “Potential of Land Reform”. As explained below this variable might be interpret as the potential intensity of land reform as it entails the accumulated hectares could have been “potentially” granted in a particular municipality i until year t given the country’s trends of land grants and the land availability at municipal level. The potential land reform is highly correlated with the actual hectares of land granted yet does not exhibit the endogeneity and omitted variable predicaments of the latter.
Identification Strategy: Potential of Land Reform. In order to avoid the likely bias of the OLS coefficients in equation (1) we construct an exogenous variable that captures the potential per capita of land reform in each municipality. This variable distributes the total hectares of land allocated each year in the country as a whole proportionately to the area of each municipality, correcting by the area granted in previous years in municipality i. Thus, the per capita potential allocation will be computed for each year between 1961 and 2010 as follows:
∑
(2)
Where corrected areai captures the total area of the municipality corrected by
previous land allocation. The correction of the municipality’s area involves two steps: i) the proportion of area discounted to each municipality in which actual land reform took place equals the average proportion of the area allocated in the whole country; ii) the area is corrected only in municipalities with actual allocation took place between t-1 and t. Thus, the area discounted in each municipality used to determine land availability for land reform takes only into accounted the national trends and not the local ones. Thus, the corrected area of the municipality is expressed as follows:
( )
Where i indicates the municipality and t indicates the years 1973, 1985, 1993, 2005 and 2010. The variable indicates the total area of municipality i while measures the area that is potentially available for land reform. The
20
( ∑
)
Where denotes the potential of land reform in municipality i in year t in per capita terms. Graph 2 present the correlation between the actual and the potential accumulated hectares of land reform for 1973 and 2010 which shows that latter is a good predictor of the former. In this regard, the notional allocation of hectares through land reform –both from 1961 to 1973 and from 1961 to 2010 -based land availability is clearly a good proxy of the actual hectares granted.
Graph 2. Potential and Actual Land Allocations through Land Reform
Thus, equation (1) will be substituted by the following equation (2)
(2)
21
between potential land reform and the per capita latifundia in 1960. It is expected a negative sign for γ1 and a positive one for γ2.
These two coefficients can be interpreted as reduce form estimation for the instrumental variable strategy that would regress Hectares allocated through Land Reform against Potential for Land Reform with an interaction term. Nevertheless we will not use an IV approach because land availability could also affect poverty or land distribution directly which would invalidate the exclusion restriction of the instrument. Moreover, using our reduced form approach we can control for the direct effect of land availability on local development indicators by introducing as regressor in equation (2) a polynomial of the area of the municipality interacted with the time fixed effects δ as follows:
where the expression in equation (3) represents a polynomial of the municipal area and will pick up the direct effects of land availability on the indicators of poverty and land distribution. The following section explains the result of the estimations.
5. Results: The Effects of Land Reform Amidst Latifundia
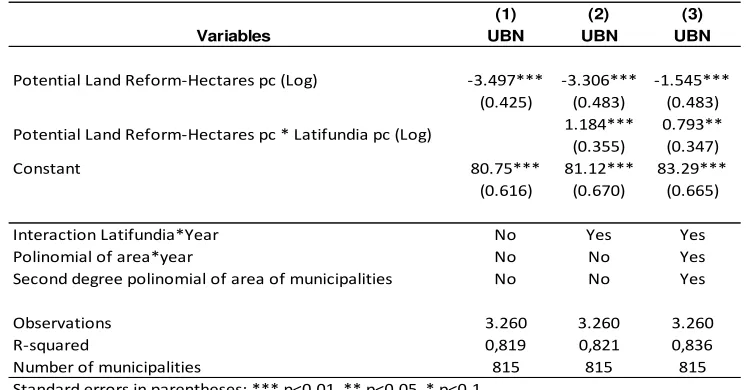
Poverty. Table 4 presents the results of the impact of Potential for Land Reform in per capita terms on poverty indicators according to three model specifications.
Column (1) displays the results of the latter variables using a model with fixed effects by municipality and year. According to Table 4 negatively impact the Unmet Basic Needs index suggesting that the larger the number of hectares allocated through land reform (in relation to the population in t-1) the greater the reduction of poverty in the municipality i. Column (2) introduces the interaction of with latifundia per capita
22
Column (3) reports the estimation of equation (3) which adds a second degree polynomial of municipality area interacted with the time dummies. This polynomial would pick up the direct effect of land availability on poverty indicators. Although the magnitude of the coefficients is smaller they remain significant. According to the model of column (2) an increase in one standard deviation of in logs (=1.15) lowers the UNB index by
0.15 standard deviations (-3.03*1.15/24). In contrast, a rise of one standard deviation of (=0.78) augments the UBN index by 0.038 standard deviations.
Hence, latifundia presence in fact curtails the effects of land reform on poverty.
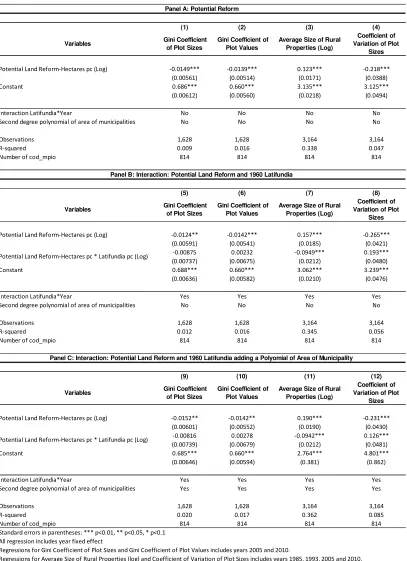
Land Distribution. Table 4 displays the effect of land reform (potential) on different measures of land distribution under the same 3 specification. Colum (1), (5) and (9) indicate that land reform through allocations of hectares has a negative impact on the Gini coefficient of land areas. This result suggests that the municipalities where more land grants (potential) have been distributed among peasants would exhibit more equal land distribution. It should notice that the coefficient of has the same magnitude
regardless the model specification. Column (5) introduces the interaction term
being the coefficient of the latter non-significantly different from zero. Thus, the prevalence of latifundia in 1960 does not seem to hinder the improvement of land distribution brought about by land reform. The result maintains in column (9) which introduces in the model the second degree polynomial of municipality area interacted with the time dummies. According to column (5) an increase of one standard deviation of
decreases in 0.12 (=1.06*-0.0124/.11) standard deviations the Gini coefficient of
land areas. Thus, land reform has helped to lower Colombian high concentration of land although its magnitude seems somehow modest. Columns (2), (6) and (10) displays the
(1) (2) (3)
Variables UBN UBN UBN
Potential Land Reform-Hectares pc (Log) -3.497*** -3.306*** -1.545***
(0.425) (0.483) (0.483)
1.184*** 0.793** (0.355) (0.347)
Constant 80.75*** 81.12*** 83.29***
(0.616) (0.670) (0.665)
Interaction Latifundia*Year No Yes Yes
Polinomial of area*year No No Yes
Second degree polinomial of area of municipalities No No Yes
Observations 3.260 3.260 3.260
R-squared 0,819 0,821 0,836
[image:24.612.116.489.81.276.2]Number of municipalities 815 815 815
Table 3: Panel Data, municipal fixed effects - Variable: UBN
Potential Land Reform-Hectares pc * Latifundia pc (Log)
Standard errors in parentheses: *** p<0.01, ** p<0.05, * p<0.1
23
same econometric exercises yet using as dependent variable the Gini coefficient of the land plot values. The results obtained are similar to the previous ones.
(1) (2) (3) (4)
Variables Gini Coefficient of Plot Sizes
Gini Coefficient of Plot Values
Average Size of Rural Properties (Log)
Coefficient of Variation of Plot
Sizes
Potential Land Reform-Hectares pc (Log) -0.0149*** -0.0139*** 0.123*** -0.218***
(0.00561) (0.00514) (0.0171) (0.0388)
Constant 0.686*** 0.660*** 3.135*** 3.125***
(0.00612) (0.00560) (0.0218) (0.0494)
Interaction Latifundia*Year No No No No
Second degree polynomial of area of municipalities No No No No
Observations 1,628 1,628 3,164 3,164
R-squared 0.009 0.016 0.338 0.047
Number of cod_mpio 814 814 814 814
(5) (6) (7) (8)
Variables Gini Coefficient of Plot Sizes
Gini Coefficient of Plot Values
Average Size of Rural Properties (Log)
Coefficient of Variation of Plot
Sizes
Potential Land Reform-Hectares pc (Log) -0.0124** -0.0142*** 0.157*** -0.265***
(0.00591) (0.00541) (0.0185) (0.0421)
-0.00875 0.00232 -0.0949*** 0.193***
(0.00737) (0.00675) (0.0212) (0.0480)
Constant 0.688*** 0.660*** 3.062*** 3.239***
(0.00636) (0.00582) (0.0210) (0.0476)
Interaction Latifundia*Year Yes Yes Yes Yes
Second degree polynomial of area of municipalities No No No No
Observations 1,628 1,628 3,164 3,164
R-squared 0.012 0.016 0.345 0.056
Number of cod_mpio 814 814 814 814
(9) (10) (11) (12)
Variables Gini Coefficient of Plot Sizes
Gini Coefficient of Plot Values
Average Size of Rural Properties (Log)
Coefficient of Variation of Plot
Sizes
Potential Land Reform-Hectares pc (Log) -0.0152** -0.0142** 0.190*** -0.231***
(0.00601) (0.00552) (0.0190) (0.0430)
-0.00816 0.00278 -0.0942*** 0.126***
(0.00739) (0.00679) (0.0212) (0.0481)
Constant 0.685*** 0.660*** 2.764*** 4.801***
(0.00646) (0.00594) (0.381) (0.862)
Interaction Latifundia*Year Yes Yes Yes Yes
Second degree polynomial of area of municipalities Yes Yes Yes Yes
Observations 1,628 1,628 3,164 3,164
R-squared 0.020 0.017 0.362 0.085
Number of cod_mpio 814 814 814 814
All regression includes year fixed effect
Regressions for Average Size of Rural Properties (log) and Coefficient of Variation of Plot Sizes includes years 1985, 1993, 2005 and 2010. Regressions for Gini Coefficient of Plot Sizes and Gini Coefficient of Plot Values includes years 2005 and 2010.
Panel C: Interaction: Potential Land Reform and 1960 Latifundia adding a Polyomial of Area of Municipality
Potential Land Reform-Hectares pc * Latifundia pc (Log)
[image:25.612.123.530.135.696.2]Standard errors in parentheses: *** p<0.01, ** p<0.05, * p<0.1
Table 4: Panel Data with municipal fixed effects. Dependent Variable: Gini Coefficient of Plot Sizes, Gini Coefficient of Plot Values, Average Size of Plots and Coefficient of Variation of Plot Sizes.
Panel A: Potential Reform
Panel B: Interaction: Potential Land Reform and 1960 Latifundia
24
Columns (3), (7) and (11) in Table 4 present the econometric results for the average size of land properties in the municipality. The coefficient for indicates that allocation land plots to peasants through land reform seem to augment the average size of plots. In fact, an increase of 1% of potential land reform (in per capita hectares) augments by 0.15% the average size of properties (in logs). This result suggests that the plots allocated through land reform (mostly baldios) seem to be of larger area than the existing plots. Nonetheless, the positive effects of land reform on average area of the plots appear to be lower in places with greater prevalence of latifundia in 1960. Thus, it seems that in places with higher prevalence of 1960 latifundia the land reforms plots may have been of smaller size.
The results remained basically unaltered when we add to the regression –column (11) - the second degree polynomial of area of the municipality interacted with the time dummies. In magnitude, an increase of one standard deviation of (potential) hectares granted through land reform increase by 0.17 standard deviations the average size (in logs) of municipal properties (0.15*1.45/1.22). Such effects get reduced by 0.06 standard deviations if the interaction of land reform and 1960 latifundia augments by one standard deviation (0.79).
Columns (4), (8) and (12) of Table 4 present the regression of the coefficient of variation of plot sizes at municipal level on land reform. The three specifications point out that the dispersion of plot sizes at municipal level tends to be smaller if the (potential) land reform has been larger. Thus, although the sizes of existing plots are larger in the presence of land reform -as shown in columns (3), (7) and (11) - their dispersion seems to be lower.
Hence, land reform improves distribution by increasing the sizes of properties near the upper end of distribution rather than by decreasing the sizes of the largest ones. Based on column (8), an increase of one standard deviation of (potential) hectares granted through land reform lowers the coefficient of variation of plot sizes by 0.23 standard deviations – by no means a negligible effect. Nonetheless, the reduction of size dispersion is of smaller magnitude in municipalities with greater prevalence of 1960 latifundia as revealed by the result of columns (8) and (12). In fact, the effects of land reforms on plot dispersion get reduced by 0.12 standard deviations if the interaction of land reform and 1960 latifundia augments by one standard deviation. Hence, it seems that Latifundia presence hinders the improvement of land distribution as such presence is associated with the allocation of land reform plots of smaller sizes.
25
capita hectares in each range of plot sizes. The reported coefficients can be interpreted as the elasticity of each range of plot size (in per capita hectares) with respect to the hectares granted through land reform and with respect to the latter variable interacted with 1960 per capita latifundia.
(1) (2) (3) (4) (5)
Variables Less than 3 has per capita (log)
3-10 has per capita (log)
10-20 has per capita (log)
20-200 has per capita (log)
More than 200 has per capita (latifundia) (log)
Potential Land Reform-Hectares pc (Log) 0.123*** 0.0841*** 0.137*** 0.335*** 0.186***
(0.00541) (0.0180) (0.00464) (0.0123) (0.0134)
Constant 0.212*** 0.619*** 0.395*** 1.088*** 0.653***
(0.00693) (0.0230) (0.00591) (0.0157) (0.0171)
Interaction Latifundia*Year No No No No No
Second degree polynomial of area*year No No No No No
Observations 3,173 3,180 3,177 3,177 3,177
R-squared 0.396 0.283 0.287 0.303 0.196
Number of cod_mpio 814 814 814 814 814
(6) (7) (8) (9) (10)
Variables Less than 3 has per capita (log)
3-10 has per capita (log)
10-20 has per capita (log)
20-200 has per capita (log)
More than 200 has per capita (latifundia) (log)
Potential Land Reform-Hectares pc (Log) 0.122*** 0.0889*** 0.124*** 0.299*** 0.171***
(0.00574) (0.0191) (0.00492) (0.0132) (0.0141)
-0.0215*** 0.0788*** 0.0562*** 0.120*** -0.0294*
(0.00659) (0.0218) (0.00561) (0.0151) (0.0162)
Constant 0.285*** 0.288*** 0.334*** 0.935*** 0.571***
(0.00656) (0.0217) (0.00559) (0.0150) (0.0161)
Interaction Latifundia*Year Yes Yes Yes Yes Yes
Second degree polynomial of area*year No No No No No
Observations 3,173 3,180 3,177 3,177 3,177
R-squared 0.425 0.325 0.324 0.325 0.242
Number of cod_mpio 814 814 814 814 814
(11) (12) (13) (14) (15)
Variables Less than 3 has per capita (log)
3-10 has per capita (log)
10-20 has per capita (log)
20-200 has per capita (log)
More than 200 has per capita (latifundia) (log)
Potential Land Reform-Hectares pc (Log) 0.110*** 0.144*** 0.136*** 0.320*** 0.166***
(0.00561) (0.0187) (0.00502) (0.0135) (0.0143)
-0.00809 0.0407* 0.0567*** 0.125*** -0.00805
(0.00631) (0.0209) (0.00560) (0.0151) (0.0161)
Constant 0.984*** -1.216*** 0.441*** 1.896*** 3.050***
(0.119) (0.386) (0.100) (0.279) (0.297)
Interaction Latifundia*Year Yes Yes Yes Yes Yes
Second degree polynomial of area*year Yes Yes Yes Yes Yes
Observations 3,173 3,180 3,177 3,177 3,177
R-squared 0.489 0.398 0.350 0.347 0.276
Number of cod_mpio 814 814 814 814 814
[image:27.612.116.586.169.660.2]Standard errors in parentheses: *** p<0.01, ** p<0.05, * p<0.1 All regression includes year fixed effect for years 1985, 1993, 2005 y 2010
Table 5: Panel Data with municipal fixed effects. Dependent Variable: Plots by Size Ranges (Has. per capita)
Panel A: Potential Reform
Panel B: Interaction: Land Reform and Latifundia Panel B: Interaction: Land Reform and Latifundia
Potential Land Reform-Hectares pc * Latifundia pc (Log)
Panel C: Interaction between potential land reform and latifundia, and polynomial
26
Columns (1), (6) and (11) indicate that the elasticity of the (per capita) amount of land in plots of less than three hectares is around 0.1. Columns (6) and (11) it is also observe that the prevalence of 1960 latifundia has a negative effect on this range of plot size however non statistically significant when the second degree polynomial of the municipality area are used as control variables. In columns (2), (7) and (12) we present the same econometric exercise for the per capita municipal areas in plots between 3 and 10 hectares. The elasticity of land reform –measured as potential of per capita hectares granted- obtained for this type of properties is around 0.14%. The effect of the interaction between potential land reform and 1960 latifundia on the per capita hectares in the said range of properties is positive but only marginally significant. A similar elasticity of land reform is found for the per capita terrains in plots between 10 and 20 hectares yet in this case the interaction between potential land reform and 1960 latifundia is positive and highly significant (see column (3), (8) and (13)).
The highest elasticity of land reform is obtained for the per capita terrains between 20 and 200 hectares which reaches 0.32 (see columns (4), (9) and (14)). By the same token, the coefficient of the interaction of land reform and 1960 latifundia for this type of size range is also the greatest reaching 0.12. Finally, the elasticity of per capita latifundia –plots of more than 200 hectares- to potential land reform is around 0.17. Nonetheless in the estimation that includes as controls the polynomial of the area of municipality the interaction between potential land reform and 1960 latifundia exhibits a coefficient non-statistically significant (see columns (5), (10) and (15)).
Summing up the results, the estimations of the effect on per capita (potential) land reform on the (per capita area) of different ranges of plot sizes indicate that it increases the areas of all types of plot sizes particularly those between 20 and 200 hectares. In addition, plots both between 10 and 20 hectares and 20 and 200 present an additional expansion as a consequence of land reform in municipalities with prevalence of 1960 latifundia. Thus, the reduction of the unequal land distribution as a consequence of land reform –presented in Table 4- occurs not for the contraction of the latifundia plots but as a result of a somehow larger expansion of the plots between 10 and 200 hectares.
6. Conclusions
27
Potential land reform can be interpreted as the intensity of the intent-to-treat that is highly correlated with the actual land reform but does not exhibit the likely biases stemming from the endogeneity and omitted variable issues of the actual land reform.
In this paper we explored the hypothesis that the effects of land reform on poverty and land distribution are affected by the persistence of previous structure of land ownership, in particular the prevalence of latifundia. We suggest that attempts to widen land access through land reform policy may be hindered as a result of the institutional arrangements that characterized the presence of latifundia. We empirically found that land reform from 1961 onwards has slightly reduced poverty and mildly improved land distribution. Nonetheless, municipalities with strong presence of latifundia prior to 1961 have experienced both a slower drop in poverty and a weaker improvement of land distribution.
We found that previous presence of large landownership –latinfundia- curtails the effect of land reform on poverty reduction and land inequality. As of land inequality we found the average sizes of existing plots are larger in the presence of land reform their dispersion seems to be lower. Hence, land reform improves distribution by increasing the sizes of properties near the upper end of distribution rather than by decreasing the sizes of the largest ones. Nonetheless, the reduction of size dispersion is of smaller magnitude in municipalities with greater prevalence of 1960 latifundia. Hence, it seems that Latifundia presence hamper the improvement of land distribution as such presence is associated with the allocation of land reform plots of larger sizes.
Our findings match the literature on the negative impact of concentration of wealth on development outcomes. Therefore, if there should be a successful land reform policy there should be also deep changes in the structure of land tenancy before the implementation of the former.