Health impact assessment of decreases
in PM
10
and ozone concentrations in the Mexico
City Metropolitan Area. A basis for a new air
quality management program
Horacio Riojas-Rodríguez, MSc, PhD,(1) Urinda Álamo-Hernández, MSc,(1)
José Luis Texcalac-Sangrador, MSc,(1) Isabelle Romieu, MD, MPH, ScD.(1)
(1) Instituto Nacional de Salud Pública. Cuernavaca, Morelos, México
Received on: March 19, 2014 • Accepted on: September 1, 2014
Corresponding author: Dr. Isabelle Romieu. Instituto Nacional de Salud Pública. Av. Universidad 655, col. Santa María Ahuacatitlán. 62100 Cuernavaca, Morelos, México.
E-mail: [email protected] Riojas-Rodríguez H, Álamo-Hernández U,
Texcalac-Sangrador JL, Romieu I. Health impact assessment of decreases in PM10 and ozone
concentrations in the Mexico City Metropolitan Area. A basis for a new air quality management program. Salud Publica Mex 2014;56:579-591.
Abstract
Objective. To conduct a health impact assessment (HIA) to
quantify health benefits for several PM and O3 air pollution reduction scenarios in the Mexico City Metropolitan Area (MCMA). Results from this HIA will contribute to the scientific support of the MCMA air quality management plan (PROAIRE) for the period 2011-2020. Materials and methods. The HIA methodology consisted of four steps: 1) selection of the air pollution reduction scenarios, 2) identification of the at-risk population and health outcomes for the 2005 baseline scenario, 3) selection of concentration-response functions and 4) estimation of health impacts. Results. Reductions of PM10 levels to 20 μg/m3 and O
3 levels to 0.050ppm (98 μg/
m3) would prevent 2 300 and 400 annual deaths respectively.
The greatest health impact was seen in the over-65 age group and in mortality due to cardiopulmonary and cardiovascular disease. Conclusion. Improved air quality in the MCMA could provide significant health benefits through focusing interven-tions by exposure zones.
Key words: air pollution; health impact assessment; Mexico City
Riojas-Rodríguez H, Álamo-Hernández U, Texcalac-Sangrador JL, Romieu I.
Evaluación de impacto en salud ante reducciones de PM10 y ozono en la Zona Metropolitana del Valle de México. Base para un nuevo programa de calidad del aire Salud Publica Mex 2014;56:579-591.
Resumen
Objetivo. Realizar una evaluación de impacto en salud
(EIS) que documente los beneficios en salud ante diversos escenarios de reducción de PM10 y O3 en el aire de la Zona Metropolitana del Valle de México (ZMVM). Los resultados contribuyen al sustento científico del plan de gestión de cali-dad del aire (PROAIRE 2011-2020). Material y métodos. La metodología de EIS comprende cuatro pasos: 1) selección de los escenarios de reducción, 2) identificación de la población en riesgo y de los eventos en salud para el año basal 2005, 3) selección de las funciones de concentración-respuesta y 4) estimación del impacto en la salud. Resultados. Reducciones de PM10 a 20μg/m3 y de O
3 a 0.050ppm (98 μg/m3) evitarían,
respectivamente, cerca de 2 300 y 400 muertes por año. El mayor impacto se observa en el grupo de más de 65 años y en la mortalidad por causas cardiopulmonares y cardio-vasculares. Conclusiones. Mejorar la calidad del aire en la ZMVM podría reflejar importantes beneficios para la salud focalizados por zonas o áreas de exposición.
A
large amount of scientific literature documents the different health effects due to exposure to atmo-spheric pollutants.1-3 The results of research conducted worldwide serves to support local governments and international organizations in implementing public policies protective of human health.4
Ozone (O3) and particulate matter (PM10 and PM2.5)
have received special attention because of the health effects they pose to exposed populations5,6 and because they are the two criteria pollutants whose concentrations have remained elevated over time in the Mexico City Metropolitan Area (MCMA). Acute and chronic expo
-sures to these pollutants are associated with increased mortality caused by cardiovascular and respiratory disease and increased morbidity from cardiovascular and respiratory disease,1,6-8 certain types of cancer,9,10 and reproductive, developmental and neurological effects.2,11 Exposure to air pollutants during pregnancy and early stages of life is associated with premature birth, delayed intrauterine growth, low birth weight, early death syndrome and infant mortality.12,13 The groups most susceptible to the health effects of air pollution are children, adults over 65 years of age, persons with chronic diseases such as asthma, chronic obstructive pulmonary disease, and cardiac ischemia, and pregnant women because of prenatal exposure of the fetus.3,14
A variety of studies have documented the relation
-ship between decreased exposure to air pollution and decreases in population mortality and morbidity as well as increases in life expectancy.15,16 Findings from epide -miological studies have supported the implementation of health protective policies among populations exposed to air pollution.4,17
Over the past 20 years, the health impact assess
-ment (HIA) has served as a methodological tool used by decision-makers in diverse countries, to quantify the impact of interventions on air pollution and hu
-man health.18-20 It has been used in several studies throughout the world, particularly in Europe and the United States,19-23 and its use has enabled the estimation of economic and health impacts of diverse air quality management measures.8,24-27
Mexico has a history of evaluating health impacts from exposure to air pollutants, a practice that has been essential for planning interventions in Mexico City and the Metropolitan Area (MCMA).28-32 Interventions are planned through an air quality management plan, the PROAIRE (Programa para mejorar la calidad del aire de la Zona Metropolitana del Valle de México), which is developed every 10 years. The plan puts forth air qual
-ity guidelines and public policies for the protection of public health in MCMA. For the 2011-2020 PROAIRE,
local authorities took a health-based approach, with a focus on the potential health benefits of reductions in PM10 and O3 concentrations.
This work documents the results of MCMA of HIA from three different reduction scenarios for PM10 and
O3 concentrations; and was conducted according to the research methods recommended by the World Health Or
-ganization (WHO) and the United States Environmental Protection Agency (US-EPA), using the best calculations available to date, according to the literature reviewed.
We selected this methodology because it has been developed and validated in similar scenarios. This methodology is the standard approach for linking epi
-demiolgical evidence with new air quality standards in Europe and the United States.49
Materials and methods
The four steps of an HIA include: 1) selection of the air pollution reduction scenarios, 2) identification of the at-risk population and health outcomes for the baseline scenario, 3) selection of concentration–response func
-tions (CRF) and 4) estimation of health impacts.18,19,21
Study area
The study area was defined by crossing two spatial layers of information (figure 1) using a Geographic Information System (GIS). The first layer represented PM10 and O3 monitoring stations administered by the At
-mospheric Monitoring System (SIMAT, by its acronym in Spanish) of the Mexico City Ministry of Environment (SMA-GDF, by its acronym in Spanish). The second layer was the boundary of Mexico City. A grid of 500m2 reso-lution was overlaid on the two layers in GIS. As some monitoring stations were located beyond the boundaries of Mexico City and in the neighboring State of Mexico, the final study area included 33 municipalities in the State of Mexico in their entirety.
Population and cartographic information was obtained from the National Statistics and Geography Institute (INEGI, by its acronym in Spanish) using data from the 2005 population census. The spatial informa
-tion was processed and analyzed using ArcGIS Desktop software, release 9.3 and its Spatial Analyst module (Environmental Systems Research Institute, 2009).
Air pollution scenarios
The reference year used for pollutant concentrations was 2005. Annual average PM10 and O3 values were calculated for each SIMAT monitoring station. An
99°20’0’’W 99°10’0’’W 99°0’0’’W
99°20’0’’W 99°10’0’’W 99°0’0’’W
19°40’0’’N
19°30’0’’N
19°20’0’’N
19°10’0’’N
19°40’0’’N
19°30’0’’N
19°20’0’’N
19°10’0’’N
(Continued…)
99°20’0’’W 99°10’0’’W 99°0’0’’W
99°20’0’’W 99°10’0’’W 99°0’0’’W
19°40’0’’N
19°30’0’’N
19°20’0’’N
19°10’0’’N
19°40’0’’N
19°30’0’’N
19°20’0’’N
19°0’0’’N 19°0’0’’N
means. Annual average ozone was calculated using the highest 8-hour moving average for each day. The data were provided by the National Ecology Institute; this data had been previously generated and validated for the “ESCALA Study of Air Pollution and Health effects in Latin America”.33-34 ESCALA is a multicity project carried out in Brazil, Chile and Mexico. The study per
-formed time-series analysis to obtain estimates for total, cause-specific and age-specific mortality associated with changes in air pollution concentrations.34
Health effects were evaluated for three hypothetical PM10 and O3 pollution reduction scenarios. For annual average PM10, the following concentrations were used: 1) the WHO recommendation of 20µg/m3, 2) the European Union recommendation of 40µg/m3, and 3) the Mexican Federal standard of 50µg/m3. For annual average O
3, the following concentrations were used: 1) 0.05 ppm, 2) 0.06 ppm and 3) a 5% reduction from the 2005 annual average.
Estimating population exposure to pollutants in the study area
PM10 and O3 dispersion was calculated based on the grid delimiting the study area and using inverse dis
-tance weighting (IDW) as a geostatistical calculation method.35 Concentration gradients in the study area were classified using the ArcGIS manual classification method. The study area was classified into 5 zones for PM10 and 4 zones for O3 (figure 1).
Because the spatial distribution of air pollution does not align with the spatial distribution of the population, we used a population-weighted annual average concen
-tration to estimate population exposure. This weighting approach aims to quantify population exposure by link
-ing the concentration of a pollutant in a particular geo
-graphic area with the population residing in that same area.36,37 To estimate the population-weighted annual average concentration, the GIS layer with concentration zones was overlaid with a layer containing municipal-level population data. The population-weighted annual average concentration for the study area was computed with the following formula:
∑Ci x Ni Cp= ––––––––––––
N
where:
Cp= Population-weighted concentration for the study
area
Ci= Concentration in municipality i Ni= Number of persons in municipality i N= Total population in the study area
The value obtained for the indicator represents an estimate of the average exposure of the population in each municipality.
At-risk population and health outcomes for the baseline scenario
This HIA uses health outcomes which have been consis
-tently reported as having an association with PM10 and
O3 exposure and for which the Mexican Health System reports statistics. Table I presents the population groups included in the study, the health outcomes selected for HIA estimations, and the corresponding International Classification of Diseases (ICD) 9 and 10 codes.
The year 2005 was chosen for the baseline scenario since it was the year for which the most recent, highest quality population and health data were available. Data for population, total mortality and cause-specific mortal
-ity were provided by Inegi. Data for hospital admissions were obtained from the National Health Information System (SINAIS, by its Spanish acronym).
Selection of concentration-response functions (CRF)
The CRFs used in this study correspond to the relative risks (RR), or a pooled RR, found in epidemiological studies that associate air pollution with health effects. We used CRFs from studies conducted in the MCMA, including the ESCALA project, and recent international epidemiological studies and meta-analyses, which pro
-vide reliable estimates (table I).31,33,34,38-47
Estimation of health impacts
The benefits of the air pollution reduction scenarios are ex
-pressed in attributable, or preventable, cases per year for each health outcome evaluated (total mortality, mortality from respiratory disease, etc.). These are estimated using the attributable population fraction, which is a function of the CRFs and the fraction of exposed persons in the study population.21 In this context, attributable population frac -tion is defined as the reduc-tion in incidence that would be observed if the population exposure were decreased to the levels proposed in the reduction scenarios. This approach assumes that air pollution is only a part of the causal model for each health outcome.
The formula for the attributable population fraction (AFpop) of the total population is:
Pp x (RR – 1) AFpop= –––––––––––––––––––
where pp represents the fraction of the population ex
-posed to the environmental factor under consideration and RR is the concentration-response function for the change in exposure being evaluated. When the entire population has been exposed, as in the majority of air pollution studies, the pp is equal to 1 and the above formula is simplified to the attributable fraction of those who have been exposed (AFexp):
RR – 1 AFexp= –––––––––
RR
Multiplying the AFexp by the total number of cases observed in the baseline scenario and using the different
concentration scenarios, we can estimate the number of preventable cases as follows:
number of cases in MCMA preventable cases=number of cases in MCMA– –––––––––––––––
e([lnCRFcorrected]*∆conc)
where:
• ∆conc is the change in PM10 or O3 concentration in
each scenario,
• CRFcorrected is the CRF expressed as relative risk, per unit change in pollutant concentration, • Number of cases in MCMA is the number of cases
observed in 2005 for the outcome evaluated.
Table I
HealtHeventS, rateSorcaSeSoFtHiSeventSand crF Selected
Causes/IC-10 population Types of Rate or cases CRF PM10 CRF O3
% (95%CI) Source %(95% CI) Source
Total Mortality A00-R99
General 4.75 cases per 1000 0.7 (0.5-0.9)0.6 (0.4-0.8)
Romieu and cols. 2012‡
WHO 2006
0.3 (0.2-0.5) 0.5 (0.4-0.7)
Romieu and cols. 2012‡
Ito, De Leon 2005
Children 21.06 cases per 1000 1.3 (0.3-2.3)1.7 (0.5-2.8) 2012,Romieu and cols. ‡ Carbajal 2011 No information
>65 years 45.92 cases per 1000 0.5% (0.2-0.8)0.9 (0.7-1.1) 2012,Romieu and cols. ‡ O’Neill 2004 0.5 (0.3-0.7)0.9 (0.3-1.5)
Romieu and cols. 2012‡
O’Neill 2004
Mortality by cardio-pulmonary illness (I00-I99, J00-J98)
General 1.56 cases per 1000 0.7 (0.4- 1.0) Romieu and cols. 2012‡ No information
>65 years 20.72 cases per 1000 0.9 (0.5-1.2) Romieu and cols. 2012‡ 0.5 (0.3-0.8) Romieu and cols. 2012‡
Mortality by respiratory illness J00-J98
General 0.42 cases per 1000 0.9 (0.3-1.5)1.3 (0.5-2.1) 2012,Romieu and cols. ‡ WHO 2006 0.4 (0.02-0.9) Romieu and cols. 2012‡
Children 2.79 cases per 1000 2.5 (0.5-4.7) Carbajal 2011 No information
Mortality by cardio-vascular illness I00-I99
General 1.14 cases per 1000 0.4 (0.08-0.8)0.9 (0.5-1.3) 2012,Romieu and cols. ‡ WHO 2006 0.6 (0.4-0.9) Bell 2005
>65 years 15.39 cases per 1000 0.6 (0.2-1.0) Romieu and cols. 2012‡ 0.4 (0.1-0.7) Romieu and cols. 2012‡
Mortality by cerebro-vascular illness I60-I69
General 0.26 cases per 1000 0.9 (0.2-1.6) Romieu and cols. 2012‡ No information
>65 years 3.45 cases per 1000 1.1 (0.3-1.9) Romieu and cols. 2012‡ 0.6 (0.03-1.3) Romieu and cols. 2012‡
Mortality (long-term exposure) Total mortality
A00-R99
Hospital admissions* >= 30 years 9.27 cases per 1000 4.3(2.6-6.1) Pooled in Kunzli, 2000. No information
By respiratory illness J00-J98
General 37 469 cases 1.4(1.2-1.6) Pooled in Rosales and Castillo 2001 3.8 (0.5-7.1) Pooled in Rosales and Castillo 2001
>65 years 7 604 cases 1.5 (1.2-1.8) Pooled in Rosales and Castillo 2001 2.8 (1.7-3.9) Pooled in Rosales and Castillo 2001
General 41 719 cases 0.6 (0.42-0.79) Pooled in Borja,Aburto 2000 0.98 (0.5-1.4) Pooled in Borja,Aburto 2000
By cardio-vascular illness
I00-I99 >65 years 18 466 cases 1.22 (0.94-1.5) Pooled in Borja, Aburto 2000 No information
* Only for Mexico City
‡ ESCALA study
Uncertainty analysis
All of the stages described above present a series of assumptions and uncertainties associated with the following aspects: a) selection and frequency of health effects, b) the CRFs, c) the selection of air pollution indicators and d) the exposure distribution in the population. Therefore, the results obtained are only an approximation of what could be expected if air qual
-ity was improved. The discussion below describes the expected influence of each uncertainty factor. In addi
-tion, a sensitivity analysis was performed to evaluate uncertainty with regard to the CRFs.
Generally, a sensitivity analysis estimates results using different thresholds for the estimated point, or suggests different assumptions and examines the varia
-tion in the results. For this study, a sensitivity analysis was performed according to the method proposed by Kunzli and Perez,21 in which the effect of variability in CRFs (upper and lower 95% confidence interval limits) was evaluated. At least two CRF sources were used for the estimates whenever possible.
The project was evaluated and approved by re
-search and ethics committees at the National Institute of Public Health (INSP, by its Spanish initials).
Results
The study area obtained by crossing information in the GIS included Mexico City and 33 municipalities repre
-senting 68.9% of the population of the State of Mexico. The total population for the study area in the year 2005 was 18 419 138 inhabitants.
The highest concentrations of PM10 were found in the northern part of the study area, while the highest O3 concentrations were found in the southeast. Figure 1 summarizes the annual average concentration for the study area. The municipalities of Jaltenco and Tlahuac had the highest annual average concentrations of PM10 and O3, 70.1 µg/m3 and 0.069 ppm, respectively. Based on these results, the following estimates were per
-formed.
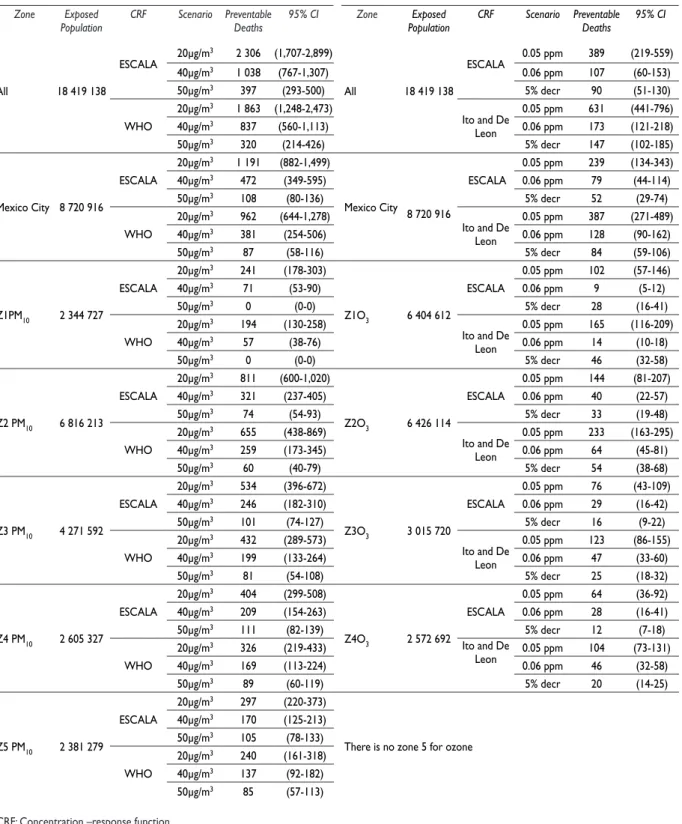
Evaluation of the impact on total
and cause-specific mortality (short-term)
The estimates for preventable cases, or deaths, vary with the CRF used. Table II presents total preventable deaths per study zone for each pollution reduction scenario and CRF used. The results indicate that, using the CRF from the ESCALA study and a PM10 concentration
of 20 µg/m3, it would be possible to prevent approxi -mately 2 300 deaths per year in the entire study area;
that is, 13 deaths per 100 000 inhabitants. If a reduc
-tion to 40 µg/m3 was achieved roughly 1 040 deaths would be prevented per year, or 6 deaths per 100 000 inhabitants. If the Mexican standard of 50 µg/m3 was met, approximately 400 deaths would be prevented per year, or 2 per 100 000 inhabitants. Disaggregating by zone the most number of deaths would be prevented by reducing PM10 concentrations in the center (Z2PM10)
and northwest zones (Z3PM10).
For O3, using the CFR from the ESCALA study, the most reliable CRF available, a reduction in annual aver
-age concentration to 0.05 ppm would prevent approxi
-mately 400 deaths per year; that is, 2 deaths per 100 000 inhabitants. A reduction to 0.06 ppm would prevent approximately 110 deaths per year, and a 5% decrease in concentration would prevent approximately 90 deaths per year. The greatest impact would be expected in the center zone (Z2O3).
The results indicate that the greatest benefit in mor
-tality would be the group over 65 years of age. Using the baseline population of 982 876 for this age group and CRFs from the ESCALA project, approximately 1 400 (95%CI:1 029-2 184) and 300 (95%CI:195-393) deaths would be avoided annually for the most extreme PM10 and O3 reduction scenarios. Using the same CRFs, achieving the Mexican standard for PM10 and decreas -ing O3 concentrations by 5% would achieve a reduction of 212 (95%CI 158-340) and 68 (95%CI:45- 091) annual deaths respectively.
Using the baseline population of 288 694 for children under 1 year of age in the study area, 265 (95%CI:55-468) deaths would be prevented by reducing PM10 levels to 20 µg/m3 and 47 (95%CI:10-84) deaths would be avoided by complying with the Mexican PM10 standard of 50 µg/m3.
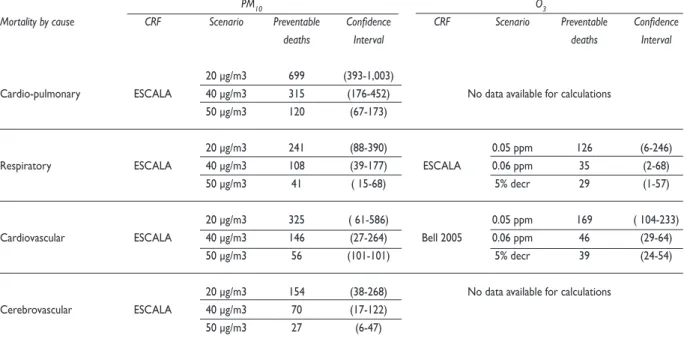
Table III presents the estimates for mortality due to specific causes in the entire study area using the best available CRFs. The greatest benefit is seen for cardio-pulmonary and cardiovascular mortality.
Long-term estimates indicate that achieving the 20, 40 and 50µg/m3 PM
10 scenarios would prevent roughly 10 500 (95%CI:6 563-14 282), 4,800 (95%CI:2 984-6 704) and 1 800 (95%CI:1 836-1 125) deaths, respectively, over a period of 15 years in the population over 30 years of age, using a baseline population of 8 105 538 persons of that age in the study area.
Evaluation of the impact on hospitalizations due to specific causes
-Table II
totalpreventabledeatHSperyearperStudyzoneaccordingtoHypotHeticalScenarioSFor pM10and o3
PM10 O3
Zone Exposed
Population CRF Scenario Preventable Deaths 95% CI Zone PopulationExposed CRF Scenario Preventable Deaths 95% CI
All 18 419 138
ESCALA 20μg/m
3 2 306 (1,707-2,899)
All 18 419 138
ESCALA 0.05 ppm 389 (219-559)
40μg/m3 1 038 (767-1,307) 0.06 ppm 107 (60-153)
50μg/m3 397 (293-500) 5% decr 90 (51-130)
WHO
20μg/m3 1 863 (1,248-2,473)
Ito and De Leon
0.05 ppm 631 (441-796)
40μg/m3 837 (560-1,113) 0.06 ppm 173 (121-218)
50μg/m3 320 (214-426) 5% decr 147 (102-185)
Mexico City 8 720 916
ESCALA
20μg/m3 1 191 (882-1,499)
Mexico City 8 720 916
ESCALA
0.05 ppm 239 (134-343)
40μg/m3 472 (349-595) 0.06 ppm 79 (44-114)
50μg/m3 108 (80-136) 5% decr 52 (29-74)
WHO
20μg/m3 962 (644-1,278)
Ito and De Leon
0.05 ppm 387 (271-489)
40μg/m3 381 (254-506) 0.06 ppm 128 (90-162)
50μg/m3 87 (58-116) 5% decr 84 (59-106)
Z1PM10 2 344 727
ESCALA
20μg/m3 241 (178-303)
Z1O3 6 404 612
ESCALA
0.05 ppm 102 (57-146)
40μg/m3 71 (53-90) 0.06 ppm 9 (5-12)
50μg/m3 0 (0-0) 5% decr 28 (16-41)
WHO
20μg/m3 194 (130-258)
Ito and De Leon
0.05 ppm 165 (116-209)
40μg/m3 57 (38-76) 0.06 ppm 14 (10-18)
50μg/m3 0 (0-0) 5% decr 46 (32-58)
Z2 PM10 6 816 213
ESCALA
20μg/m3 811 (600-1,020)
Z2O3 6 426 114
ESCALA
0.05 ppm 144 (81-207)
40μg/m3 321 (237-405) 0.06 ppm 40 (22-57)
50μg/m3 74 (54-93) 5% decr 33 (19-48)
WHO
20μg/m3 655 (438-869)
Ito and De Leon
0.05 ppm 233 (163-295)
40μg/m3 259 (173-345) 0.06 ppm 64 (45-81)
50μg/m3 60 (40-79) 5% decr 54 (38-68)
Z3 PM10 4 271 592
ESCALA
20μg/m3 534 (396-672)
Z3O3 3 015 720
ESCALA
0.05 ppm 76 (43-109)
40μg/m3 246 (182-310) 0.06 ppm 29 (16-42)
50μg/m3 101 (74-127) 5% decr 16 (9-22)
WHO
20μg/m3 432 (289-573)
Ito and De Leon
0.05 ppm 123 (86-155)
40μg/m3 199 (133-264) 0.06 ppm 47 (33-60)
50μg/m3 81 (54-108) 5% decr 25 (18-32)
Z4 PM10 2 605 327
ESCALA
20μg/m3 404 (299-508)
Z4O3 2 572 692
ESCALA
0.05 ppm 64 (36-92)
40μg/m3 209 (154-263) 0.06 ppm 28 (16-41)
50μg/m3 111 (82-139) 5% decr 12 (7-18)
WHO
20μg/m3 326 (219-433) Ito and De
Leon 0.05 ppm 104 (73-131)
40μg/m3 169 (113-224) 0.06 ppm 46 (32-58)
50μg/m3 89 (60-119) 5% decr 20 (14-25)
Z5 PM10 2 381 279
ESCALA
20μg/m3 297 (220-373)
There is no zone 5 for ozone
40μg/m3 170 (125-213)
50μg/m3 105 (78-133)
WHO
20μg/m3 240 (161-318)
40μg/m3 137 (92-182)
50μg/m3 85 (57-113)
ease could be prevented per year, for the PM10 reduction scenarios of 20 µg/m3, 40 µg/m3, 50 µg/m3 respectively. For the same scenarios, 800 (95%CI:570-1 063), 320 (95%CI:225-421) and 70 (95%CI:51-97) hospitalizations due to cardiovascular disease could be prevented. The greatest decrease in hospitalizations would occur in the group over 65 years of age. In this age group, un
-der the most extreme reduction scenario for PM10, 360 (95%CI:292-427) hospitalizations due to respiratory disease and 700 (95%CI:548-864) hospitalizations due to cerebrovascular disease would be prevented.
Meanwhile, the results indicate that reducing the annual maximum moving average for O3 to 0.05 ppm would prevent approximately 2 000 annual (95%CI:249-3 608) hospitalizations due to respiratory disease and 430 (95%CI:185-612) due to cardiovascular disease. Reducing the annual average O3 concentration by 5% below baseline level would prevent approximately 440 (95%CI:54-809) annual hospitalizations due to respira
-tory disease and 90 (95%CI:40-133) hospitalizations due to cardiovascular disease.
Sensitivity analysis
The sensitivity analysis evaluates uncertainty in CRFs, specifically the effect of CRF variability on calculations and the effect of using CRFs other than those from the ESCALA project, which are considered to be more reli
-able for the study area. Figure 2 presents the percentage
change in the central estimates for the different effects evaluated. The uncertainty margin associated with the 95% CI is between +/- 14% and +/- 95%, with an aver
-age of 51%. The greatest uncertainty corresponds to the estimate of preventable deaths from respiratory disease by reducing O3 concentrations, while for total prevent
-able deaths and deaths among persons over 65 years of age the uncertainty margin is less than 45%.
The sensitivity analysis using alternative CRFs suggests that for reductions in PM10 concentrations, the central estimate could be considerably higher for pre
-ventable deaths among children under one year of age and deaths due to respiratory and cardiovascular dis
-ease; and for reductions in O3 concentrations, estimates for total preventable deaths and deaths among persons over 65 years of age could also be considerably higher. This finding indicates a possible underestimation of the results ranging from 33 to 105%. On the other hand, the negative percentages found with regard to estimates of total preventable deaths (-19%) and preventable deaths for persons over 65 years of age (-45%) point to a possible overestimation of these results.
Discussion
According to the estimates based on CRFs from the ESCALA project, we can see that if PM10 levels were to comply with the current limits established by Mexican standards, total mortality in the study area could be
Table III
preventabledeatHSperyearFroMSpeciFiccauSeSbyreducing pM10and o3levelSovertHeentireStudyarea
PM10 O3
Mortality by cause CRF Scenario Preventable Confidence CRF Scenario Preventable Confidence
deaths Interval deaths Interval
20 μg/m3 699 (393-1,003)
Cardio-pulmonary ESCALA 40 μg/m3 315 (176-452) No data available for calculations 50 μg/m3 120 (67-173)
20 μg/m3 241 (88-390) 0.05 ppm 126 (6-246) Respiratory ESCALA 40 μg/m3 108 (39-177) ESCALA 0.06 ppm 35 (2-68)
50 μg/m3 41 ( 15-68) 5% decr 29 (1-57)
20 μg/m3 325 ( 61-586) 0.05 ppm 169 ( 104-233) Cardiovascular ESCALA 40 μg/m3 146 (27-264) Bell 2005 0.06 ppm 46 (29-64)
50 μg/m3 56 (101-101) 5% decr 39 (24-54)
20 μg/m3 154 (38-268) No data available for calculations Cerebrovascular ESCALA 40 μg/m3 70 (17-122)
reduced by 0.5% (400 deaths, 2 per 100 000). With the strictest measures for reducing PM10 concentrations to
comply with current California EPA standards, greater benefits could be obtained and total annual mortality in the study area could be reduced by 3% (2 300 deaths, 13 per 100 000). Based on this scenario, the estimates for impact on long-term mortality (15 years) indicate that 10 500 deaths could be avoided among persons over 30 years of age.
Although the benefit is less when reducing O3 levels, estimates indicate that it would be possible to prevent approximately 400 deaths if the annual 8-hour moving average for O3 were reduced to 0.05 ppm.
A comparative analysis of the results in each of the concentration zones indicates that the impact of reducing particulates is greater in center (Z2PM10) and northwest (Z3PM10) zones and the impact of reducing
O3 occurs primarily in center (Z2O3) and north (Z1O3)
zones. It is important to remember that the specific calculations for the zones take into account the mortal
-ity rate, the exposed population and concentrations of PM10 and O3 weighted for the population. Therefore, a greater number of cases are found in zones with a larger exposed population, higher mortality rate and higher PM10 or O3 concentrations.
With regard to this last point, the annual aver
-age exposure to particulate matter varies among the 5 zones, with a difference of 20 micrograms per cubic meter between the zones with the greatest (southwest) and the lowest (northeast) concentra
-tions. These differences occur primarily because a large amount of emissions are generated by mobile sources in the central MCMA region and by activity on unpaved roads in the periphery, while industrial emissions are generated in the northern Mexico City municipalities.48 The construction material and iron industries generate roughly 400 tons of PM10 per year in the municipality of Tlalnepantla alone. In Ecatepec, the most significant emissions are gener
-ated by metal smelting and forging, and in Acolman by electricity generation. All of these municipalities are located in the northern part of the MCMA. In ad
-dition, in the central and northern districts of Mexico City, PM10 emissions can be as much as 80 tons per year, primarily from heavy vehicular activity, along with industrial activity in some cases. O3, on the other hand, tends to be concentrated in the southern and southeastern zones. This is mainly because the dominant air stream transports ozone precursors and ozone, concentrating them in these zones.48
Figure 2. reSultS oF SenSitivity analySiS For HealtH beneFitS oF pM10 and o3 reduction ScenarioS
PM10 O3 Total deaths
(shorth term)
Deaths under one year of age
Deaths over 65 years
Deaths from respiratory causes
Deaths from cardiovascular causses
Hospital admissions for respiratory causes
Hospital admissions for cardiovascular causes
CRF OMS 2004 CRF Ito de León 2005 CRF Carbajal-Arroyo 2010 CRF O’Neill y Bell 2008
-100 -75 -50 -25 0 25 50 75 100 Percent of change in central estimate of the benefits
CRF O’Neill, Loomis 2004 CRF OMS 2004
The results show that improving air quality in the MCMA area would provide considerable health benefits. Nevertheless, interpretation of these results should take into account the assumptions and uncertainties associ
-ated with the data and methods used. The validity of the results depends mainly on the quality of population and health data, as well as PM10 and O3 concentrations
and the CRFs used. In our case, with the exception of morbidity data, which may be underestimated, the information comes from reliable information and solid data sources.
Most of the assumptions and uncertainties may have resulted in an underestimation of benefits. This underestimation could be due restricting the analysis
to O3 and PM10 without considering effects of and interactions with other pollutants, such as PM2.5, NO2, SO2, COVs, polycyclic aromatic compounds and CO. In Mexico, the standard for O3 establishes an annual limit of 0.08 ppm, which should not be exceeded more than 5 times per year as an 8-hour moving average. Nevertheless, using only an annual average for ozone could have underestimated the impacts on health since the average does not reflect that the limit of 0.08 ppm was exceeded on more than 59% of the days of the year in 2005.48 The annual average for ozone was chosen for this study, rather than the established standard, so as to not overestimate health impact, especially for zones that are further away from air monitoring stations.
It is also likely that benefits were underestimated by not evaluating effects such as: changes in pulmonary function; lung cancer; school absenteeism; days with restricted activities; visits to emergency rooms; effects on morbidity from certain illnesses such as chronic bronchitis, asthma or lung cancer; and effects on the re
-productive system such as complications in pregnancy, low birth weight, premature birth and delayed cognitive development.
Furthermore, because the long-term CRFs used were not from studies on Mexican populations, only calculations for total mortality were performed for per
-sons over 30 years of age, underestimating the impact due to chronic exposure. For instance, one indicator not included is change in life expectancy. Previous studies show a decrease in this indicator associated with chronic exposure to air pollutants. The Harvard Study for 51 cities in the United States during the 1980s and 1990s reported that a gradual decrease in air pollution levels results in an increase in life expectancy of the population of roughly five months.16 An APHEIS study showed that reducing chronic exposure to particulates less than 2.5 microns (PM2.5) and concentrations less than 15 µg/m3 would increase life expectancy by one month to as much as over two years. That analysis was conducted with a
methodology similar to the one used here. The APHEIS analysis could be reproduced for the MCMA when the necessary data is available.
The CRF is one of the most important components for calculating health impacts. The sensitivity analysis indicates that, depending on the health outcome under evaluation, a 95% CI for CRFs results in a margin of er
-ror of 14 to 95%. Another uncertainty associated with the CRFs is their applicability to different populations and locations. Therefore, for most of the calculations, preference was given to those that included CRFs gen
-erated in the MCMA, and especially those estimated in the ESCALA project, since it included data from 1997 to 2005. Further, the ESCALA project incorporated the most recently developed statistical methods which yield the most accurate and reliable calculations for time-series analyses. Using these CRFs reduces the uncertainty since epidemiological and statistical methods have im
-proved in recent years, allowing for the extrapolation of results and the use of indicators in other populations, as is the case of Mexico City. The sensitivity analysis also evaluated the use of alternate CRFs, finding that in most scenarios the central estimates were underes
-timated. This finding indicates that the benefit would be expected to be greater when other CRFs are used for the estimate. More complex sensitivity analyses using probability models to include other uncertainties were not developed since they require additional data that is not available for the study area.
Finally, an economic evaluation of the health effects presented may be complementary to this study. For mortality, we have avoided assigning costs to expected mortality because we consider determining the rate and number of events to be sufficient in terms of benefits. For morbidity, the study could be complemented by assigning a value to each hospitalization event in order to obtain and estimate of the preventable costs in the health sector.
In conclusion, air pollution continues to have an impact on public health in the MCMA and the results suggest that reducing the current levels of pollutants such as ozone and PM10 would prevent hundreds of deaths and hospitalizations. The spatial distribution of concentrations in the metropolitan area enables identifying and implementing focused interventions in the geographic area, specifically by concentration zones. Even with the limitations and uncertainties in the calculations performed, the HIA is a useful tool for the design of public policies. It is recommended that existing standards be reviewed and adjusted in the context of current scientific evidence and international guidelines. It is also recommended that HIAs be per
and for other cities in the country which may have air monitoring networks.
Acknowledgements
This study had the financial support of the Mexico City Government (Instituto de Ciencia y Tecnología del Distrito Federal). The authors thank Irma Soyachi, Alan Castillo Ferraez and Ana Elizabeth Sandoval Loredo for their assistance in the preparation of this document.
Declaration of conflict of interests. The authors declare that they have no
conflict of interests.
References
1. Samet J, Krewski D. Health effects associated with exposure to ambi-ent air pollution. J Toxicol Environ Health Part A 2007;70:227-242. 2. Curtis L, Rea W, Smith-Willis P, Fenyves E, Pan Y. Adverse health ef-fects of outdoor air pollutants. Environ Int 2006;32:815-830. 3. Brunekreef B, Holgate ST. Air pollution and health. Lancet 2002;360:1233-1242.
4. WHO. Air quality guidelines global update 2005. Germany: World Health Organization, 2006.
5. Anderson JO, Thundiyil JG, Stolbach A. Clearing the air: a review of the effects of particulate matter air pollution on human health. J Med Toxicol 2012;8:166-175.
6. Jerrett M, Burnett RT, Pope CA 3rd, Ito K, Thurston G, Krewski D, et al. Long-term ozone exposure and mortality. N Engl J Med 2009;360:1085-1095. 7. Katsouyanni K, Samet JM, Anderson HR, Atkinson R, Le Tertre A, Medina S, et al. Air pollution and health: a European and North American approach (APHENA). Res Rep Health Eff Inst 2009;5-90.
8. Analitis A, Katsouyanni K, Dimakopoulou K, Samoli E, Nikoloulopoulos AK, Petasakis Y, et al. Short-term effects of ambient particles on cardio-vascular and respiratory mortality. Epidemiol 2006;17:230-233. 9. Pope CA 3rd, Burnett RT, Thun MJ, Calle EE, Krewski D, Ito K, et al. Lung cancer, cardiopulmonary mortality, and long-term exposure to fine particulate air pollution. JAMA 2002;287:1132-1141.
10. Krewski D, Burnett R, Jerrett M, Pope CA, Rainham D, Calle E, et al. Mortality and long-term exposure to ambient air pollution: ongoing analyses based on the American Cancer Society cohort. J Toxicol Environ Health Part A 2005;68:1093-1109.
11. Gallus S, Negri E, Boffetta P, McLaughlin JK, Bosetti C, La Vecchia C. European studies on long-term exposure to ambient particulate matter and lung cancer. Eur J Cancer Prev 2008;17:191-194.
12. Lacasaña M, Esplugues A, Ballester F. Exposure to ambient air pol-lution and prenatal and early childhood health effects. Eur J Epidemiol 2005;20:183-199.
13. Wigle DT, Arbuckle TE, Walker M, Wade MG, Liu S, Krewski D. Environmental hazards: evidence for effects on child health. J Toxicol Environ Health Part B 2007;10:3-39.
14. Kampa M, Castanas E. Human health effects of air pollution. Environ Pollut 2008;151:362-367.
15. Leksell I, Rabl A. Air pollution and mortality: quantification and valua-tion of years of life lost. Risk Anal 2001;21:843-857.
16. Pope CA 3rd, Ezzati M, Dockery DW. Fine-particulate air pollution and life expectancy in the United States. N Engl J Med 2009;360:376-386. 17. APHEIS. Health impact assessment of air pollution and communica-tion strategy: third-year report. Saint-Maurice Cedex: Institut de Veille Sanitaire, 2005.
18. Harris-Roxas B, Harris E. Differing forms, differing purposes: a typology of health impact assessment. Environmental Impact Assessment Review 2011;31:396-403.
19. Boldo E, Linares C, Lumbreras J, Borge R, Narros A, García-Pérez J,
et al. Health impact assessment of a reduction in ambient PM(2.5) levels
in Spain. Environ Int 2011;37:342–8.
20. Baccini M, Biggeri A, Grillo P, Consonni D, Bertazzi PA. Health impact assessment of fine particle pollution at the regional level. Am J Epidemiol 2011; 174:1396-1405.
21. Pérez L, Sunyer J, Künzli N. Estimating the health and economic ben-efits associated with reducing air pollution in the Barcelona metropolitan area (Spain). Gac Sanit 2009;23:287–94.
22. Remy S, Nawrot T, Fierens F, Petit P, Vanderstraeten P, Nemery B,
et al. Health impact of urban air pollution in Belgium. Air Qual Atmos
Health 2011;4:243–6.
23. Boldo E, Medina S, Le Tertre A, Hurley F, Mücke H-G, Ballester F, et al. Apheis: Health impact assessment of long-term exposure to PM(2.5) in 23 European cities. Eur J Epidemiol 2006;21:449-458.
24. Jusot JF, Lefranc A, Cassadou S, D’Helf-Blanchard M, Eilstein D, Chardon B, et al. Estimating mortality attribuable to PM10 particles in 9 French cities participating in the European programme Apheis. Sante Publique 2006;18:71-84.
25. Yorifuji T, Yamamoto E, Tsuda T, Kawakami N. Health impact assess-ment of particulate matter in Tokyo, Japan. Arch Environ Occup Health 2005;60:179-185.
26. Forsberg B, Hansson H-C, Johansson C, Areskoug H, Persson K, Järvholm B. Comparative health impact assessment of local and regional particulate air pollutants in Scandinavia. Ambio 2005;34:11-19. 27. Corbett S. The art of the possible: experience and practice in health impact assessment in New South Wales. N S W Public Health Bull 2005;16:116-118.
28. Mckinley G, Zuk M, Höjer M, Avalos M, González I, Iniestra R, et al. Quantification of local and global benefits from air pollution control in Mexico City. Environ Sci Technol 2005;39:1954-1961.
29. Bell ML, Davis DL, Gouveia N, Borja-Aburto VH, Cifuentes LA. The avoidable health effects of air pollution in three Latin American cities: Santiago, São Paulo, and Mexico City. Environ Res 2006;100:431-440. 30. Molina L. Air quality in the Mexico Megacity: an integrated as-sessment. United States of America: Kluwer Academic Publishers, 2002;vol.2:384.
31. Herman C, Borja-Aburto VH, Kees D, Muñoz-Cruz R, Brander L, Cropper M, et al. Improving air quality in metropolitan Mexico City: an economic valuation. México: The World Bank, Comision Ambiental Metropolitana, 2002;62.
32. Borja-Aburto VH, Rosales-Castillo JA, Torres-Meza VM, Corey G, Olaiz-Fernandez G. Evaluation of health effects of pollution. Ancillary ben-efits and costs of greenhouse gas mitigation. France: OECD, 2000: 592. 33. Carbajal-Arroyo L, Miranda-Soberanis V, Medina-Ramón M, Rojas-Bracho L, Tzintzun G, Solís-Gutiérrez P, et al. Effect of PM(10) and O(3) on infant mortality among residents in the Mexico City Metropolitan Area: a case-crossover analysis, 1997-2005. J Epidemiol Commu Health 2011;65:715-721.
34. Romieu I, Gouveia N, Cifuentes LA, de León AP, Junger W, Vera J, et al. Multicity study of air pollution and mortality in Latin America (the ESCALA study). Res Rep Health Eff Inst, 2012;171:5-86.
35. Lloyd CD. Local models for spatial analysis. United States of America: CRC Press, 2006;vol.1:244.
36. Ivy D, Mulholland JA, Russell AG. Development of ambient air quality population-weighted metrics for use in time-series health studies. J Air Waste Manag Assoc 2008;58:711-720.
38. Anderson HR, Atkinson RW, Peacock JL, Marston L, Konstantinou K. Meta-analysis of time-series studies and panel studies of particulate matter (PM) and ozone (O3). Copenhagen: World Health Organization Regional Office for Europe, 2004.
39. O’Neill MS, Bell ML, Ranjit N, Cifuentes LA, Loomis D, Gouveia N,
et al. Air pollution and mortality in Latin America: the role of education.
Epidemiology 2008;19:810-819.
40. Künzli N, Kaiser R, Medina S, Studnicka M, Chanel O, Filliger P, et al. Public-health impact of outdoor and traffic-related air pollution: a European assessment. Lancet 2000;356:795-801.
41. Rosales-Castillo JA, Torres-Meza VM, Olaiz-Fernández G, Borja-Aburto VH. Acute effects of air pollution on health: evidence from epidemiological studies. Salud Publica Mex 2001;43:544-555.
42. McKinley G, Zuk M, Hojer M, Avalos M, González I, Hernández M, et al. The local benefits of global air pollution control in Mexico City. Final Report of the Second Phase of the Integrated Environmental Strategies Program in Mexico. México DF: Instituto Nacional de Ecología, Instituto Nacional de Salud Pública México, 2003.
43. Abbey DE, Petersen F, Mills PK, Beeson WL. Long-term ambient concentrations of total suspended particulates, ozone, and sulfur dioxide and respiratory symptoms in a nonsmoking population. Arch Environ Health 1993;48:33-46.
44. Ito K, De Leon SF, Lippmann M. Associations between ozone and daily mortality: analysis and meta-analysis. Epidemiol 2005;16:446-457. 45. Levy JI, Chemerynski SM, Sarnat JA. Ozone exposure and mortality: an empiric bayes metaregression analysis. Epidemiol 2005;16:458-468. 46. O’Neill MS, Loomis D, Borja-Aburto VH. Ozone, area social condi-tions, and mortality in Mexico City. Environ Res 2004;94:234-242. 47. Bell ML, Dominici F, Samet JM. A meta-analysis of time-series studies of ozone and mortality with comparison to the national morbidity, mor-tality, and air pollution study. Epidemiol 2005;16:436-445.
48. SMA-GDF. Inventario de emisiones de contaminantes criterio de la Zona Metropolitana del Valle de México 2006. Ciudad de México: SMA-GDF, 2008.