Effect of pretreatments on biogas production from microalgae biomass grown in pig manure treatment plants
Judit Martín Juárez, Elena Riol Pastor, José M. Fernández Sevilla, Raúl Muñoz Torre, Pedro A. García-Encina, Silvia Bolado Rodríguez
PII: S0960-8524(18)30256-6
DOI: https://doi.org/10.1016/j.biortech.2018.02.063
Reference: BITE 19572
To appear in: Bioresource Technology
Received Date: 25 December 2017 Revised Date: 12 February 2018 Accepted Date: 13 February 2018
Please cite this article as: Martín Juárez, J., Riol Pastor, E., Fernández Sevilla, J.M., Muñoz Torre, R., García-Encina, P.A., Bolado Rodríguez, S., Effect of pretreatments on biogas production from microalgae biomass grown in pig manure treatment plants, Bioresource Technology (2018), doi: https://doi.org/10.1016/j.biortech.2018.02.063
Effect of pretreatments on biogas production from microalgae biomass grown in pig
manure treatment plants
Judit Martín Juáreza, Elena Riol Pastora, José M. Fernández Sevillab, Raúl Muñoz
Torrea, Pedro A. García-Encinaa, Silvia Bolado Rodrígueza*
a
Department of Chemical Engineering and Environmental Technology, University of
Valladolid, Calle Doctor Mergelina s/n, 47011, Valladolid, Spain
b
Department of Chemical Engineering, University of Almería, Cañada San Urbano s/n,
04120, Almería, Spain
Authors e-mail addresses: [email protected], [email protected],
[email protected], [email protected], [email protected], [email protected]
* Corresponding author
ABSTRACT
Methane production from pretreated and raw mixed microalgae biomass grown
in pig manure was evaluated. Acid and basic pretreatments provided the highest volatile
solids solubilisation (up to 81%) followed by alkaline-peroxide and ultrasounds (23%).
Bead milling and steam explosion remarkably increased the methane production rate,
although the highest yield (377 mL CH4/g SV) was achieved by alkali pretreatment.
Nevertheless, some pretreatments inhibited biogas production and resulted in lag phases
of 7-9 days. Hence, experiments using only the pretreated solid phase were performed,
which resulted in a decrease in the lag phase to 2-3 days for the alkali pretreatment and
slightly increased biomass biodegradability of few samples. The limiting step during
the BMP test (hydrolysis or microbial inhibition) for each pretreatment was elucidated
using the goodness of fitting to a first order or a Gompertz model. Finally, the use of
digestate as biofertilizer was evaluated applying a biorefinery concept.
Highlights
Pretreatments solubilised volatile solids but also inhibited biogas production.
Alkali pretreatment increased 2.3 times the methane production of the raw
material.
The removal of pretreated liquids did not improve the global methane
production.
Gompertz model fitted the results of methane production controlled by
inhibition.
Keywords: anaerobic digestion, fertilizer, inhibition, kinetic model, methane
1. Introduction
Over the past decades, the concurrent developments in society, science, and
technology have resulted in a higher demand for energy. One of the principal challenges
in today’s society is to provide a reliable energy supply for the future, which is hindered
by the increasing prices of oil and gas (Kavitha et al., 2017a). Multiple eco-friendly
alternatives, such as the production of bioethanol, biodiesel or biogas from wastes, have
been considered and developed to make processes more environmentally friendly and
feasible. The conversion of residual biomass into biogas via anaerobic digestion is
considered the simplest and most straightforward way, since it requires mild
pretreatments and low-cost equipment (Kavitha et al., 2017b).
Biomass grown in wastewater treatment plants is a suitable substrate for biogas
production. Among the possible biological wastewater treatment alternatives, the use of
microalgae is an emerging challenge, especially for effluents such as pig manure with a
high nutrient concentration. Microalgae are able to grow in these wastewaters
assimilating organic matter, N and P. Although wastewater treatment coupled to the
anaerobic digestion of the microalgae biomass produced is a sustainable and interesting
alternative, most studies on biogas production from microalgae have focused on single
species (Mussgnug et al., 2010).
The type of microalgae and the cultivation conditions are essential parameters
affecting its macromolecular composition and the cell wall resistance, and hence its
potential biogas production (Klassen et al., 2016). Murphy et al., (2015) reported
L/g VS from lipids, 0.851 L/g VS from proteins, and 0.746 L/g VS from
carbohydrates). Additionally, biomass grown in microalgae-based treatment plants
contains resistant microalgae species and a huge number of bacteria. To evaluate the
feasibility of the combined process of wastewater treatment and biomass valorisation,
the study of biogas production from this type of mixed microalgae biomass is required
(Jankowska et al., 2017).
The application of pretreatments to disrupt the cell wall represents a promising
alternative to increase the biodegradability of mixed microalgae biomass composed of
recalcitrant microalgae species. Most of the information reported in literature refers to
microalgae grown in domestic wastewater. Passos et al., (2015) carried out different
pretreatments such as ultrasound and hydrothermal pretreatments in a mixed microalgae
biomass cultivated in domestic wastewater (Stigeoclonium sp. and Monoraphidium sp.
and diatoms Nitzschia sp. and Navicula sp.). Hydrothermal pretreatment (130ºC)
increased the methane yield (135 mL CH4/g VS) compared to the untreated control
(106 mL CH4/g VS). However, in this case, ultrasound pretreatment (26700 J/g TS) did
not significantly improve methane production. In another study, Passos et al., (2016a)
studied the effect of two thermochemical pretreatments (KOH and HCl) on biogas
production from microalgal biomass. They reported an increase in methane production
up to 82% and 86% compared to the untreated biomass (78 mL CH4/g VS) for alkaline
and acid pretreatments, respectively.
Nevertheless, Passos et al., (2016a) also observed an inhibitory effect under
severe pretreatment conditions. Most of the reported degradation compounds generated
by pretreatments in algae (Martín Juárez et al., 2016) or other types of biomasses were
et al., 2016). Therefore, the systematic comparison of biogas production using both
fractions (solid and liquid fractions) or only the solid fraction of pretreated samples will
provide a valuable information about the effect of the pretreatment technology on the
biodegradability of biomass and generation of inhibitory compounds.
Following the valorisation as biogas of the organic matter present in microalgae,
a significant load of nutrient is expected in the digestates, especially from biomass
grown in wastewater with high N and P content. The use of the residual effluent from
microalgae anaerobic digestion as fertilizer would lead the integral valorisation of the
mixed microalgae biomass (Acién et al, 2014).
This study aimed at investigating the production of biogas by anaerobic
digestion of mixed algal biomass grown in pig manure treatment plants. This work
evaluated first the efficiency of different pretreatments (bead mill, alkaline, steam
explosion, alkali-peroxide, ultrasound, and acid pretreatments) under two extreme
operating conditions on CH4 productivity. Furthermore, the methane productions from
the whole suspension and the only solid fraction from pretreatment were compared in
terms of the methane production yield to evaluate the generation of any potential
inhibition induced by the pretreatments, kinetic modelling being used to identify the
limiting step of the anaerobic digestion of the pretreated biomass. Finally, the
composition of the digestates was analysed and their potential use as bio-fertilizers was
evaluated to recover the high nutrients load of pig manure using a bio-refinery
approach.
2. Materials and methods
Fresh mixed microalgae biomasses were cultivated in a thin-layer
photobioreactor with a volume of 1200L fed with pig manure diluted at 10% at two
different times of the year: February and March. The composition during February was
23.67% carbohydrates, 43.31% proteins, 16.74% lipids, 83.17% volatile solids, and 987
mg O2/ kg of COD, all of them in a dry basis. The microalgae species were Tetradesmus
obliquus (29%), Tetradesmus lagerheimii (26%), Desmodesmus opoliensis (16%),
Aphanothece saxicola (11%), Chlorella vulgaris (5%), Scenedesmus magnus (4%),
Parachlorella kessleri (3%), and others in lesser amounts. The composition during
March was 38.11% carbohydrates, 24.83% proteins, 12.51% lipids, 74.5% % volatile
solids and 1150 mg O2/ kg in a dry basis. The microalgae species were Desmosdesmus
opoliensis (47%), Navicula reichardtiana (27%), Tetradesmus obliquus (12%),
Scenedesmus sp. (9%), and Scenedesmus acuminatus (5%). The biomass was supplied
by the Cajamar Foundation (Almeria, Spain) and centrifuged at 78.75% (February) and
77.91% (March) of moisture and refrigerated at 4ºC prior to use.
2.2. Pretreatments
The pretreatments performed for the biomass from February were bead mill,
alkaline (NaOH), steam explosion, and alkaline-peroxide (H2O2) pretreatments, all of
them at 5% (w/w) dry weight. Two levels of bead mill pretreatments (Postma et al.,
2017) were carried out: A (small beads 1.25 mm and 5 minutes) and B (big beads 2.50
mm and 60 min), using distilled water in the mill until 200 mL of total volume (Pascal
Engineering Co. Ltd). The alkaline pretreatment was carried out in 1 L borosilicate
bottles with NaOH 0.5M (C) and 2M (D). Adequate volumes of NaOH solutions (of the
volume, and, then, suspensions were autoclaved at 121ºC for 60 minutes
(Bolado-Rodríguez et al., 2016). The steam explosion pretreatment was carried out using
saturated steam at 130ºC during 5 minutes (E) and at 170ºC during 20 minutes (F) in a
5L stainless steel reactor filled with 800 mL of suspension (Alzate et al., 2012). After
the selected operation time, the steam was flashed and the biomass was cooled down in
another vessel (Marcos et al., 2013). For the alkaline-peroxide pretreatment, known
mass of microalgae were placed in 1 L bottles and adequate volumes of H2O2 solutions
of the selected concentrations 0.5% (G) and 7.5% (H) were added to obtain 200 mL of
total volume (Martín Juárez et al., 2016).Then, the pH was adjusted to 11.5 with 2 M
NaOH, a few drops of antifoam were added, and the systems were incubated in a
rotatory shaker at 50ºC and 120 rpm for 60 minutes.
Ultrasound and acid (HCl) pretreatments at 5% (w/w) dry weight were
performed on the biomass from March. The ultrasound pretreatment was carried to a
total volume of 400 mL of microalgae biomass diluted with distilled water in
Ultrasound Technology (Hielscher UIP1000hd), during 5 (I) and 21 minutes (J),
(Alzate et al., 2012). Power was calculated to expend identical amount of energy (7186
J/g TS) for the two operation conditions, according to Equation (1). This consumption
of energy, considered a limit value, was calculated as the difference between energy
from the maximum theoretical potential of biogas production and the experimental
biogas production from the raw biomass.
(Eq. 1)
where P is the average ultrasonic power (Watts), t is the ultrasonic time (seconds), V is
The acid pretreatment was carried out in borosilicate bottles with HCl 0.5 (K)
and 2M (L) (Bolado-Rodríguez et al., 2016). The known mass values of microalgae
were placed in 1 L bottles, adequate volumes of HCl solutions (of the selected
concentrations) were added to obtain a volume of 200 mL of, and suspensions were
autoclaved at 121ºC for 60 minutes. All the pretreatments were conducted in duplicate.
After the pretreatments, the resulting suspensions were centrifuged at 10000
rpm, for 10 minutes. The solid and liquid fractions were weighed. Next, the total and the
volatile solids were analyzed both in the solid and liquid fractions and in the pretreated
whole. Samples of whole pretreated suspensions (named 1) and only solid fractions
(named 2) were stored at 4ºC for biogas production experiments. The following
parameter was defined to calculate the percentage of volatile solids retained:
Eq. (2)
2.3. Biogas production
Biochemical methane potential (BMP) tests were carried out to study the
biodegradability of the microalgae biomass in triplicate following the protocol of
Angelidaki et al., (2009). Batch mode assays were performed under mesophilic
conditions in 300 mL borosilicate glass bottles with a working volume of 100mL. The
effluent from a pilot scale mesophilic anaerobic digester processed mixed sludge from a
municipal wastewater treatment plant, with a volatile solids (VS) concentration of 9.1 ±
0.08 g VS/kg was used as inoculum for the tests. Two series of experiments were
performed to determine the influence of the pretreatment and the inhibitory effect of the
compounds present in the liquid phase: (1) using the whole pretreated suspension; and
was also conducted which aimed to check the methanogenic activity of the inoculum
(Bolado-Rodríguez et al., 2016).
NaOH or HCl were added, if necessary, to pre-neutralize the samples to pH
values 8 for alkaline samples or 5.5 for acid samples. Identical mass of inoculum was
used in all the BMPs tests of untreated microalgae biomass, whole suspensions, and
solid fractions from pretreatments. Based on previous studies, weighed amounts of
pre-neutralized algal biomass were added to obtain an identical ratio of substrate/inoculum
of 0.5 g VS/g VS in all the experiments (Alzate et al., 2012). Distilled water was used to
fill the 100 mL working volume, when it was required. The pH of the initial mixture
was always between 6.5 and 7. Before starting the tests, the bottles were closed with
rubber septa and aluminum crimps. Helium gas was circulated inside the gas chamber
for 5 minutes and the test started after releasing the pressure. The bottles were placed
horizontally on a rotary desk with constant mixing under mesophilic conditions in a
thermostatic room (37 ± 0.5 ºC) (Bolado-Rodríguez et al., 2016).
Biogas production in the headspace of each bottle was measured periodically by
a manual pressure transmitter (PN5007, range 0–1 bar, IFM Electronics) over a period
of 30-45 days. The biogas composition was determined by gas chromatography.
Specific methane yields are expressed as the volume of methane under standard
conditions, i.e. 0ºC and 1 atm for gases, as defined by the International Union of Pure
Applied Chemistry (IUPAC), per gram of VS in the substrate fed into the assay (N mL
CH4/g VS). Theoretical methane yields, calculated from the ratio of COD/VS performed
for every substrate, were 415 mL and 540 mL CH4/g VS for February and March,
After the anaerobic digestion, the possible use of selected digestates as fertiliser
was evaluated, analysing TS, VS, elements (C, H, N, S, P), heavy metals (Al, As, Cd,
Co, Cr, Cu, Fe, Mg, Mn, Ni, Pb, Zn, Hg), and pathogens (Salmonella spp. and E. Coli).
2.4. Kinetic models
First order model (Eq. (3)) and the modified Gompertz equation (Eq. (4)) were
applied to fit the cumulative methane production data from the experiments (Lay et al.,
1996). The first order model fits successfully results of anaerobic biodegradability tests
when the hydrolysis reaction is the rate-limiting step. The modified Gompertz model
fits better the cumulative methane production in batch assays when occurs inhibition,
assuming that the methane production is function of bacterial growth
(Bolado-Rodríguez et al., 2016). Moreover, the model parameters were calculated by minimizing
the least square difference between observed and predicted values.
(Eq. 3)
(Eq. 4)
In these equations, B represents the cumulative methane production (mL CH4/g
VS) and t is the time of the assay (d). These models estimate the methane production
potential B0 (mL CH4/ g VS, related to the substrate biodegradability), the hydrolysis
coefficient kH (d-1), the maximum biogas production rate Rm (mL CH4/g VS d), and the
lag time λ (d).
2.5. Analytical methods
The identification, quantification, and biometry measurements of microalgae
(fixed with lugol acid at 5% and stored at 4°C prior to analysis) according to Sournia,
(1978). The COD concentration was determined according to APHA Standard Methods
(2005). The total and volatile solids were measured following the NREL (Van Wychen
and Laurens, 2015a). The carbohydrate content was determined by acid hydrolysis and
HPLC-RI using an NREL procedure (Van Wychen and Laurens, 2015b). The protein
content in the raw materials was correlated with the Total Nitrogen Kjeldahl, multiplied
by a factor of 5.95, and the lipid content was determined by the Kochert method
(González Lopez et al., 2010). The determination of the carbon, nitrogen, and hydrogen
content of the biomass was performed using a LECO CHNS-932 analyzer, while
phosphorus, sulphur, and all the heavy metals analyses were carried out
spectrophotometrically after acid digestion in a microwave according to the internal
protocol of the Laboratory of Instrumental Analysis of The University of Valladolid.
The CO2, H2S, CH4, O2, and N2 concentrations in the gas phase of biogas
samples were determined using a Varian CP-3800 GC-TCD (Palo Alto, USA) equipped
with a CP-Molsieve 5A (15 m × 0.53 mm × 15 μm) and a CP-Pora BOND Q (25 m ×
0.53 mm × 15 μm) columns (Posadas et al., 2015). The analysis of Salmonella spp. and
Escherichia Coli were measured following the UNE-EN ISO 6579:2003/A1:2007 and
UNE-EN ISO 9308-2:2014, respectively.
3. Results and discussion
3.1. The pretreatments effect in terms of volatile solids solubilisation
Mixed biomasses were used in this study with different macromolecular
compositions as shown in Section 2.1. These differences, mainly in carbohydrate and
comparison between pretreatments applied to the different biomasses was only studied
in terms of general results. Molinuevo-Salces et al., (2016), who treated swine slurry at
different temperatures, illumination periods, and NH4+ concentrations, also observed the
influence of operational conditions in the biomass composition. Carbohydrate content
increased from 35%-40% under non-favorable conditions and up to 50%-60% in the
summer experiments.
Mass balances were made for all the experiments considering retained volatile
solids in the solid fraction and released volatile solids in the liquid fraction.
Additionally, the total mass of the both fraction from pretreatment were considered. The
differences found between the initial VS and the total VS after pretreatment were
always lower than ±10%. All the performed pretreatments solubilised volatile solids,
but in different amounts, as shown in Figure 1 as the percentage of volatile solids
retained. The alkaline and acid methods involved a high solubilisation of volatile solids
while the bead milling or ultrasound methods solubilised only a small fraction of these
solids. Contrary to what was expected, the retained volatile solid yield of
alkaline-peroxide pretreatment was high, much like the results of the mechanical ultrasound
method. This high solid recovery compared to the results of the basic pretreatment
could be related to the low concentration of NaOH in these experiments. The most
intense condition only increased remarkably volatile solids solubilisation for acid
pretreatment with yields of retained volatile solids decreasing from 40% to 19%. A light
increase was found for alkaline-peroxide (from 81% to 73%) and ultrasound
pretreatments (from 86 to 76%). As previously reported for alkaline-peroxide
Juárez et al., 2016), no clear effect of severity in the studied range was observed for
other pretreatments apart from the acid one.
Passos et al., (2016a) applied KOH and HCl at different concentrations (0.5,
1.25, and 2% w/w) at 80ºC for 2 hours to the biogas production from microalgal
biomass grown in urban wastewater treatment. They reported around 50% of TOC
solubilisation for the acid pretreatment and up to 200% for the alkaline pretreatment
with respect to the thermal pretreatment (80ºC, 2 hours) as their control.
3.2. Biogas production
3.2.1. Test 1: BMP of untreated raw materials and of pretreated whole suspensions
The anaerobic digestion of whole suspensions after the pretreatments was
carried out to harness volatile solids released in the liquid phase and to avoid a
separation step. Figures 2a and 3a present the cumulative methane production curves
from Test 1 in terms of methane production (the volume of methane gas produced per
gram of volatile solid in the substrate). This test worked with untreated and pretreated
whole suspensions from the microalgae biomass from February. Figure 4a presents the
results of the microalgae biomass from March. Other terms such as biodegradability –
defined as the percentage of the theoretical methane yield determined for raw substrates
– and normalized production of methane (NP) – defined as the ratio between the
production of methane per gram of VS from treated and untreated microalgae biomass –
are used in this discussion.
For both biomasses, the biodegradability of the untreated microalgae was 39%
with respect to the theoretical methane yield (415 mL CH4/g VS for February and 540
biomass are comparable to a range of 106 mL to 146 mL CH4 g/COD as reported by
Molinuevo-Salces et al., (2016) who worked with different microalgae biomasses
grown in pig manure. Contrary to our experiment, Passos et al., (2016b) reported lower
methane yields in the biomass from March than in the biomass from February, with
values of 72 mL and 128 mL CH4/g COD, respectively.
The highest methane production of all the assays was achieved by alkaline
pretreatment at the high NaOH concentration (D1) after overcoming an initial delay,
with 377 mL CH4/g VS; 91% of biodegradability and an NP value of 2.34. Although C
pretreatment reported a slightly higher volatile solids release than D, the biogas
production was remarkably lower and very similar to the untreated biomass (C1: 173
mLCH4/g VS; 42% biodegradability and NP 1.08) and also contained a considerable lag
phase. Passos et al., (2016a) reported increases on methane production of 82% with
respect to the untreated biomass for alkaline pretreatment at low NaOH concentrations
(0.5%, 80ºC, 2 hours), but the methane production from the untreated biomass was very
low in this study (78 mL CH4/g VS).
The second-best result was achieved by the alkaline-peroxide pretreatment, but
working with a low peroxide concentration (G1: 279 mL CH4/g VS; 67% of
biodegradability and NP 1.73). In this case, the increase in the severity of the condition
caused methane production to be slightly lower than the methane production of the
untreated material (H1: 148 mL CH4/g VS; 36% of biodegradability and NP 0.92),
probably due to an inhibition that could not be coped with.
Despite the low effect on biodegradability, some pretreatments such as bead
milling and steam explosion had an advance of methane production. Biomass pretreated
advance was also reported by Gruber-brunhumer et al., (2015) but they reached an
increase of 51% (289 mL CH4/g VS) using milling (100 g of biomass mixed with 40 g
of glass beads for 20 minutes, cooling to 20ºC) with respect to the untreated biomass
(191 mL CH4/g VS). No enhancement of methane production was observed at severe
conditions of both pretreatments, reporting NP values of 1.00 and 0.91 for B1 and F1,
respectively. For the mildest conditions, methane production increased slightly,
reaching NP values of 1.06 and 1.11 for A1 and E1, respectively. Passos et al., (2015)
reported a significant increase of 28% on the methane yield by hydrothermal
pretreatment at 130ºC for 15 minutes (135 mL CH4/g VS) with respect to the untreated
mixed microalgae biomass from urban wastewater treatment.
The other pretreatment assays recorded no improvement with respect to the
untreated biomass in terms of methane production and biodegradability. Acid
pretreatments provided even lower methane production than untreated material with an
NP of 0.95 for K1 and 0.90 for L1. However, Passos et al., (2016a) reported an increase
of methane production of 86% with respect to the untreated biomass for acid
pretreatment at 0.5%, 80ºC for 2 hours. However, as mentioned previously, the methane
production in this study was very low.
Surprisingly, the biogas production was remarkably reduced by ultrasound
pretreatment and further for the higher time conditions (J1: 137 mL CH4/g VS; 25% of
biodegradability and NP 0.66). The lag phase detected in biogas production from
ultrasound pretreated biomass confirmed the possible inhibitory effect of this method.
The decrease on biogas production with pretreatment time, even expending identical
energy amount, could be related with the higher impact of time in inhibition. Similar
by ultrasound pretreatment. Gruber-brunhumer et al., (2015) reported an increase of
52% (292 mL/g VS) with respect to the untreated biomass by ultrasound pretreatment
but they expended 20000 J/g TS, working with pure microalgae (Acutodesmus
obliquus).
3.2.2. Test 2: BMP of solid fraction from pretreatments
Cumulative methane production curves from Test 2 are presented in Figures 2b
and 3b (for February) and in Figure 4b (for March). These figures show the results from
the solid fractions after the pretreatments and the results from the untreated microalgae
biomasses.
In this test, the solid fractions from alkaline pretreatment again provided the
highest increase in methane production. Material pretreated with NaOH 2M (D2)
achieved methane production values of 296 mL/g VS, 71% of biodegradability and 1.84
of NP. Despite the fact that these values were the highest for Test 2, they were lower
than the results achieved from whole suspension, demonstrating that the VS of liquid
fractions were more biodegradable than the VS of solids. However, this behavior was
not detected with the solid fraction of NaOH 0.5M which reached a higher methane
production (232mL CH4/g of VS) than whole fraction, with 56% biodegradability and
an NP 1.44. In this case, the inhibition was reduced or avoided by removing the liquid
phase since most of the possible inhibitory compounds were soluble. This low
inhibition was confirmed with the shortening of lag phase with respect to experiments
with whole suspensions.
Apart from the alkaline pretreatment, only acid pretreatment with HCl 2M
NP 1.20) with respect to the untreated biomass and to the whole suspension. The
inhibition played a key role in this pretreatment and decreased when the liquid fraction
was removed.
The biodegradability of VS on the solid fraction from the alkaline-peroxide
pretreatment at mild conditions was very low (G2: 95 mL CH4/g of VS; 23%
biodegradability and NP 0.59), showing a drastic reduction with respect to whole
suspension but also to the untreated material. The VS retained in the solid fraction was
high in this experiment (81%), and the possible high biodegradability of VS solubilized
into the liquid fraction cannot justify this huge difference.
In the same way, bead milling pretreatment did not advance the anaerobic
digestion of the solid fraction. However, a slight increase in methane production was
only observed for B2 (180 mL CH4/g of VS; 41% biodegradability and NP 1.12).
Results of the other applied pretreatments were similar to those obtained from the whole
suspension experiments.
In order to calculate the global methane production balance, the losses of
volatile solids solubilized to the liquid phase during the pretreatment and removed in
these experiments must be considered (Figure 1). Referring the methane production
from the pretreated solid to the initial VS in the raw biomass before the pretreatment,
only the bead mill pretreatment for 60 minutes (B2) slightly enhanced the methane
production with respect to the untreated biomass, with an NP of 1.08. For the other
pretreatments, the increase in methane production by gram of volatile solid did not
counteract the volatile solids’ losses in the removed liquid fraction. If VS removal is
considered, even the pretreatments with the highest biodegradability provided global NP
(K2) and 0.23 (L2) for acid pretreatment.
3.3. Kinetics
Two different models were tested to fit the experimental results of cumulative
methane production and to calculate the kinetic parameters. The first order model
considers the hydrolysis reaction as the limiting step while the modified Gompertz
equation considers bacterial growth and, hence, the inhibition of the process as the
limiting step. Table 1 shows the model kinetic parameters that provided the best fit of
methane production for each pretreatment and operational condition, working with the
whole suspension and with only the solid fraction.
In the case of the biomass from February, methane production from untreated
and bead mill pretreatment (A and B) were fit using the first order kinetic. Bead mill
pretreatment is a mild method, which gently opens the cell wall, generating scarce
amounts of degradation compounds. Thus, the hydrolysis reaction was the limiting step
in these cases. The methane potentials obtained for all the bead mill experiments were
similar to that of the untreated microalgae biomass. The rapid increase of methane
production previously mentioned for experiments with whole suspensions was reflected
in the hydrolysis coefficient, which remarkably increased even more at the mildest
conditions (A1).
Gompertz model was required for fitting the whole suspensions and solid
fractions from alkaline conditions. This pretreatment was the most effective, increasing
the methane potential up to 234% for NaOH 2M when working with the whole
suspension. As expected, the lag period (inhibition) was longer for experiments with
However, the inhibition effect decreased with the NaOH concentration while also
increasing the maximum biogas production rate. Pretreatment with NaOH 0.5 M caused
a high lag phase but the mild conditions did not open the structure and enhance the
methane production potential. The lag phase using only solid fractions was shorter, and
pretreatment increased the methane production potential by nearly 150% for NaOH
0.5M and 200% for NaOH 2M. Nevertheless, they did not achieve the results that were
obtained by using the whole fractions at a high NaOH concentration. Moreover, the
high mass losses by solubilisation in these experiments should be still considered.
Passos et al., (2016a) also used the Gompertz model to fit the methane production from
microalgae grown in urban wastewater and pretreated with KOH, even while working
with lower concentrations. They reported lag phases that increased with the alkaline
concentration from 1.20 days with KOH 0.5% up to 6 days with KOH 2.0%.
The results of steam explosion pretreatment were fit with first order model as the
untreated biomass, with hydrolysis as the limiting step. The pretreatment increased the
kinetic coefficients of whole suspensions three times (E1 and F1), but the methane
production only increased 11% for E1. The results of methane production were similar
to the untreated material. As detected in the bead milling pretreatment, the steam
explosion pretreatment reduced the reaction time when working with whole
suspensions, but maintained or slightly increased the biogas production.
Regarding alkaline-peroxide pretreatment, all the conditions were fit with the
first order model except for H2 which required the use of the Gompertz model. This
behaviour was the opposite of that noticed in other chemical pretreatments because the
inhibition appeared using only the solid fractions. Nevertheless, the methane production
while B0 decreased remarkably for G2 (with milder conditions and no apparent
inhibition). Regarding the whole suspensions, G1 practically doubled the methane
production potential but decreased the kinetic. This effect was exactly the opposite
when increasing the pretreatment severity.
The untreated biomass from March was fit with a first order model with higher
methane production potential but a lower kinetic coefficient than the untreated biomass
from February. The experimental results from all the assayed pretreatments were fit
using the Gompertz model with a long lag phase from 6.2 to 10.7 days, showing a
remarkable inhibitory effect. The only pretreatment providing a certain increase of
methane production potential (20%) was the acid pretreatment at severe conditions
(L2), when using only the solid fraction but with the longest lag phase (10.7). Passos et
al., (2016a), working with HCl, reported lag phases that increased with the acid
concentration (0.43 days for 0.5%, 3 days for 1.25%, and 5 days for 2%), but all the
experiments required the Gompertz model to fit the results.
Additional research is necessary in order to identify the inhibitory compounds
generated by some of the pretreatments, which were unexpectedly retained in the solid
phase. Further continuous anaerobic digestion tests would provide relevant information
about acclimation of microorganisms to the pretreated substrates, which would enhance
both methane production yields and microbial kinetic.
3.4. Fertilisers analysis
Table 2 shows the composition of some residues after anaerobic digestion in
order to evaluate their possible application as fertilizers. Digestates from tests that
alkaline-peroxide, and acid pretreatments). The content of nitrogen was clearly reduced
in the samples from alkali media due to the effect of basic pH on protein release and
ammonia stripping. The NPK content of digestate from pretreated samples was always
lower than from untreated biomasses, but higher than the minimum legal threshold
value of 7% (w/w). This excess was very low for samples from the biomass from
March. The ratio C/N increased in basic pretreatments, because of N removal, but
remained lower than the maximum allowed value of 15. The content of As was much
lower than the maximum limit of 50 mg/kg. The minimum legal content of the other
analysed elements depends of the fertilizers use: extensive and grazing cultivation,
fertirrigation or horticultural use, and foliar; but Cu and Mn supplementation would
likely be necessary (Reglamento CE 2003/2003, 2003).
Regarding microbiology, the digestate from the untreated biomass from
February did not contain pathogens and the results did not provide information about a
possible sterilization effect of these pretreatments. However, a clear sterilizing effect of
acid pretreatment was observed, remarkably reducing the E.coli content of the final
digestate.
In summary, the digestates from anaerobic digestion of algal biomass grown in
pig manure have a potential application as fertilizers. The initial microalgae biomass
composition should be considered, mainly for the variability of nitrogen content
throughout the year and the cultivation conditions.
4. Conclusions
Acid and alkaline pretreatments solubilised high percentage of VS but induced a
whole broth of alkaline (234%) and alkaline-peroxide (173%) pretreatments, while bead
mill and steam explosion increased the methane production rate by a factor of 5 and 3,
respectively. The methane yield was not improved by removing the liquid phase. The
fitting to kinetic models revealed the impact of each pretreatment in terms of hydrolysis
or inhibition. Finally, the composition of the digestates, with NPK higher than 7%
(w/w) and C/N lower than 15, allows their use as fertilizers.
5. Acknowledgements
This work was supported by the research unit UIC 071 of the regional
government “Junta de Castilla y León – JCyL”, Spain. The authors thank “Instituto
Nacional de Investigación y Tecnología Agraria y Alimentaria – INIA”, “Ministerio de
Economía y Competitividad – MINECO” (RTA2013-00056-C03-02) supported by
FEDER program, and “Junta de Castilla y León – JCyL” (VA094U14) for the financial
support of this work. Judit Martin wishes to thank “Junta de Castilla y León – JCyL” for
providing her Doctorate Scholarship.
6. References
Acién F.G., Fernández, J.M., Molina-Grima E., 2014. Economics of Microalgae
Biomass Production, in: Pandey A., Lee D.J., Chisti Y., Soccol C.R. (Eds) Biofuels
from Algae, Burlington, pp. 313–325
Alzate, M.E., Muñoz, R., Rogalla, F., Fdz-Polanco, F., Pérez-Elvira, S.I., 2012.
Biochemical methane potential of microalgae: Influence of substrate to inoculum
ratio, biomass concentration and pretreatment. Bioresour. Technol. 123, 488–494.
Kalyuzhnyi, S., Jenicek, P., Van Lier, J.B., 2009. Defining the biomethane potential
(BMP) of solid organic wastes and energy crops: A proposed protocol for batch
assays. Water Sci. Technol. 59, 927–934.
APHA, Water Environment, APHA, 2005. Standard Methods for the Examination of
Water and Wastewater Part 1000 Standard Methods for the Examination of Water
and Wastewater.
Bolado-Rodríguez, S., Toquero, C., Martín-Juárez, J., Travaini, R., García-Encina, P.A.,
2016. Effect of thermal, acid, alkaline and alkaline-peroxide pretreatments on the
biochemical methane potential and kinetics of the anaerobic digestion of wheat
straw and sugarcane bagasse. Bioresour. Technol. 201, 182–190.
Reglamento CE 2003/2003. Diario Oficial de la Unión Europea, Luxemburgo, 13
Octubre 2003.
González López, C.V., Cerón García M.C., Acién Fernández F.G., Segovia Bustos C.,
Chisti Y., Fernández Sevilla J.M., 2010. Protein measurements of microalgal and
cyanobacterial biomass. Bioresour. Technol. 101, 7587–7591.
Gruber-brunhumer, M.R., Jerney, J., Zohar, E., Nussbaumer, M., Hieger, C.,
Bochmann, G., 2015. Acutodesmus obliquus as a benchmark strain for evaluating
methane production from microalgae: Influence of different storage and
pretreatment methods on biogas yield. Algal Research, 12, 230–238.
Jankowska, E., Sahu, A.K., Oleskowicz-Popiel, P., 2017. Biogas from microalgae:
Review on microalgae’s cultivation, harvesting and pretreatment for anaerobic
digestion. Renew. Sustain. Energy Rev. 75, 692–709.
Kavitha, S., Subbulakshmi, P., Rajesh Banu, J., Gobi, M., Tae Yeom, I., 2017a.
bacterial pretreatment. Bioresour. Technol. 233, 34–43.
Kavitha, S., Yukesh Kannah, R., Rajesh Banu, J., Kaliappan, S., Johnson, M., 2017b.
Biological disintegration of microalgae for biomethane recovery-prediction of
biodegradability and computation of energy balance. Bioresour. Technol. 244,
1367–1375.
Klassen, V., Blifernez-Klassen, O., Wobbe, L., Schlüter, A., Kruse, O., Mussgnug, J.H.,
2016. Efficiency and biotechnological aspects of biogas production from microalgal
substrates. J. Biotechnol. 234, 7–26.
Lay, J.J., Li, Y.Y., Noike, T., 1996. Effect of Moisture Content and Chemical Nature on
Methane Fermentation Characteristics of Municipal Solid Wastes. J. Environ. Syst.
and Eng. 552, 101–108.
Marcos, M., García-Cubero, M.T., González-Benito, G., Coca, M., Bolado, S., Lucas,
S., 2013. Optimization of the enzymatic hydrolysis conditions of steam-exploded
wheat straw for maximum glucose and xylose recovery. J. Chem. Technol.
Biotechnol. 88, 237–246.
Martín Juárez, J., Lorenzo Hernando, A., Muñoz Torre, R., Blanco Lanza, S., Bolado
Rodríguez, S., 2016. Saccharification of microalgae biomass obtained from
wastewater treatment by enzymatic hydrolysis. Effect of alkaline-peroxide
pretreatment. Bioresour. Technol. 218, 265–271.
Molinuevo-Salces, B., Mahdy, A., Ballesteros, M., González-Fernández, C., 2016.
From piggery wastewater nutrients to biogas: Microalgae biomass revalorization
through anaerobic digestion. Renew. Energy 96, 1103–1110.
Murphy, J.D., Drosg, B., Allen, E., Jerney, J., Xia, A., Herrmann, C., 2015. A
Mussgnug, J.H., Klassen, V., Schlüter, A., Kruse, O., 2010. Microalgae as substrates for
fermentative biogas production in a combined biorefinery concept. J. Biotechnol.
150, 51–56.
Passos, F., Carretero, J., Ferrer, I., 2015. Comparing pretreatment methods for
improving microalgae anaerobic digestion: Thermal, hydrothermal, microwave and
ultrasound. Chem. Eng. J. 279, 667–672.
Passos, F., Felix, L., Rocha, H., Pereira, J. de O., de Aquino, S., 2016a. Reuse of
microalgae grown in full-scale wastewater treatment ponds: Thermochemical
pretreatment and biogas production. Bioresour. Technol. 209, 305–312.
Passos, F., Federal, U., Preto, O., Brockmann, D., Transfert, I., 2016b. Microalgae
production in wastewater treatment systems , anaerobic digestion and modelling
using ADM1. Algal Research, 10, 55–63.
Posadas, E., Serejo, M.L., Blanco, S., Pérez, R., García-Encina, P.A., Muñoz, R., 2015.
Minimization of biomethane oxygen concentration during biogas upgrading in algal
– bacterial photobioreactors. Algal Research, 12, 221–229.
Postma, P.R., Suarez-Garcia, E., Safi, C., Olivieri, G., Olivieri, G., Wijffels, R.H.,
Wijffels, R.H., 2017. Energy efficient bead milling of microalgae: Effect of bead
size on disintegration and release of proteins and carbohydrates. Bioresour.
Technol. 224, 670–679.
Sournia, A., 1978. Phytoplankton Manual, Unesco, United Kingdom.
Toquero, C., Bolado, S., 2014. Effect of four pretreatments on enzymatic hydrolysis and
ethanol fermentation of wheat straw. Influence of inhibitors and washing.
Bioresour. Technol. 157, 68–76.
Algal Biomas. NREL/TP-5100-60956.
Van Wychen, S., Laurens, L.M.L., 2015b. Determination of Total Carbohydrates in
Figure Captions
Figure 1. Percentage of volatile solids retained in the solid fractions with respect to the
initial content of volatile solids.
Figure 2. Experimental results and fitting curves of cumulative methane production: (a)
untreated and whole pretreated fraction of microalgae biomass (Test 1) and (b)
untreated and solid pretreated fraction of microalgae biomass (Test 2). A: bead mill 5
minutes; B: bead mill 60 minutes; C: NaOH 0.5M; D: NaOH 2M.
Figure 3. Experimental results and fitting curves of cumulative methane production: (a)
untreated and whole pretreated fraction of microalgae biomass (Test 1) and (b)
untreated and solid pretreated fraction of microalgae biomass (Test 2). E: steam
explosion 130ºC; F: steam explosion 170ºC; G: H2O2 0.5%; H: H2O2 7.5%.
Figure 4. Experimental results and fitting curves of cumulative methane production: (a)
untreated and whole pretreated fraction of microalgae biomass (Test 1) and (b)
untreated and solid pretreated fraction of microalgae biomass (Test 2). I: ultrasound 5
Tables
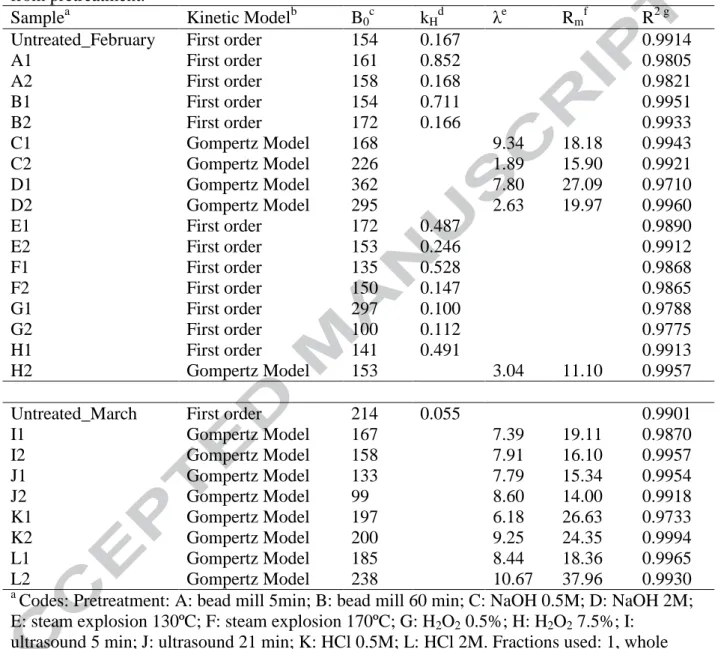
Table 1. Kinetic model and parameters of fitting equations of cumulative methane production from untreated and pretreated microalgae biomass using whole suspension and solid fractions from pretreatment.
Samplea Kinetic Modelb B0c kHd λe Rmf R2 g
Untreated_February First order 154 0.167 0.9914
A1 First order 161 0.852 0.9805
A2 First order 158 0.168 0.9821
B1 First order 154 0.711 0.9951
B2 First order 172 0.166 0.9933
C1 Gompertz Model 168 9.34 18.18 0.9943
C2 Gompertz Model 226 1.89 15.90 0.9921
D1 Gompertz Model 362 7.80 27.09 0.9710
D2 Gompertz Model 295 2.63 19.97 0.9960
E1 First order 172 0.487 0.9890
E2 First order 153 0.246 0.9912
F1 First order 135 0.528 0.9868
F2 First order 150 0.147 0.9865
G1 First order 297 0.100 0.9788
G2 First order 100 0.112 0.9775
H1 First order 141 0.491 0.9913
H2 Gompertz Model 153 3.04 11.10 0.9957
Untreated_March First order 214 0.055 0.9901
I1 Gompertz Model 167 7.39 19.11 0.9870
I2 Gompertz Model 158 7.91 16.10 0.9957
J1 Gompertz Model 133 7.79 15.34 0.9954
J2 Gompertz Model 99 8.60 14.00 0.9918
K1 Gompertz Model 197 6.18 26.63 0.9733
K2 Gompertz Model 200 9.25 24.35 0.9994
L1 Gompertz Model 185 8.44 18.36 0.9965
L2 Gompertz Model 238 10.67 37.96 0.9930
a
Codes: Pretreatment: A: bead mill 5min; B: bead mill 60 min; C: NaOH 0.5M; D: NaOH 2M; E: steam explosion 130ºC; F: steam explosion 170ºC; G: H2O2 0.5%; H: H2O2 7.5%; I:
ultrasound 5 min; J: ultrasound 21 min; K: HCl 0.5M; L: HCl 2M.Fractions used: 1, whole slurry and 2, solid fraction.
b
B0: methane production potential (mL CH4·g VS-1). (Equations 3 and 4). c
kH: hydrolysis coefficient in the first order kinetic model (d-1). (Equation 3). d λ: lag time (d). (Equation 4).
e
Rm: maximum biogas production rate in the Gompertz model (mL CH4·g VS-1·d-1). (Equation
4).
f
Table 2. Main parameters analyzed for the characterization as a fertilizer of anaerobic digestate of untreated and selected pretreated algal biomasses
Untreated_February C2 D1 D2 G1 Untreated_March K1 K2 L1 L2
ST 1.090 1.232 1.453 2.504 1.423 1.824 1.931 1.843 2.048 2.366
SVa 51.656 46.541 36.619 23.695 45.566 40.185 34.147 33.900 35.800 23.732
Ca 34.260 21.270 17.670 10.180 19.260 21.100 21.890 17.220 19.100 14.720
Na 7.500 2.640 1.870 1.360 2.470 2.420 2.120 1.800 1.710 1.520
Pa 4.105 4.091 3.765 2.155 3.470 2.177 1.749 2.167 1.669 1.772
Sa 1.705 1.383 1.348 0.801 1.284 1.073 0.958 1.060 0.935 0.841
Hga 0.000 0.000 0.000 0.000 0.000 0.000 0.000 0.000 0.000 0.000
Ala 1.041 0.817 0.762 0.375 0.691 0.547 0.512 0.623 0.519 0.517
Asa 0.001 0.001 0.001 0.001 0.001 0.001 0.001 0.001 0.001 0.001
Caa 5.018 5.252 6.036 2.229 4.830 10.079 9.754 9.677 9.457 9.854
Cra 0.003 0.003 0.003 0.001 0.002 0.002 0.002 0.002 0.002 0.002
Cua 0.020 0.024 0.032 0.014 0.020 0.013 0.017 0.013 0.011 0.010
Fea 2.399 1.783 1.626 0.824 1.532 1.219 1.057 1.280 1.065 1.090
Ka 3.013 2.308 1.643 1.387 2.489 1.267 0.912 1.139 0.836 0.936
Mga 1.156 0.987 0.939 0.433 0.923 0.461 0.367 0.642 0.384 0.495
Mna 0.023 0.049 0.064 0.022 0.032 0.000 0.000 0.000 0.000 0.000
Nia 0.006 0.005 0.005 0.002 0.004 0.003 0.003 0.003 0.003 0.003
Pba 0.005 0.004 0.004 0.002 0.003 0.003 0.003 0.003 0.003 0.003
Zna 0.248 0.246 0.362 0.144 0.237 0.169 0.104 0.179 0.118 0.141
Salmonellab Absence Absence Absence Absence Absence Absence Absence Absence Absence Absence
E.colic <1 <1 <1 <1 <1 1.10E+05 1.00E+05 9.10E+04 <1 1.30E+03
a
: percentage in dry weight (g*100/g dried)
b
: 25g. Limit: absence
c
Figure 2
(a)
Figure 3
(a)
Figure 4
(a)