Perú
Facultad de Ciencias e Ingeniería
Investigating the potential of magnetic
arc oscillated GMAW-Welding for hard
surfacing applications
M
aster
T
hesis
Student
Falk Nagel (B. Sc.)
Matriculation number201245257
Due dateMonday 22
ndApril, 2013
Supervised byProf. Dr.-Ing habil. Jean Pierre Bergmann
Dipl. Ing. Karsten Gunther
Dr. Francisco Rumiche
Selbstständigkeitserklärung
Ich versichern hiermit, dass ich die vorliegende Arbeit selbständig und ohne Be-nutzung anderer als der angegebenen Hilfsmittel angefertigt haben. Alle Stellen, die wörtlich oder sinngemäß aus veröffentlichten und nicht veröffentlichten Schriften an-derer entnommen sind, sind als solche kenntlich gemacht. Die Arbeit ist in gleicher oder ähnlicher Form noch nicht als Prüfungsarbeit eingereicht worden. Ich habe die Hinweise für das Anfertigen wissenschaftlicher Arbeiten zur Kenntnis genommen.
Ilmenau, den 22. April 2013
Kurzfassung
Das Metallschutzgasschweißen mit Fülldrahtelektrode ist ein in der Industrie ver-breitetes Verfahren zur Herstellung von Hartpanzerungen. Charakteristisch ist die gezielte Beeinflussung des Schweißprozesses und der chemischen Zusammensetzung des Schweißguts durch die Auswahl der Füllstoffe. Des Weiteren können dem Fülldraht Stoffe hinzugegeben werden, wodurch das Schweißen ohne Schutzgas durchgeführt werden kann. Nachteilig ist jedoch der hohe Aufmischungsgrad bei diesem Verfahren. Eine Möglichkeit, diesem Effekt entgegenzuwirken, besteht darin, den Lichtbogen durch das Anlegen eines Magnetfelds in eine oszillierende Bewegung zu versetzen.
Abstarct
The flux cored arc welding process has some characteristic features and is therefore established in the industry to fabricate hardfacing. One advantage of the process is the possibility to vary the alloy content of the weld metal by manipulating the chemical composition of the filler material. Moreover, it is possible to produce self shielding electrodes, which show advantages for outdoor applications. One the other hand this process creates high dilution rates. One possibility to avoid this effect is to apply a magnetic field in order to deflect the welding arc.
Contents
1 Motivation 1
2 State of the art 2
2.1 Wear . . . 2
2.2 Hardfacing materials . . . 3
2.3 Deposition welding . . . 4
2.4 Flux cored arc welding . . . 8
2.4.1 Characteristics of the power source . . . 9
2.4.2 Electrodes . . . 9
2.4.3 Arc characteristics . . . 11
2.4.3.1 Acting forces on the arc and metal droplets . . . 13
2.4.3.2 Metal transfer . . . 13
2.4.4 Shielding gas . . . 16
2.5 Influence of oscillation on the weld . . . 18
2.5.1 Generation of oscillation . . . 18
2.5.1.1 Mechanical oscillation . . . 18
2.5.1.2 Magnetic oscillation . . . 20
2.5.2 Effects on the weld . . . 23
2.5.2.1 Weld pool stirring . . . 23
2.5.2.2 Oscillation . . . 24
3 Objective 27 4 Experimental procedure 28 4.1 Materials . . . 28
4.1.1 Base material . . . 28
4.1.2 Weld deposit . . . 28
4.2 Equipment . . . 29
4.2.1 Welding equipment . . . 29
4.3 Processing . . . 31
4.4 Engaged readings recorders . . . 33
4.4.1 Video capturing . . . 33
4.4.2 Welding current . . . 34
4.5 Sample characterization . . . 34
4.5.1 Metallography . . . 34
4.5.2 SEM analysis . . . 35
4.5.3 Hardness . . . 35
5 Results and discussion 36 5.1 Magnetic circuit . . . 36
5.2 Welding results . . . 37
5.2.1 Short circuit . . . 37
5.2.1.1 Material transfer characteristics . . . 37
5.2.1.2 Weld seam appearance . . . 40
5.2.1.3 Metallography . . . 43
5.2.1.4 SEM analysis . . . 44
5.2.1.5 Hardness . . . 44
5.2.2 Pulsed transfer mode . . . 47
5.2.2.1 Material transfer characteristics . . . 47
5.2.2.2 Weld seam appearance . . . 51
5.2.2.3 Metallography . . . 53
5.2.2.4 SEM analysis . . . 55
5.2.2.5 Hardness . . . 56
5.2.3 Spray mode . . . 56
5.2.3.1 Material transfer characteristics . . . 56
5.2.3.2 Weld bead appearance . . . 57
5.3 Error consideration . . . 60
6 Summary 61
7 Outlook 62
List of Tables LXVIII
List of Figures LXXI
1 Motivation
According to the german association for tribology [Ges], the costs of friction and wear can amount 5 % of the gross domestic product per year for industrial countries. Regarding Germany for example, it values 35 billion Euro per year. By analyzing and optimizing the tribological system, 5 billion Euro can be saved according to this association.
Hardfacing by deposition welding is one possibility to increase the lifetime and reli-ability of a product. Standard processes are gas metal arc welding (GMAW), plasma transformed arc welding (PTA) and others. In order to coat great areas, these processes have already been established in the industry. Characteristic features of PTA are the high deposition rate and the low dilution. Restrictions have to be made due to the complexity and the production costs. GMAW shows advantages like lower production costs, simplicity and good deposition rates. Due to the use of flux cored electrodes, the chemical composition of the weld can be influenced positively. Nevertheless, the dilution reaches values up to 30 %.
2 State of the art
2.1 Wear
Wear can be defined as the continuos loss of material of a solid body, resulting from mechanical burden. It can be superimposed by corrosion. The main actors are surface spallation, adhesion, abrasion and tribochemical reactions [Sch10].
Wear and friction are considered, where surfaces interact in an ambient medium under burden and relative movement [WD11]. This fact is illustrated schematically in figure 2.1.
The point of this reflection is, that wear and friction are no material properties, instead they are caused by the interaction of different materials, lubricants, forces, velocities and environment influences (see [WD11]).
Figure 2.1: Schematic illustration of the tribological system (see [WD11])
• reduce friction and increase efficiency,
• minimize wear and increase lifetime and liability,
• decrease consumption of lubricant and thus reduce maintenance costs and
• use regenerated design of wear parts in order to reduce maintenance costs.
2.2 Hardfacing materials
For conventional hardfacing applications, materials like steel, low-alloy ferrous materi-als, chromium white irons, high-alloy ferrous materimateri-als, carbides, nickel- or cobalt-based alloys are used. From the metallurgical point of view, hardfacing alloys consist of hard phase precipitates such as borides, carbides, or intermetallics bound in a softer iron-, nickel-, or cobalt-based alloy [AO93]. Furthermore multi-component systems like tungsten carbide and Fe-Cr-V-C have to be named in context of hardfacing materials. The wear resistance of the deposit strongly depends on the hardness of the hard parti-cles, their volumetric content, as well as their size and distribution within the matrix [Geb98].
Iron-based alloys can be divided into pearlitic- , austenitic- , martensitic steels and high-alloy irons. The last mentioned generally contain a large amount of chromium and/or molybdenum carbides usually within a martensitic matrix. The carbon content ranges from 2 % to 6 %, providing large amounts of carbides [AO93].
The most important microstructural feature in the high-chromium irons, at least from a wear point of view, is the M7C3carbide, which forms in abundance during solidification and contains chromium, iron, and (if present) molybdenum. The matrix around these carbide particles can be austenitic, pearlitic, or martensitic [AC52]. In general, the austenitic alloys rely on manganese for austenite stability [AO93].
At high carbon and chromium levels the formation of a hypereutectic microstructure, containing large, spinelike carbide particles (with a hexagonal cross section), is favored. At lower carbon and chromium contents, the microstructure is hypoeutectic [AO93].
2.3 Deposition welding
To protect the workpiece surface against abrasion, impact, erosion, galling and cavita-tion, coatings are used. In general, coatings can be classified according to DIN 8580, which is illustrated in figure 2.2. In order to realize the design rule "functional material at the point of function" [Kra00], hardening processes like ion implantation, nitriding, flame hardening, welding or spraying are available.
Figure 2.2: Designations of main group 5 of the norm DIN 8580 [DIN03]
Deposition welding is used to maintain workpieces as well as add functionality to a compound. The term hardfacing is used for certain processes, that increase the workpiece wear resistance. When enhancing chemical resistance, the term cladding is used. Adding a layer to combine nonsimilar materials is called buffering. The economical benefits of hardfacing are [AO83]:
• increased productivity by less downtime for repair,
• enhanced efficiency by permitting higher applied loads,
• reduced maintenance costs due to reclamation of worn parts and
• optimum combination of wear and toughness by the use of less expensive and tougher material.
The following major deposition welding processes will be introduced briefly and the key figures are summarized in table A.1:
Electroslag welding
keeps it molten. The generated heat is sufficient to fuse the welding electrode and the surface of the workpiece. The temperature of the bath is approximately 2000◦C and the surface temperature is about 1650◦C [Ame91].
Submerged arc welding
An arc burns between a continuously fed wire and the workpiece. Thus, arc and molten metal are submerged in a granular flux, which protects them from the environment. The flux influences the stability of the arc as well as mechanical and chemical properties of the weld [Ame91].
Laser deposition welding
Under specific parameters the laser beam melts filler and base material up to a penetra-tion of 0.3 mm. Mostly, the filler material is added in form of powder, but solid wires are used as well. Diode laser systems are used commonly [FSTW11].
Plasma arc welding
Plasma arc welding (PAW) is an extension of gas tungsten arc welding (GTAW). It is described as "an arc welding process that produces coalescence of metals by heating them with a constricted arc between an electrode and the workpiece (transferred arc) or between the electrode and the constricting nozzle (nontransferred arc)" [Ame91]. Filler materials are added as powder or pre-heated wire.
Table 2.1: Summary of important deposition welding processes [Teu02]
Electroslag welding (ESW)
• width of the strip electrode up to 180 mm
• rate of deposition up to 20 kg/h
• area efficiency up to 0.5 m2/h
• dilution rate from 8 % to 10 %
Submerged arc welding (SAW)
• strip or round electrodes (solid or tubular)
• width of strip electrodes up to 200 mm
• deposition rate from 10 kg/h to 40 kg/h
• area efficiency from 0.3 m2/h to 0.9 m2/h
• dilution rate from 13 % to 40 %
• layer thickness from 5 mm to 8 mm
• only downhand position
Laser welding
• wire or powder filler material
• deposition rate from 1 kg/h to 2 kg/h
• dilution rate from 13 % to 40 %
• layer thickness from 0.2 mm to 2 mm
• low efficiency
Powder plasma welding
• deposition rate from 6 kg/h to 25 kg/h
• dilution rates from 5 % to 10 %
• layer thickness from 0.5 mm to 6 mm
Hot wire plasma welding
• deposition rate from 10 kg/h to 30 kg/h
• dilution rate from 5 % to 30 %
• layer thickness from 2 mm to 5 mm
Gas metal arc welding (GMAW)
• protective gas (inert or active)
• deposition rate up to 15 kg/h
• area efficiency up to 0.3 m2/h
• dilution rates from 13 % to 30 %
• layer thickness from 2 mm to 8 mm
• high heat input
2.4 Flux cored arc welding
Flux cored arc welding (FCAW), also known as MIG welding with flux cored electrode, combines characteristics of gas metal arc welding (GMAW), shielded metal arc welding (SMAW) and submerged arc welding (SAW) namely the following:
• the productivity of continuous wire welding,
• the metallurgical benefits that can be derived from a flux and
• a slag that supports and shapes the weld bead.
FCAW is an arc welding process, where the arc burns between the continuous fed filler wire and the workpiece. In general, it can be divided into two types: gas-shielded and self-shielded type. The first one is illustrated in figure 2.3 and the second in figure 2.4. Usually, carbon dioxide or mixtures of argon and carbon dioxide are used to protect the weld from the atmosphere. For the self-shielding method, the protection is realized by the vaporized flux ingredient which produces carbon dioxide [ Ame91]. Therefore, the shielded method can be assigned to GMAW and the self-shielding type to open arc welding.
Figure 2.3: Scheme of shielded FCAW [DIN05]
Figure 2.4: Scheme of self-shielded FCAW [DIN05]
expensive compared to solid wires on weight basis. The application also produces hazardous smoke and fumes.
2.4.1 Characteristics of the power source
For GMAW and FCAW, constant voltage power supplies are used. As it can be seen in figure 2.5, the characteristic curve is nearly constant or slightly descending. The characteristic curves of different arc lengths are also diagrammed in the figure. A decrease of the arc length results in a large change of the welding current, which causes more heat input into the wire. More material can be molten leading to a decrease of the arc length until the process is stable. There is no inertia, which causes the internal regulation to be very fast.
Characteristic lines of the arc length
U I U0 ∆I ∆U Short arc lenght Long arc lenght
Characteristic line of the power source
Figure 2.5: Characteristics of arc length and the power supply
2.4.2 Electrodes
The wire is made from alloy steel or low carbon steel filled with dry powder of flux and/or alloying material. The composition can vary depending on the standards and the manufacturer of the electrode. Examples are given in table 2.2. Because of the selection of the ingredients for core and sheath, the following possibilities can be realized (see [Ame91]):
• produce welding characteristics ranging from high deposition rates in the flat position to proper fusion and bead shape in the overhead position.
• vary alloy content of the weld metal from mild steel for certain electrodes to high alloy stainless steel for others.
Table 2.2: Standards for Tubular cored electrodes
Standard Designation
DIN EN ISO 12153 Electrodes for gas shielded and non-gas shielded metal arc weld-ing of nickel and nickel alloys
DIN EN ISO 17632 Electrodes for gas shielded and non-gas shielded metal arc weld-ing of non-alloy and fine grain steels
DIN EN ISO 17633 Electrodes and rods for gas shielded and non-gas shielded metal arc welding of stainless and heat-resisting steels
DIN EN ISO 17634 Electrodes for gas shielded metal arc welding of creep-resisting steels
DIN EN ISO 18276 Tubular cored electrodes for gas-shielded and non-gas-shielded metal arc welding of high strength steels
Electrodes for FCAW can be divided into three categories: basic, rutile and metal cored wires. Basic and rutile wires induce slag, whereas metal cored wires do not result in slag. Therefore, the mechanical and chemical properties of the weld seam are mainly influenced by the type of powder of the flux core wire (see [FSTW11]).
According to [Ame91], the functions of the components are:
• act as deoxidizers or scavengers to help purify the metal and produce a sound deposit,
• form slag to float on the molten weld metal and protect it from the atmosphere during solidification,
• act as arc stabilizers to produce a smooth welding arc and reduce weld spatter,
• add alloying elements to the weld metal to increase weld strength and to provide other required meld-metal properties,
• provide shielding gas.
Good weldability and possibility to weld out of position with a high productivity are some of the key features of rutile electrodes. The wire produces a more fluid slag, that solidifies at a lower temperature. Therefore, the weld bead becomes flat and the surface is bright and smooth.
Metal cored wires do not form slag like rutile and basic ones. The deposit efficiency ranges between 95 % and 96 % and for rutile and basic wires between 82 % and 88 %.
A list of common used elements, their sources and their purpose is presented in table 2.3. Deoxidizers like silicon and manganese are added to counteract the burn of alloying elements (Cr, Al, V, Mn, Si) due to oxidation. Aluminum reacts with nitrogen to form stable nitrides and prevents the formation of porosity [Ame91].
Because of the smaller conducting cross sectional area, tubular wires show a higher resistance than solid wires. This also leads to an increased preheating of the electrode extension and deposition rate. Smoke emission and spatter are disadvantages of this process [Dil06].
2.4.3 Arc characteristics
Figure 2.6: Flux of the current within the arc
Basically, an electric arc is a discharge between two electrodes in gas through ioniza-tion of the gas molecules. In general, the gas has a very low electrical conductivity [FSTW11].
Table 2.3: Common core elements in flux cored electrodes [Ame91]
Element Standard Designation
Aluminum Metal powder Deoxidize and denitrify Calcium Minerals such as fluorspar
(CaF2) and limestone
(CaCO3)
Provide shielding and form slag
Carbon Element in ferroalloys such as ferromanganese
Increase hardness and strength
Chromium Ferroalloy or metal pow-der
Alloy to improve creep resistance, hardness, strength and corrosion
Iron Ferroalloys and iron pow-der
Alloy matrix in iron base deposits, alloy in nickel base and other nonferrous deposits
Manganese Ferroalloy such as ferro-manganese or as metal powder
Deoxidize; prevent hot shortness by combining with sulfur to form MnS; increase hardness and strength; form slag
Molybdenum Ferroalloy Alloying to increase hardness strength, and in austenitic stainless steels to increase resistance to pitting-type corrosion
Nickel Metal Powder Alloying to improve hardness, strength, toughness and corrosion resistance
Silicon Ferroalloy such as ferro-silicon or silicomanganese; mineral silicates such as feldspar
Deoxidize and form slag
Sodium Minerals such as sodium-bearing feldspars and sili-cates in frits
Stabilize the arc and form slag
Titanium Ferroalloy such as ferroti-tanium; in mineral, rutile
Deoxidize and denitrify; form slag; stabilize car-bon in some stainless steels
Zirconium Oxide or metal powder Deoxidize and denitrify, form slag
easily and transform energy. During the collision with other molecules, they can knock out other electrons and thus form ions and electrons. The electrons move to the anode and the positive charged ions move to the cathode. This fact is illustrated in figure 2.6. In this case the electrical conductor is plasma [FSTW11].
2.4.3.1 Acting forces on the arc and metal droplets
Every current-carrying conductor is surrounded by a circular magnetic field. This field produces a radial force, which is orientated towards the center, namely the Lorentz force. This force tries to pinch the electrical conductor [Dil06]. The other forces are the gravity and the drag force from the plasma jet. Moreover the surface tension and the repelled force of the evaporating material have to be considered as well.
Force of gravity
Electromagnetic force FL
Pincheffect Surface tension Electrostatical forces Wire Viscosity Pinched droplet Inertial force Repelled forces of the evaporating material
Suction trough plasma current Base material
Figure 2.7: Forces acting on the droplet [Dil06]
2.4.3.2 Metal transfer
Below, a classification of the transfer modes is presented according to Iordachescu et al. [IQ08], which is similar to that of the International Insitute of Welding classification. An overview is given in figure 2.8. Short circuiting, spray and pulsed transfer mode are used mainly for GMAW while short circuiting and globular mode are used for FCAW. Spray transfer mode can also be applied, but is only considered as an "almost true spray mode" and strongly depends on the current and composition of the flux [BOC07].
Short circuiting arc
Figure 2.8: Transfer modes in an I−U- Diagram [IQ08]
(a) (b) (c) (d) (e)
(f)
Figure 2.9: Arc transfer modes according to [IQ08]: (a) Short Circuit, (b) Globular Drop, (c) Globular Repelled, (d) Drop Spray, (e) Streaming, (f) Rotating
resulting in a short circuit as shown in figure 2.9a. The tail of the droplet will be constricted by the Lorentz force. It forms a gap of ionized metal vapor and a new arc can ignite [Dil06, WL06].
Globular arc
Bigger droplets than the diameter of the electrode of molten metal are distinctive for this mode (see figure 2.9b). According to Iordachescu et al. [IQ08], an increase of the welding current results in globular repelled transfer mode, which is characteristic for the use of CO2 in GMAW. The molten drop is rejected upwards (see figure 2.9c) resulting in spatter. For both transfer modes, gravity force is the principal factor for drop detachment.
Drop spray
Above a certain welding current and high voltages, the transfer mode can be character-ized as short-circuit-free and fine droplet detachment (see figure 2.9d). The heat input and the deposition rate are high. The magnetic force contributes the wire and therefore supports the drop release. Pure Argon or a gas mixture of argon and maximum 25 % of CO2 or a few percent of O2, has to be used.
Streaming and rotating
The drops become smaller and more frequent like a shower, which is shown in figure 2.9e, at increased current. At high values, the stream starts to rotate (see figure 2.9f). According to Dilthey [Dil06], this phenomenon requires welding currents above 400 A and wire feeding rates between 20 m/min and 40 m/min. The deposition rate can be enhanced in comparison to conventional GMAW. When using high welding currents and long, free wire ends, resistance heating of the wire occurs and results in softening of the wire. Because of the high arc pressure the droplet detachment takes place in form of a rotating movement. The weld bead is extended and flat. Because of the high heat input, this transfer mode is used for heavy machine industry.
Pulsed arc
Figure 2.10: Pulsed GMAW current according to Wemann [WL06]
2.4.4 Shielding gas
Shielding gases are divided as: • inert
– argon,
– helium,
• active
– carbon dioxide,
– oxygen,
– and nitrogen.
Their function is to protect the weld bead, the electrode and the arc from atmo-spheric gases. Moreover, it influences the property of ignition, stability and form of the arc. Gases with low ionization potential facilitate the ignition of the electric arc and those with low thermal conductivity tend to increase the arc stability. Furthermore, it affects the chemical composition and the penetration of the bead and can improve the welding performance (see [FSTW11]). Shielding gases are standardized by DIN EN 439.
Inert gases are used for welding of non-ferrous metals like aluminum, magnesium, titanium and copper. As well, the gases are used for consumable electrodes to avoid the burn of expensive alloying elements. Because of the full outer shell, these noble gases have very low tendency to participate in chemical reactions. Argon has a higher density in comparison to helium and has therefore a better protective effect. Besides argon is cheaper and has a better ignitability. On the other hand, helium results in a hotter arc, higher travel speed and deeper penetration (see [FSTW11, Dil06]).
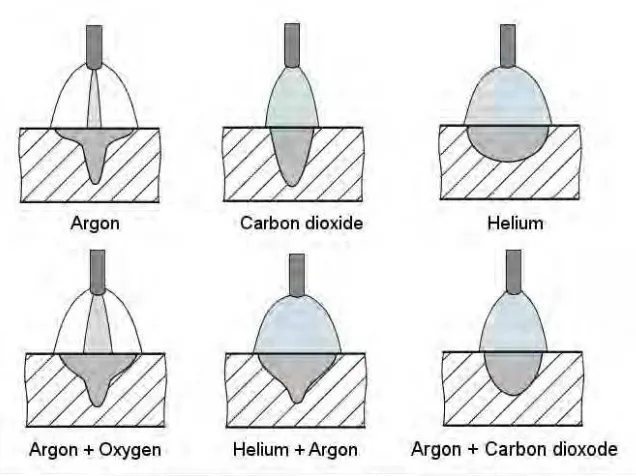
conductivity, which produces a radial uniform heat distribution. The weld seam is wider and shows less penetration. Carbon dioxide produces a deep weld bead contour. The influence of the shielding gas of the weld bead contour is presented in figure 2.11.
Figure 2.11: Schematic illustration of the influence of shielding gases of the weld bead formation [Sch10]
Carbon dioxide is a common shielding gas and for FCAW the is most widely used. Under room temperature it is inactive but under high temperature CO2dissociates to carbon monoxide and oxygen which can be seen in equation 2.1.
2 CO2 −↽⇀−2 CO+O
2 (2.1)
The oxygen reacts with the molten metal and hence deoxidizing materials are added to the core of the electrode. Furthermore the molten iron reacts with CO2producing iron oxide and carbon monoxide (see equation 2.2).
Fe+CO2 −↽⇀−FeO+CO (2.2)
At red heat temperatures carbon dioxide dissociates to carbon and oxygen, which can be seen in the following equation.
2 CO−↽⇀−2 C+O
Depending on the carbon concentration of the base material, this gas can lead to a carburization or decarburiszation. The AWS Handbook [Ame91] names carbon content below 0.05 % of the weld metal when carburization takes place. Above a concentration of 0.1 % the molten weld pool may lose carbon. This is due to the formation of carbon monoxide, because of the oxidizing character of carbon dioxide at high temperatures. Carbon monoxide can cause porosity and therefore deoxidizing materials are added to the core. Oxygen will react with those elements rather than with carbon in steel resulting in solid oxide compounds, which form slag (see [Ame91]). Furthermore, carbon dioxide and oxygen react with the metal and result in metal oxide. These oxides have a lower ionization energy compared to metals und because of that, the electrical conductivity of the arc is better. With high ionization potential, higher voltage is needed, which causes a higher heat input. Because of that, the viscosity is lower and a better degassing can take place. Moreover the surface tension is reduced (see [FSTW11])
According to the Welding Handbook [Ame91], the widely used gas shielding composi-tion consists of 75 % argon and 25 % carbon dioxide. The mixture allows higher tensile and yield strength in comparison to 100 % carbon dioxide shielding gas. Spray transfer mode, out of position welding, greater operator appeal and better arc characteristics can be realized. But the operator has to follow the recommendations of the manufacturer, if the electrodes can be work with such a gas mixture.
2.5 Influence of oscillation on the weld
2.5.1 Generation of oscillation
2.5.1.1 Mechanical oscillation
A frequency up to 40 Hz was achieved by Kodama [KGKI01] using a magnetic me-chanical system. The torch is ratably mounted at the end and a magnetic actuator is installed at the half way. An illustration of the torch can be seen in figure 2.12 and the results of the investigation can be observed in figure 2.13. By using this mechanical
Figure 2.12: Schematic illustration of oscillating torch
Figure 2.13: Relationship between oscillation frequency and penetration depth and bead width in bead-on-plate welding [KGKI01]
2.5.1.2 Magnetic oscillation
The arc can be deflected away from the normal arc path by an external magnetic field through the Lorentz force. The Force F acts on a particle, which can be electrons or ions, through an external magnetic field B. This particle has an electric chargeq and instantaneous velocityv. The Lorentz force can be calculated according to the following equation:
~F =q·(~v×~B) (2.4)
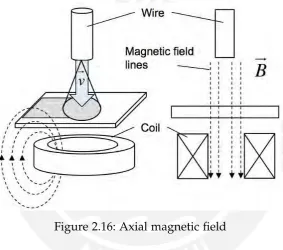
The deflection can be made sideways, backwards or forward depending on the direction of the magnetic field. A transverse magnetic field (TMF) deflects the arc in the welding direction, which is also called longitudinal magnetic oscillation (LMO). Whereas a longitudinal magnetic field (LMF) deflects the arc orthogonal to weld seam. Therefore it is called transversal magnetic oscillation (TMO). Theses mostly used applications are illustrated in figure 2.14 and figure 2.15. Figure 2.16 shows the installation in order to realize an axial magnetic field.
Two companies offer several systems on the world market ranging from simple one pole, two pole and four pole water cooled system realizing 60 mT. They can be mounted to GMAW and GTAW torches. By using 4 pole systems, circular movements can be made and the diameter of the plasma can be manipulated [JS00].
The magnetic blow effect can be counteracted by a constant transverse magnetic field [Dil76].
Researchers investigated the influence of the oscillated magnetic field of the weld bead for GMAW [KN03, Raz95, Dil76], GTAW [Raz95, KN02], SAW [Raz95, Dil76] and PAW [HW85].
Parameters
Figure 2.14: Longitudinal magnetic field
[image:28.595.154.438.275.525.2]Figure 2.15: Transversal magnetic flied
Figure 2.16: Axial magnetic field
Blunt [Blu00] reduced the dilution from 40 % to 13 % and increased the width of the bead from 12 mm to 17 mm using a wire of 1.6 mm and a welding energy range from 1 kJ/mm to 1.4 kJ/mm (short circuit mode). A magnetic field of 6.5 mT and 0.7 Hz was used. A reduction of the dilution from 36 % to 20 % was measured in spray transfer mode (1.8 kJ/mm) using 4 mT and 0.7 Hz. He measured an increased weld bead width of 4 mm/T for short circuiting mode and 1.1 mm/T for spray transfer mode. An example of his results is given in figure 2.17
(a)I =220 A,U=30.8 V, no oscillation (b)I = 249 A, U = 34.3 V, f = 0.7 Hz, B =
1.3 mT
Figure 2.17: The influence of the magnetic oscillation on the weld, spray mode
Kang [KN03] shows the benefits of longitudinal magnetic field for narrow groove welding. Good penetration of the groove faces and root were achieved with 5 mT. Undercut occurred at both groove faces using 7.5 mT. The gap distance is specified with 10 mm.
For SAW, Sheinkin [She69, Raz95] achieved a weld width enhancement between 20 % to 25 %. Furthermore, the electrode melting rate was increased by 10 % to 15 % using magnetic flux density of 8 mT and a frequency of 50 Hz.
The deflection of the arc decreases with increasing welding current under constant voltage and magnetic flux density, because the arc gets stiffer [KN02]. An enhancement of the arc length by increasing the voltage leads to wider range of deflection [Dil76].
Yongbing et al. [YZG+02] show in their numerical study for GTAW using longitudinal magnetic field the rotation of the molten weld pool. The motion is not axisymmet-rical, because of the arc motion. It is also found, that maximal velocity appears at certain annular region deviating weld pool centre. The reason is, that the maximal electromagnetic force applied on weld pool also appears at the annular region.
The numerical study of Yin et al. [YGZS12] shows that the weld becomes more shallow and wider for GTAW with applied axial magnetic field. Because of the circumferential shear stress and the magnetic field, the molten weld pool rotates. The direction of the fluid rotation at the centre of the weld pool is opposite to of the outer regions, because the reverse current flow creates an opposite electromagnetic force. Experimental results from Watanabe et al. [WNE89] shows for austenitic steel GTAW radial stirring of the weld pool. The change of the magnetic field density from 0 mT to 50 mT had a slight influence on the penetration, but a considerably influence on the weld bead. The position of the torch along the travel axis in relation to the magnet was changed. The results show a maximum penetration and a minimum width when the electrode was 2 cm behind the magnet. The position of the electrode changes the appearance of the weld pool from circular to elliptical by increasing the distance. Depending on the sign of the distance, the rotation forms clock- or counterclockwise.
For pulsed GMAW, Dilthey [Dil76] mentions, that by using sufficient magnetic flux density, the arc deflects strongly during the low current phase and can extinguish. Synchronization can solve this problem by applying a magnetic field just during the high current phase. For each phase a specific deflection direction can be assigned.
A further positive effect is the reduction of porositys, because of the "stirring" of the weld pool. By welding plates with different thicknesses, the thickest plate is not fused sufficiently. The use of an offset led to sufficient heat for fusing both plates [Dil76].
2.5.2 Effects on the weld
2.5.2.1 Weld pool stirring
dendrite fragmentation. The second mentioned mechanism is the detachment of grains from partially molten regions of the HAZ.
Watanabe et al. [WNE89] concluded from his results, that dendrite fragmentation occurred, because of the reverse motion of the molten metal, which remelted dendrite arms.
2.5.2.2 Oscillation
Kou and Le [KL85] changed the microstructure of 2014 aluminum alloy for GTAW and arc oscillation. Due to the transverse oscillation at low frequencies, dendrite arm spacing was reduced significantly, which can be seen in figure 2.18. It was also observed, that the microstructure appeared more uniform with oscillation than without.
(a) No oscillation (b) Transverse oscillation, f =1 Hz, ampli-tude = 1.9 mm
Figure 2.18: Microstructure near fusion line of 2014 aluminum, 200x [Kou03]
The resulting velocity of the molten weld pool with and without oscillation is presented in figure 2.19. By using an oscillation system the velocityu is added by the component v. vis the result of amplitude and frequency. The resulting velocity wis greater than u. Because of the small distance between the heat source and the pool boundary, the temperature gradient is increased, which is valid for small amplitudes. With constant growth rate, the cooling rate increases resulting in a finer microstructure.
(a) No oscillation (b) Transverse oscillation
Figure 2.19: Resulting travel speed according to [KL85]
Figure 2.20: Influence of the amplitude of the grain size by torch vibration [Kou03, DG75]
these welds. The effect of the amplitude of torch oscillation on grain size can be seen in figure 2.20. Dendrite fragmentation was proposed as the grain refining mechanism.
Grain size reduction in the weld bead of around 60 % was achieved by Ram et al. [RMS99] for GTAW using alternating LMF for 2090 and 7020 aluminum alloys. The results from the tensile test show an enhancement for the ultimate tensile strength (from 221 MPa to 227 MPa 2090-T3 alloy, from 257 MPa to 275 MPa 7020-T6 alloy). The elongation increased from 8.9 % to 12.6 % for 2090-T3 and 6.7 % to 10.4 % for 7020-T6. The effect of grain refinement was only achieved for low frequencies, whereas a frequency of 2.5 Hz led to the best results. An amplitude of 0.6 mm was the most effective. Higher amplitudes led to undesirable arc behavior and lower amplitudes had no effect. The reason for grain refinement were assumed due to the change of weld pool shape and varying direction of maximum thermal gradient. Moreover, an enlarging of the chill zone adjacent to the fusion boundary and the generation of fine-grain bands was observed.
3 Objective
FCAW shows many advantages compared to other welding techniques like lower costs for the welding equipment, good productivity and metallurgical benefits. Due to the fact, that the chemical composition of the deposit can be influenced by the filler material, FCAW fulfills the requirements to realize hardfacing. The disadvantage of the process is the high dilution rate, which ranges from 15 % to 30 % for standard applications. It can be compensated by applying several layers of deposits.
Several investigations have shown, that the weld seam dimensions can be manipulated by magnetic arc oscillation. The penetration depth can be reduced as well as the seam can be widened, which results in economical effects. Nevertheless, investigations on the influence of a transversal magnetic field on the FCAW process have apparently not been carried out so far. Because of the similarity of this process to GMAW, the results should be similar.
The objective of this thesis is to investigate the impact of the arc deflection - realized by an longitudinal magnetic field - on the FCAW process. Therefore several working packages have to be elaborated:
• Realization and characterization of the magnetic circuit,
• Determination of the arc behavior due to the oscillation,
• Analyzation of the influence of the applied magnetic field on the weld seam appearance,
4 Experimental procedure
4.1 Materials
4.1.1 Base material
[image:35.595.157.438.344.577.2]ASTM A 36 steel was used for the experiments and the chemical composition is listed in table 4.1. The samples dimensions of 150 x 75 x 12.5 mm and were cut out of steel plate with oxy-fuel gas. The surface was machined using an angle grinder in order to remove impurities and burr.
Figure 4.1: Cross section of the wire - SEM analysis
4.1.2 Weld deposit
needed according to recommendations of the manufacturer and the stick-out should be set between 15 mm and 25 mm. The hardness of the deposit ranges between 60 HRC and 62 HRC and has a susceptibility for cold cracking. The layer shows excellent resistance against abrasion, moderate against impact, and moderate resistance against compression. This hardfacing material is used for earth moving industries, where abrasive wear caused by sand, minerals and earth occurs [Sol07].
Table 4.1: Chemical composition
C Si Mn P S Cr
Steel plate 0,18 0,19 0,67 0,021 0,028
-Deposit layer 5 1,5 1,5 - - 27
4.2 Equipment
4.2.1 Welding equipment
The power source is a "SAF Optipuls 350", which has a constant voltage characteristic. A conventional GMAW-welding gun (Profax 400 AMP) with 60° swivel goosenecks was used. Moreover, a welding tractor "Moggy GM-03-350", made by "Gullco", was used. The travel speed can be set in steps. The tractor is equipped with a permanent magnet on the bottom side.
4.2.2 Magnetic circuit
The experimental setup is given in figure 4.2. The magnetic yoke was connected to the welding tractor through an arm. The distance between the surface of a sample and the bottom side of the yoke was set to 10 mm in order to realize sufficient space between the deposit and the magnet. The distance between the two poles was limited due to the diameter of the welding gun. The magnetic field lines were parallel to the motion direction of the welding tractor in order to realize a longitudinal magnetic field. The welding gun was positioned at the center of the two poles. An illustration of this fact is given in figure 4.3.
Figure 4.2: Experimental setup Figure 4.3: Schematic illustration of the position of the yoke and welding gun
magnetic flux meter in relation to the electric current in the spool and the set frequency at the point of interest. The initial measurements were carried on an experimental setup without welding gun and base material. The schematic setup is presented ind figure 4.5.
Figure 4.4: Schematic illustration of the electrical circuit
Figure 4.5: Schematic illustration of the position of the sensor of the tesla meter
Table 4.2: Equipment for the electric circuit
Equipment Manufacture Model number Magnetic fluxmeter F.W. Bell 4048
Osciloscop Tektronix TDS 340
Amplifier TEAC A-AX 5000
Function generator Philips PM 5131 Multimeter EXTECH Instruments 380289
4.3 Processing
Two welds were deposited on each base plate. A schematic illustration of the dimensions is given in figure 4.8. Between two trails, the sample was cooled under air in order to realize similar process environments for the trails.
Figure 4.6: Dimension of the sample
The influence of the magnetic field was investigated using short circuit, pulsed and spray transfer mode. Furthermore, the influence of additional shielding gas (80 % Ar and 20 % CO2) was analyzed for pulsed mode.
The frequency was varied between 2 Hz, 5 Hz, 25 Hz and 45 Hz and the magnetic flux density between 2 mT and 6 mT. A step of 4 mT was added for pulsed mode.
Table 4.3: Welding parameters - short circuit
vwire U vtravel Stick
out angle I
[m/min] [V] [cm/min] [mm] [°] [A]
Parameter set 1 4 24.1 30 25 -3 210
Parameter set 2 5.7 24.8 30 25 -3 260
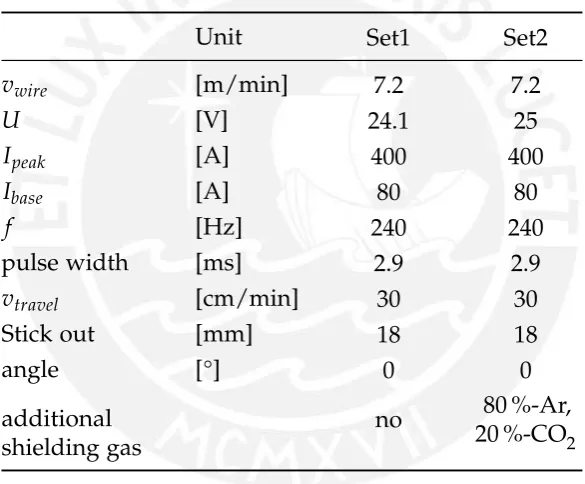
The settings of pulse mode are summarized in table 4.4. The stick out had to be reduced, because working with magnetic oscillation led to unstable arc, even for low magnetic values. In order to weld with additional shielding gas, the voltage setting was higher.
Table 4.4: Welding parameters - pulsed mode
Unit Set1 Set2
vwire [m/min] 7.2 7.2
U [V] 24.1 25
Ipeak [A] 400 400
Ibase [A] 80 80
f [Hz] 240 240
pulse width [ms] 2.9 2.9
vtravel [cm/min] 30 30
Stick out [mm] 18 18
angle [°] 0 0
additional shielding gas
no 80 %-Ar, 20 %-CO2
Table 4.5: Welding parameters - spray mode
vwire U vtravel Stick
out angle I
[m/min] [V] [cm/min] [mm] [°] [A]
9.9 36.4 36 25 0 360
4.4 Engaged readings recorders
4.4.1 Video capturing
A conventional "Panasonic Lumix G5" camera, equipped with standard H-FS014042 lens, was used in order to take videos of the arc. A welding glass (DIN 169 - 6) and a grey filter (ND 0,9) were mounted in front of the lens. The camera was set to 60 frames per second with a resolution of 1920 x 1080 pixel. It was attached to the welding car to realize a constant distance between the camera and the arc.
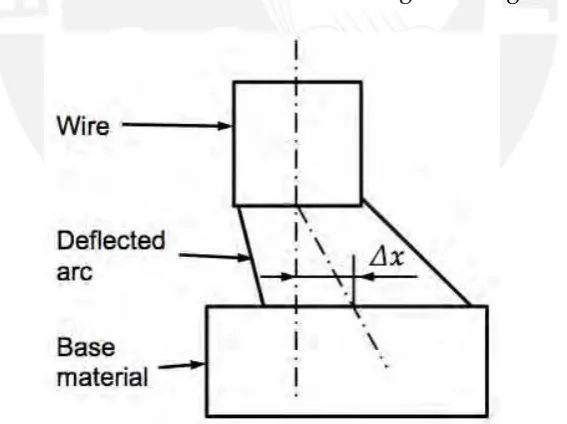
The footage was analyzed in order to determine the influence of the magnetic values on the arc deflection. Therefore, the distance∆x between the the centerline of the wire and the deflected arc was measured. An illustration is given in figure 4.7.
4.4.2 Welding current
The welding current of the pulsed mode was measured with a "Fluke i1010" AC/DC current clamp. For short circuit mode a "Fluke 80i-400" AC clamp was used. The signal was captured with a "Tektronix TDS 2002B" oscilloscope.
4.5 Sample characterization
4.5.1 Metallography
The samples were cut with the manual cutting machine, model "Struers Labotom-3", followed by the metallography using "Buehler SimpliMet" mounting press and "Buehler TransOptic" powder (thermoplastic arcrylic). After that manual grinding was carried out by using P150 to P1200 followed by manual polishing (6 µm, 3 µm and 1 µm). The samples were etched with a mixture of 60 mL HCl and 20 mL HNO3 using the wipe technique. The cross section were examined with a "Leica DMI5000 M" microscope and Leica software.
Instead of the dilution area, the penetration depth pand the weld bead width wwere determined using the "Leica 6D" stereo microscope. The reason for this is, that a reduced penetration depth and an increased width could led to the same area.
4.5.2 SEM analysis
SEM analysis was carried out in a few selected samples on a "FEI QUANTA 200" SEM to evaluate the chromium content using the EDX modus.
4.5.3 Hardness
For hardness testing, the surface of the samples was grinded up to the step of 1200P. A "Grayford Kent" hardness testing machine was used to measure the Vickers Hardness. The testing load was 20 kg. The measuring points were set according to figure 4.9. The average hardness was calculated from the measurement results within the deposit area.
5 Results and discussion
5.1 Magnetic circuit
In order to reduce the idle current, a capacitor was installed in the magnetic circuit for 25 Hz and 45 Hz. Therefore, the ohmic resistance of the spool was measured with 5.6Ω using a multimeter. For the electric circuit, a voltage of 35.52 V and current of 0.266 A at 50 Hz were measured. The inductance L was calculated with 0.4245 H.
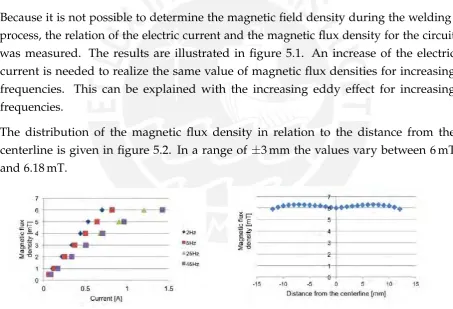
Because it is not possible to determine the magnetic field density during the welding process, the relation of the electric current and the magnetic flux density for the circuit was measured. The results are illustrated in figure 5.1. An increase of the electric current is needed to realize the same value of magnetic flux densities for increasing frequencies. This can be explained with the increasing eddy effect for increasing frequencies.
[image:43.595.68.522.314.623.2]The distribution of the magnetic flux density in relation to the distance from the centerline is given in figure 5.2. In a range of ±3 mm the values vary between 6 mT and 6.18 mT.
Figure 5.1: Schematic illustration of the dimensions of a sample
5.2 Welding results
5.2.1 Short circuit
5.2.1.1 Material transfer characteristics
(a) (b) (c) (d)
[image:44.595.88.504.189.485.2](e) (f) (g) (h)
Figure 5.3: Material transfer during short circuit for FCAW [Kra]
The metal transfer in short circuit mode is presented in figure 5.3. The wire is fed into the superficial molten weld bead and causes a short circuit (see figure 5.3a and 5.3b). Due to the current of the short circuit and increased magnetic forces, the drop detaches the tip of the wire, an arc ignites and a partial melting of the wire occurs. A drop is formed (see figure 5.3d) and the arc is located between the drop and the molten substrate. The drop is fed into the molten weld bead due to continuous fed wire (see figure from 5.3f to 5.3h). The video footage from Kraußer [Kra] 1does not show an impact of the magnetic oscillation on the droplet size .
The influence of the magnetic field on the deflection can be observed in figure 5.4. The deflection using 6 mT is higher than for 2 mT. Using a frequency of 45 Hz, a high magnetic field has less impact on the deflection. A quantitative description of the
1FCAW, 1.2 mm FeV12 electrode, shielding gas mixture: 96 % Ar, 3 % CO
(a) f =5 Hz,B=6 mT (b) f =5 Hz,B=6 mT
(c) f =5 Hz,B=2 mT (d) f =5 Hz,B=2 mT
[image:45.595.77.516.78.499.2](e) f =45 Hz,B=6 mT (f) f =45 Hz,B=6 mT
Figure 5.4: Comparison of arc deflection due magnetic oscillation
(a) (b)
deflection caused by the oscillation is not feasible due to the provided equipment and the pulsed exposure. Further investigations with a high speed camera have to be carried out in order to quantitatively analyze the impact of the magnetic field on the deflection of the outer and inner plasma.
As it can be seen in figure 5.5 the drop forms on this side where the arc is deflected. This is the result of the Lorentz force, which acts on a current carrying conductor. This force moves the molten tip of the wire in the same direction, where the arc is deflected and an illustration is given in figure 5.6. Due to the process characteristics, the tip of the wire is fed into the molten weld bead. This explains the widening effect caused by the magnetic oscillation. An influence of a higher welding current on the deflection could not be observed. The current characteristics, which are presented in figure 5.7,
Figure 5.6: Acting Lorentz forces deflects the molten tip of the arc
exhibit differences in the steepness of the positive and negative slope. Without the magnetic field, the positive and negative slopes are similar. Applied magnetic field led to a steeper positive slope and a shallower negative slope. Furthermore, the peak of the characteristics is more flat and the peak-to-peak value is lower.
It is presumed, that the current is reduced due to the increased arc length and the power supply characteristics. Moreover, it reduces the time constantτ of the electrical
circuit due to the increased resistance, which can be seen in the following equation.
τ = L
R (5.1)
(a) Without magnetic field
[image:47.595.83.513.74.316.2](b) f =5 Hz,B=6 mT
Figure 5.7: Impact of the magnetic field on the short circuiting arc current characteristic
well and a longer time is necessary for the droplet detachment. Further investigations have to be carried out in order to investigate the relationship of the droplet detachment for short circuit process in an magnetic influenced environment.
5.2.1.2 Weld seam appearance
In general, the surface of the weld seam is rough and no solidification lines can be observed. Depending on the magnetic values, the weld seam appearance varies and each sample was assigned to three categories:
• good: no spatter and uniform weld seam appearance,
• acceptable: little spatter and unevenness,
• not acceptable: spatter and no uniform weld seam appearance.
For low magnetic values, the weld seam appearance is better than with high values. The results are summarized in table 5.1 and table 5.2. Examples of the seam appearance are given in figure 5.32.
Table 5.1: Evaluation of the weld seam appearance
Frequency Magnetic flux [Hz] density[mT]
2 6
2 +++ +++
5 +++ +++
25 +++ +++
45 +++ +++
+++ good
++ acceptable
+ not acceptable
Table 5.2: Evaluation of the weld seam appearance
Frequency Magnetic flux [Hz] density [mT]
2 6
2 +++ +
5 +++ ++
25 +++ ++
45 +++ +
+++ good
++ acceptable
+ not acceptable
(a) I=210 A,U=24.1 V, f =45 Hz,B=2 mT
(b)I=260 A,U=24.8 V, f =45 Hz,B=2 mT
(c)I=260 A,U=24.8 V, f =45 Hz,B=6 mT
Figure 5.8: Influence of the magnetic field on the weld seam appearance
The weld seam appearance was not negatively influenced using magnetic field applica-tion under low voltage and electric current. That means, that the welding parameters were chosen right and the process window was not left.
Figure 5.9: Transversal cracks in the weld seam
Working with a high magnetic field value leads to an excessive increase of the arc length, which can result in leaving the process window. The setting window for the power supply gets more narrow by increasing the magnetic field, respectively. This fact is illustrated in figure 5.10.
5.2.1.3 Metallography
The influence of the magnetic field (frequency and magnetic flux density) on the penetration and weld bead width are presented in figure 5.11 for the lower welding setting parameters. Figure 5.12 shows the influence of the higher welding settings. Comparing the results from the energy input point of view, higher welding energy
(a) (b)
Figure 5.11: Influence of the magnetic field on the: (a) penetration depth and (b) width, I =210 A,U =24.1 V
lead to a higher penetration depth and a wider weld seam. The results of the lower welding parameter show, that the penetration is deeper at 2 mT in comparison to the weld without magnetic oscillation. Using 6 mT reduces the penetration. The lowest penetration depth was achieved with 6 mT and 2 Hz, 5 Hz and 45 Hz and a reduction of 14 % was obtained. The width is wider using a longitudinal magnetic field and increases slighty with increasing magnetic flux density. An improved width was achieved using 25 Hz and 6 mT, which means an increase of 17 %.
(a) (b)
A reduction of the penetration depth was only observed for a frequency of 2 Hz using magnetic oscillation and higher welding parameters. For the other pairs of values, the penetration increases by increasing the magnetic flux density. The seam gets wider, when the magnetic field is applied. An enhancement of 24 % was measured working with 25 Hz and 6 mT.
The effect of the magnetic field on weld penetration depth and width is clear and reasonable using lower welding settings. An increased magnetic field leads to less penetration depth and a wider bead. The weld width was increased with increasing magnetic flux density using higher welding values. However, it results in an increased penetration depth. Further investigations are necessary to explain this outcome.
The deflection results in an increased arc length, which causes a reduction of the welding current due to the power supply characteristics. This results in less heat input into the wire and the substrate and explains the reduction of the penetration depth.
Two cross section are presented in figure 5.13. In the overview, longitudinal cracks can be observed, which are located at the bottom region of the seam. The chromium carbides of the type M7C3 distinguish themselves from the hypereutectic matrix. Their size decreases from the outer to the inner region, which can be observed in figure 5.12b. Moreover, the carbide size decreases from the top to the bottom side. An influence of the magnetic field on the microstructure was not determined (see figure 5.13 and 5.14).
5.2.1.4 SEM analysis
Figure 5.15 shows an image of the SEM analysis. The dark toned areas represent the chromium carbides and the bright areas the matrix. EDX analysis revealed a chromium content of 33 % in the dark toned area and 15 % in the bright region. The rest is indicated as iron for both areas.
5.2.1.5 Hardness
(a) Overall view (b) Detail view at 50x
[image:52.595.75.521.73.649.2](c) Detail view at 1000x at top area
Figure 5.13: Cross section of sample D17, I =260 A, U =24.8 V, f =2 Hz, B=6 mT
(a) Overall view (b) Detail view at 50x
Figure 5.15: SEM analysis of sample D51, I =260 A,U =24.8 V, f =5 Hz, B =6 mT
Considering the hardness results of samples produced with higher energy welding, all average values are located in a variation range (see figure 5.16b). The maximum hardness was measured with 703 HV±26 HV (control sample) and the lowest with 640 HV±13 HV (f =45 Hz and B=6 mT).
(a) I=210 A,U=24.1 V
[image:54.595.133.469.72.496.2](b)I=260 A,U=24.8 V
Figure 5.16: Influence of the magnetic field on the hardness, short circuit
5.2.2 Pulsed transfer mode
5.2.2.1 Material transfer characteristics
5.18, the deflection of the arc by the magnetic field oscillation can be seen clearly as well as the release direction of molten droplet (see figure 5.18c).
[image:55.595.99.497.116.458.2](a) (b) (c) (d)
Figure 5.17: Material transfer during pulsed mode for FCAW [Kra]
(a) (b) (c) (d)
Figure 5.18: Material transfer during pulsed mode for FCAW with magnetic oscillation, f =20 Hz, B =5 mT [Kra]
Increasing the magnetic flux density leads to a higher deflection of the outer arc, which can be observed in figure 5.19. Examples of the deflection are presented in figure 5.21. The deflection increases linear with increased magnetic flux density. The slope is higher for 2 Hz in comparison to 5 Hz and 25 Hz. The slope for 45 Hz is the lowest.
The high speed camera footage from Kraußer [Kra] shows an uneven droplet detach-ment for high magnetic flux densities. The melting tip of the wire starts to form a drop and is deflected. The drop starts to grow and releases itself much later in comparison to the control sample. Moreover, droplets were identified, which did not fall off into the liquid weld bead (spatter).
(a) (b)
Figure 5.19: Influence of the magnetic field density and frequency on the arc deflec-tion(a) without additional shielding gas (b) with additional shielding gas
(a) f =25 Hz,B=6 mT (b) f =45 Hz,B=4 mT
Figure 5.20: Deflection of the arc during pulsed mode, with additional shielding gas
welding power source can be encountered as well. Observing the current characteristics with applied magnetic field (figure 5.21b), the peak current in the range from 0.01 s to 0.03 s and in the range from 0.08 s to 0.1 s is higher than the peak current in the range from 0.04 s to 0.07 s. The trend of the various peaks shows a slight tendency, that two oscillation peaks of the magnetic field are superimposing the pulses. In order to draw reliable conclusions and distinguish the magnetic field impact and the stray area of the pulse amplitudes, it is necessary to record a longer time span.
(a) Without magnetic field
(b) f =25 Hz,B=2 mT
Figure 5.21: Impact of the magnetic field on the pulsed circuiting arc current character-istic
[image:57.595.82.516.76.416.2]its limit and therefore the droplet size increases. Because the electric current is too low, an equilibrium of the forces is caused resulting in an aggravated droplet detachment.
5.2.2.2 Weld seam appearance
Observing the samples with the use of additional shielding gas, the weld appears smooth and more oval compared to the weld using short circuit. Transversal cracks were determined in all samples. Due to the magnetic field, the weld seam appearance changes depending on the magnetic settings. For low frequencies, no negative impact on the look of the seam was noticed. Spatter and uneven weld bead appearance occurred for frequencies above 25 Hz. The results are summarized in table 5.3 and examples are given in figure 5.23.
(a) f =2 Hz andB=4 mT, good appearance
(b) f =5 Hz andB=6 mT, acceptable appearance
[image:58.595.83.515.238.536.2](c) f =25 Hz andB=6 mT, not acceptable appearance
Figure 5.23: Weld seam appearance for pulsed mode with additional shielding gas
In contrast to that, no spatter and inhomogenous seam appearance due to oscillation occurred working with the self shielding process. A little uneven appearance for frequencies above 25 Hz was observed. The results are summarized in table 5.4 and example are given in figure 5.24. The surface of the weld is rough, like in short circuit mode and transversal cracking (cold cracking) was observed as well.
Table 5.3: Evaluation of the weld seam appearance, pulsed mode with additional shielding gas
Frequency
[Hz] Magnetic flux density [mT]
2 4 6
2 +++ +++ ++
5 +++ +++ ++
25 +++ ++ +
45 + + +
+++ good
++ acceptable
+ not acceptable
Table 5.4: Evaluation of the weld seam appearance, self shielded pulsed mode
Frequency
[Hz] Magnetic flux density [mT]
2 4 6
2 +++ +++ +++
5 +++ +++ +++
25 +++ +++ ++
45 +++ +++ ++
+++ good
++ acceptable
+ not acceptable
especially for frequencies above 25 Hz. Due to turbulences a change of the acting forces on the droplet occurs as well as atmospheric gases influences the arc. Moreover, this can explain the lower effect of magnetic field on the arc deflection at higher frequency. Further investigations have to be carried out using a more sufficient camera. As well, the internal control of the power source can suppress further effects.
(a) No magnetic oscillation
[image:59.595.85.511.405.629.2](b) f =45 Hz andB=6 mT
5.2.2.3 Metallography
The impact of the oscillation on penetration and width using additional shielding gas is presented in figure 5.25. A reduction of the penetration depth can be achieved with a frequency of 2 Hz and 5 Hz. The depth decreases with increasing magnetic flux density. The results regarding the frequency of 25 Hz and 45 Hz are higher than the results of the control samples. The lowest penetration depth of 1.6 mm was determined using 2 Hz and 4 mT (reduction of 38 %) and the deepest of 3.15 mm using 25 Hz and 6 mT. A widening of the seam can be achieved using 2 Hz, 5 Hz and 25 Hz and 2 mT and 4 mT. The maximum width was achieved with 2 Hz and 4 mT and amounts an increase of 21 % compared to the control sample. The results using the settings of 45 Hz have to be estimated with caution, because of the uneven weld seam appearance caused by the unstable arc.
(a)
[image:60.595.137.458.287.662.2](b)
The relationship of magnetic settings on seam dimensions for the self shielding process is given in figure 5.26. A reduction of the penetration can only be observed for a frequency of 5 Hz. A defined impact of the magnetic setting (f = 2 Hz, 25 Hz and 45 Hz) on the penetration depth cannot be identified. The width increases using 2 Hz and 5 Hz and 2 mT and 4 mT. The maximum width of 16.3 mm was achieved using 2 Hz and 6 mT, which is an increase of 19 % compared the control sample. A reduction of the width can be noticed with increasing magnetic flux density for a frequency of 25 Hz and 45 Hz.
(a)
[image:61.595.132.468.225.599.2](b)
Figure 5.26: Influence of the magnetic field on the (a) penetration depth and (b) width, self shielding
(a) Overview
[image:62.595.77.522.74.457.2](b) 50x, detail view (c) 500x, detail view
Figure 5.27: Cross section of sample E27; f =25 Hz and B=4 mT
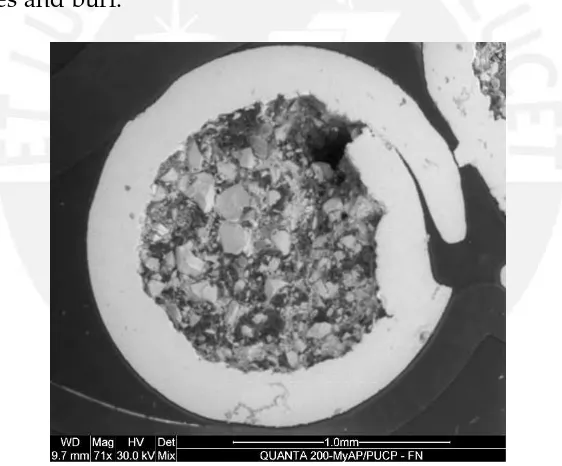
One example of the cross section is presented in figure 5.27. Due to the higher wire feeding rate, the weld seam width is up to two times wider in comparison to the width of the short circuit samples. The shape is more oval and a higher penetration depth can be noticed. In contrast to short circuit transfer mode, the cross section do not show the presents of chromium carbides. Dendrites are located in the eutectic matrix.
5.2.2.4 SEM analysis
Figure 5.28: SEM analysis sample E16; f =45 Hz and B=6 mT
5.2.2.5 Hardness
Based on the bar diagrams (see figure 5.29), no influence of the magnetic field on the hardness can be determined. The averages of the hardness values for all settings are in one range of variation. The lowest hardness of 566 HV±8 HV was determined using 25 Hz and 4 mT and the highest hardness of 651 HV±18 HV was measured working with 2 Hz and 2 mT. The average hardness for pulsed mode is lower than for short circuit.
5.2.3 Spray mode
5.2.3.1 Material transfer characteristics
The characteristic material transfer of the spray mode is given in figure 5.30. The arc burns between the tip of the wire and the base material. Because of the heat, the tip of the wire is plasticized and a droplet forms. The droplet grows, is constricted due to the magnetic forces and gets detached form the wire. Eventually, the droplet falls into the liquid weld bead. Parts of the filler material fall out of the open wire into the weld bead.
(a) With additional shielding gas
[image:64.595.85.515.118.519.2](b) Self shielding methode
Figure 5.29: Influence of LMF on hardness, pulsed mode
change of the release direction can be observed. Moreover, a decrease of the droplet detachment frequency was noticed.
5.2.3.2 Weld bead appearance
(a) (b) (c) (d)
(e) (f) (g) (h)
Figure 5.30: Material transfer during spray mode for FCAW [Kra]
[image:65.595.83.507.80.536.2](a) (b) (c) (d)
Figure 5.31: Material transfer during spray mode for FCAW,f =10 Hz and B=10 mT, [Kra]
The penetration is higher in spray mode in comparison to the other transfer modes and an example is given in figure 5.33. Therefore, no further investigations were carried out, because the high penetration does not fulfill the requirements for a hardfacing application and the tendency, that an improvement of the weld bead due magnetic field is not feasible when using this wire.
the self produced CO2. It can be presumed, that the share of each shielding element within the mixture is varying for different points of the arc. An applied external magnetic field results in lack of arc control, even for low magnetic fields.
(a) Without external magnetic field
(b) f =2 Hz,B=2 mT
(c) f =45 Hz,B=4 mT
[image:66.595.83.513.138.431.2]Figure 5.32: Influence of the magnetic field on the weld seam appearance, spray mode
5.3 Error consideration
[image:67.595.154.445.352.558.2]Several factors have to be considered, which influenced the results negatively. First of all, the magnet and the welding gun were positioned manually, which influenced the reproducibility. Moreover, the results are influenced by the friction between the liner and the wire, which has an impact on the wire feeding speed and therefore on the welding process. The magnetic field interacts with the samples and welding table, which caused mechanical vibrations of the yoke and the welding gun. This was minimized by design, but not neutralized. The poles of the yoke were heated up in consequence of the welding process. This results in a increase of the magnetic resistance and a reduction of the magnetic field density. The current in the coil was set indirectly due to the audio amplifier, which acts as a voltage supply. A temperature change of the cable leads to a change of the cable resistance and to a change of the current.
6 Summary
The objective of this thesis was to investigate the influence of a transversal magnetic field on the FCAW process. Therefore, a magnetic system was set up and characterized. In general, the arc can be manipulated during short circuit, pulse and spray transfer mode. Nevertheless, the results of the investigations show, that considerations have to be taken in order to receive a good weld bead appearance on one hand and on the other hand to take advantage of the magnetic system.
For short circuit welding, an increase of the weld bead width of 24 % was achieved when applying the magnetic field. The reason for the changed weld shape dimension is, that the molten tip of the wire is deflected due to the acting Lorentz force. Because of the increasing arc length and the power supply characteristics, the process window gets more narrow and therefore, the welding parameters have to be selected with applied magnetic field. The impact of the system on the weld bead is more distinctive for pulsed and spray transfer mode, because the detached droplet can be manipulated in their trajectory. An widening of the seam of 20 % and a reduction of the penetration depth of 30 % was achieved using the pulsed open arc process. For the pulsed mode process, the use of additional shielding gas and high deflection frequencies led to a lack of arc control, probably due to turbulences. Moreover, the application of arc deflection on the spray mode cannot be recommended for the type of electrode used in this investigation.
7 Outlook
The investigation shows the potential to combine the advantages of the flux cored arc welding and the deflection of the arc due to magnetic fields. Further investigations have to be carried out to verify the drawn conclusions and to understand further characteristics of the process.
List of Tables
2.1 Summary of important deposition welding processes [Teu02] . . . 5
2.2 Standards for Tubular cored electrodes . . . 10
2.3 Common core elements in flux cored electrodes [Ame91] . . . 12
4.1 Chemical composition . . . 29
4.2 Equipment for the electric circuit . . . 31
4.3 Welding parameters - short circuit . . . 32
4.4 Welding parameters - pulsed mode . . . 32
4.5 Welding parameters - spray mode . . . 33
5.1 Evaluation of the weld seam appearance . . . 41
5.2 Evaluation of the weld seam appearance . . . 41
5.3 Evaluation of the weld seam appearance, pulsed mode with additional shielding gas . . . 52
5.4 Evaluation of the weld seam appearance, self shielded pulsed mode . . 52
A.1 Parameterlist - short circuit . . . LXIV A.2 Parameterlist - spray mode, additional argon shielding gas . . . LXV A.3 Parameterlist - pulsed mode, with additional shielding gas (80 %-Ar,
![Figure 2.8: Transfer modes in an I − U - Diagram [IQ08]](https://thumb-us.123doks.com/thumbv2/123dok_es/2412666.16316/21.595.102.489.68.532/figure-transfer-modes-in-an-i-diagram-iq.webp)
![Figure 2.10: Pulsed GMAW current according to Wemann [WL06]](https://thumb-us.123doks.com/thumbv2/123dok_es/2412666.16316/23.595.198.391.74.246/figure-pulsed-gmaw-current-according-wemann-wl.webp)

![Figure 2.19: Resulting travel speed according to [KL85]](https://thumb-us.123doks.com/thumbv2/123dok_es/2412666.16316/32.595.126.463.73.495/figure-resulting-travel-speed-according-to-kl.webp)