Pegylated interferon-
αα
αα
2b and ribavirin decrease
claudin-1 and E-cadherin expression in HepG2 and Huh-7.5 cells
Erika P. Rendón-Huerta,* Ana Torres-Martínez,*
Claudia Charles-Niño,** Ana M. Rivas-Estilla,*** A. Paez,**** Teresa I. Fortoul,* Luis F. Montaño*
*Departamento de Biología Celular y Tisular, Facultad de Medicina, UNAM, México, D.F. 04510, México. **Laboratorio de Inmunología, Instituto de Investigaciones Biomédicas, UNAM, México, D.F. 04510, México. ***Departamento de Bioquímica y Medicina Molecular, Facultad de Medicina, UANL, Nuevo León, 64460, México.
****Departamento de Fisiología, Instituto Nacional de Cardiología, SS, México, D.F. 04480, México.
ABSTRACT
Background. Hepatitis C virus (HCV) infection usually results in long-term viremia. Entry of HCV into the he-patocyte requires claudin-1, -6, -9 and occludin. The efficacy of Pegylated interferon-α (PEG-IFN) treat-ment against HCV infection increased when ribavirin (RBV) was added to the therapeutic scheme. Our aim was to investigate if PEG-IFN plus RBV regulate claudin expression. Material and methods. HepG2, Huh-7 and Huh-7.5 cells were treated with PEG-IFN-α2a or α2b and/or RBV at different times before obtaining the cytosolic, membrane and cytoskeletal fractions. Claudin-1, 3, 4, 6, and 9, E-cadherin and occludin ex-pression was evaluated by Western blot analysis. Transepithelial electrical resistance (TER) was also deter-mined. Results. Claudin-1, 3, 4, 6, E-cadherin and occludin are constitutively expressed mainly in HepG2 cell membrane. Claudin-1 and E-cadherin cell membrane expression diminished after exposure to PEG-IFNα2b (50 ng) + RBV(50 µg); the maximal decrease was observed with 200 ng of PEG-IFNα2b + 200 µg of RBV. The effect was less intense with PEG-IFNα2a. The inhibition of claudin-1 and E-cadherin expression in Huh-7 and Huh-7.5 cells was only observed with 200 ng of PEG-IFNα2b + 200 µg of RBV. TER diminished mar-ginally in the HCV containing hepatoma cells with 200 ng of PEG-IFNα2b + 200 µg of RBV. Claudin-1 mRNA expression level was not affected by the combined treatment. Conclusion. The increased therapeutic efficacy of the PEG-IFNα2b plus RBV treatment could be secondary to the inhibition of claudin-1 and E-cadherin cell membrane expression.
Key words. Tight junction proteins. Hepatitis C virus. Claudins.
Correspondence and reprint request: Erika Rendón-Huerta, Ph.D.
Departamento de Biología Celular y Tisular, Facultad de Medicina, UNAM. AP 70-159, México 04510.
Tel.: (52) 55 5623-2191. Fax: (52) 55 5616-2419 E-mail: erendon@bq.unam.mx
Manuscript received: November 27, 2012. Manuscript accepted: January 23, 2013.
INTRODUCTION
Hepatitis C virus (HCV) results in long-term per-sistence of viremia in approximately 80% of cases; 20% of them develop liver cirrhosis and the remai-ning 5% develop hepatocellular carcinoma.1,2 HCV is
a small, single strand RNA enveloped virus; its ge-nome encodes a precursor polyprotein, which is cleaved into mature proteins, including envelope glycoproteins3 and structural proteins that promote
alterations of the tight junction-associated
pro-teins.4 Entry of HCV is dependent on claudin-1, a
member of a family of 24 proteins that are essential for the paracellular pathways at tight junction strands.5 Claudin-1 is important for mediating the
fusion between the viral and cellular lipid membra-nes.6,7 Claudin-6, claudin-9, and occludin expressed
in the liver also function as additional coreceptors for hepatitis C virus.8-10 The hepatocyte CD81
te-traspanin, LDL receptor and HDL scavenger recep-tor class B member I also bind viral envelope glycoprotein E2 thus enhancing HCV entry in a high-density-lipoprotein-dependent manner.11
Interferons have been considered the backbone of therapy in patients with HCV infection. However the percentage of HCV-infected patients with a sus-tained virological response (SVR) to type I pegylated interferon increased from 40% to 50-80% when riba-virin was added to the treatment.12 The aim of our
combination of pegylated interferon (PEGF-IFN) and ribavirin (RBV) inhibited the membrane expres-sion of claudins-1, -4 and -6 and completely abolis-hed E-cadherin expression in HepG2 cells. Claudin-1 expression was also inhibited in Huh-7.0 and Huh-7.5 cells. Pegylated α2a and α2b interferons exerted different inhibitory activity. The transepi-thelial electrical resistance and claudin-1 mRNA expression was not affected by PEG-IFN-α + ribavirin treatment.
MATERIAL AND METHODS
Cell culture
The human hepatoma cell lines HepG2 (HB-8065 ATCC), Huh-7 and Huh-7.5 (containing subgenomic and genomic HCV RNA, respectively),13,14 were
grown in Dulbecco’s modified Eagle’s medium (sup-plemented with 0.1 U/mL of insulin, 2 mM sodium pyruvate, 2 mM L-glutamine, 100 U/mL penicillin, 100 µg/mL streptomycin, 1% non-essential amino acids and 10% of heat inactivated fetal calf serum), at 37 oC in a humidified atmosphere containing 5%
CO2. Cells were plated at 7 x 10⁵ cells/dish and
grown at 80-90% confluence. Experiments were per-formed with different concentrations and exposure times of PEG-IFNα-2a (Pegytron, Roche) or PEG-IFNα-2b (Pegasys, Schering Plough) (10-200 ng/mL) and Ribavirin (R-9644, Sigma-Aldrich Co., St. Louis, MO)(10-200 µg/mL), either alone or in combination with either PEG-IFNs.
Subcellular fractionation
Cells, seeded at a 7 x 10⁵ density were grown in
sterile Petri dishes and maintained with supplemen-ted DMEM medium until confluence. Cells were in-cubated over night with DMEM without fetal calf serum before exposing them for 4 or 8 h to 10, 50, 100 and 200 ng/mL of either PEG-IFNs-α2 and 10, 50, 100 and 200 µg/mL ribavirin either alone or in combination. At the end of the incubation time, cells were rinsed three times with cold PBS and flash fro-zen at – 70 °C. The method described by Mullin, et al.15 was used to obtain different cell fractions. Cells
were thawed and scraped in 1 mL of buffer A (20 mM Tris, 0.25 M Dextrose, 10 mM EGTA, 2 mM EDTA, 12 µg/mL leupeptin, 1 mg/mL trypsin inhibi-tor and 1:100 dilution of Sigma phosphatases inhibiinhibi-tor cocktail 1 and cocktail 2) at 4 oC. Afterwards the
cells were sonicated for 1 min and centrifuged at 39,000 rpm for 30 min at 4 oC using a Beckman Ti
70 rotor. The supernatant (cytosolic fraction) was separated and the pellet was incubated again with buffer A supplemented with 1% Triton X-100 and centrifuged at 39,000 rpm for 30 min as above. The supernatant (membrane fraction) was removed by pipetting and the remaining pellet was incubated with lysis buffer (150 mM NaCl, 50 mM Tris-HCl, 1 mM EGTA, 1% NP-40, 0.1% deoxycholate, 0.1% SDS, 2 µg/mL aprotinin, 2 µg/mL leupeptin, 50 µM PMSF) and centrifuged at 39,000 rpm for 30 m. At the end the supernatant (cytoskeletal fraction) was removed by pipetting. All fractions were immediately frozen at -70 oC until use.
Western blot analysis
Western blot analysis was performed using the subcellular fractions. Protein concentration of each fraction was determined with a Bio-Rad protein as-say kit (Bio-Rad, Hercules, CA, USA). Fifty µg of protein was separated by 12% SDS-PAGE on a Bio-Rad Protean II electrophoresis apparatus. Protein transfer to 0.45-micron nitrocellulose membrane (Bio-Rad) was performed at 120 mA for 1 h using a Semi Dry Transfer Cell (Bio-Rad). Nonspecific bind-ing was blocked with 5% milk protein in TBS (20 mM tris, 136 mM NaCl, Ph 7.6) for 1 h before incu-bating the nitrocellulose membrane with one of the following antibodies: mouse monoclonal clau-din-1, - 4 and E-cadherin and rabbit polyclonal anti-claudin-3 and occludin (ZYMED, Laboratories Inc, USA) at 1:400 and goat anti claudin-6 and -9 (Santa Cruz Biotechnology, Santa Cruz, CA, USA) at 1:500. All the dilutions were made in TTBS (0.1% Tween-20 in TBS). Horseradish peroxidase-labeled rabbit anti-goat Ig’s (1:10,000), goat anti-rabbit Ig’s (1:10,000) and goat anti-mouse Ig’s (1:4000) (all from Zymed) were used as secondary antibody in TTBS. Antibody binding was detected by chemilumi-niscence using ECL Western Blotting Detection Sys-tem (Amersham Biosciences, Little Chalfont Bucks., UK). Since claudin-9 endogenous expression was not found in the cell membranes, it was excluded from the analysis.
Transepithelial electrical resistance
Briefly, cells were seeded onto Millipore Millicell cell culture inserts (0.4 um pore size) in 6 well plates until confluence. Huh-7 and Huh-7.5 monolayer formation in transwells was assessed after 48 h by measuring TER using the EVON mul-timeter (World Precision Instruments, Saratostra, FA) and chopstick-style electrodes. Growth medium was removed and the differentiating monolayers were gently washed twice with PBS before adding fresh culture medium containing PEG-IFN-α2b with or without ribavirin and left for various pe-riods of time before measurements were made at room temperature. Replicates of three separate de-terminations were analyzed. The results are expres-sed by Ohm’s/cm2.
Semiquantitative RT-PCR
Total RNA was extracted from the cell cultures using Trizol reagent (Life Technologies Mexico, Mexico City), according to the manufacturer’s pro-tocol. Concentration of RNA was determined at 260-280 nm using a NanoDrop 2000c Spectrophotometer (ThermoFisher Scientific, Waltham, MA). Samples (0.1 µg/µL RNA) were reverse-transcribed with the Invitrogen single step RT-PCR kit (Life Technolo-gies). The RT-PCR cycle conditions were 30 min at 55 °C, 2 min at 94 °C, then 40 cycles at 94 °C for 20 s, 59.7 °C for 30 s, 72 °C for 40 s, and 7 min at 72 °C. Reaction products were resolved by electrophoresis in 1% agarose gels. Actin cDNA was used as internal standard to normalize RNA amounts. Primer sequences were:
• Actin forward 5’-TGAAGGTGACAGCAGTCGG-TTG-3’.
• Actin-reverse 5’-GGCTTTTAGGATGGCAAGGG AC-3’.
• Claudin-1 forward 5’-TGCCCA CCTGCAAACTC-TC-3’.
• Claudin-1 reverse 5’-GCCTCTGTGTCACACG-TAGTC-3’.
Statistical analysis
Results were analyzed using Sigma-Stat. All va-lues are expressed as the mean + standard deviation of the mean (SD). Student’s t-test analysis was used to evaluate differences between two groups. Diffe-rences were considered to be significant for values of p < 0.05.
RESULTS
Constitutive expression
of tight junction proteins in HepG2 cells
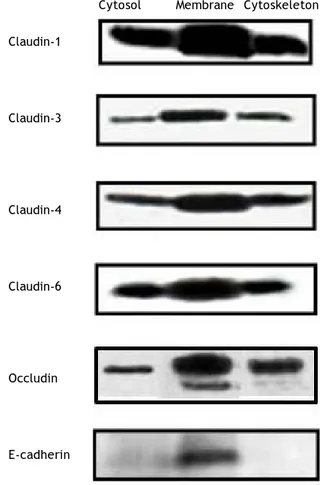
Figure 1 shows the cellular localization of clau-dins in HepG2 cells. Claudin-1, -3, -4, -6 and occlu-din were very strongly expressed in the cell membrane; the expression of these proteins was also observed in the cytosol and cytoskeleton fractions, but in a smaller amount in comparison with the cell membrane. E-cadherin was only expressed in the cell membrane. We evaluated these proteins because HCV utilizes cell membrane expressed tight junctions proteins to infect hepatocytes.7,8
Effect of pegylated
interferon and ribavirin on HepG2 cells
PEG-IFNα-2a did not modify the cell membrane expression of claudin-1 throughout the different
Figure 1. Constitutive tight junction protein claudin expression in the main cell compartments of HepG2 cells. The figure shows Western blot analysis.
Cytosol Membrane Cytoskeleton
Claudin-1
Claudin-3
Claudin-4
Claudin-6
Occludin
Table 1 summarizes the modifications observed in the expression of claudin-3, -4, and -6, in the cell fractions of HepG2 cells. PEG-IFNα-2b treated cells diminished claudin-4 expression in the cytosol frac-tion, and claudin-6 and -9 expression in the cell membrane fraction. Claudin-3 expression was not modified in any fraction. Ribavirin diminished the membrane expression of claudin-3 and -4 and the cytosol expression of claudin-3 and -6. The com-bined treatment with PEG-IFNα-2b + ribavirin diminished the membrane expression of claudin-3, but the effect was more pronounced in relation to claudin-6, since the treatment disturbed the overall expression of claudin-6 in the cytosol and the cytos-keleton. Occludin expression was not modified by pegylated interferon with or without ribavirin in none of the three cellular fractions analyzed (data not shown).
E-cadherin expression decreased importantly in the cell membrane fraction. The inhibitory effect experimental periods and treatments but induced a
slow but progressive decrease in claudin-1 expres-sion in the cytoskeleton fraction at concentrations as low as 10 ng/mL after 4 h of treatment (Figure 2A). The effect was clearly dose-dependent. The ex-pression of claudin-1 in any of the cell fractions was not modified by PEG-IFNα2b at concentrations as high as 200 ng/mL (Figure 2B).
PEG-IFNα-2a + ribavirin treatment induced a trivial decrease in claudin-1 expression in the cell membrane fraction; the effect was initially observed at a 50 ng/mL concentration and an 8 h incubation period (Figure 2C). Interestingly, the cells treated with PEG-IFNα-2b + ribavirin showed a similar but more noticeable decrease in claudin-1 expression (Figure 2D) in the cell membrane fraction. The inhi-bitory effect was initially observed at a 50 ng/mL concentration and at 8 h incubation period in both treatment schemes and it was dose dependent as fi-gure 2C clearly shows.
Figure 2. Effect of different type 1 pegylated interferons alone or in combination with ribavirin upon claudin-1 expression on HepG2 cells. A. Pegylated IFN-α2a. B. Pegylated IFN-α2b. C. Pegylated IFN-α2a + ribavirin. D. Pegylated IFN-α2b + ribavirin. The effect of the different doses evaluated was determined at two different exposure times. In C and D the dose of ribavirin was identical to the dose of the interferon being evaluated.
Time (h)
Cytosol
Membrane
Cytoskeleton
Actin
Time (h)
Cytosol
Membrane
Cytoskeleton
Actin
10 50 100 200
0 4 8 4 8 4 8 4 8
10 50 100 200
0 4 8 4 8 4 8 4 8
Peg-IFN-α2a (ηg) Peg-IFN-α2b (ηg)
10 50 100 200
0 4 8 4 8 4 8 4 8
10 50 100 200
0 4 8 4 8 4 8 4 8
Peg-IFN-α2a (ηg) + ribavirin (µg) Peg-IFN-α2b (ηg) + ribavirin (µg)
A B
started, similarly to claudin-1, at 50 ng/mL PEG-IFNα-2b + ribavirin concentration and after an 8 h incubation period. In contrast to claudin-1 expression, E-cadherin expression was completely abolished at 200 ng/mL of PEG-IFNα-2b + ribavirin (Figure 3). The inhibitory effect was only observed in the membrane cell fraction since the constitutive expression of this adhesion molecule in the cytosol and cytoskeleton fractions is negligible.
Effect of pegylated interferon and ribavirin on Huh-7 and Huh-7.5 cells
On figures 4A and 4B, we show the constitutive expression of claudin-1 in the membrane and cytos-keleton fractions of Huh-7 and Huh-7.5 cells. Simi-larly to the inhibitory effect observed in HepG2 cells, the combined treatment with PEG-IFNα-2b + ribavirin diminished the membrane expression of claudin-1 but the decrease was only evident at 200 ng concentrations as opposed to 50 ng that was the inhibitory concentration in HepG2 cells. Densitome-tric analysis demonstrated a 20% decrease in claudin-1 cell membrane expression in Huh-7 PEG-IFNα-2b + ribavirin treated cells compared with Huh-7 cells without treatment, and around 50% for Huh-7.5 cells compared to controls. Interestin-gly, the decrease in claudin-1 cell membrane expres-sion in the Huh-7.5 cells could probably be due at the expense of the cytoskeleton as the initial very weak expression observed in the first lane, that represents the constitutive expression, showed a progressive increase as the combined treatment doses were increased.
Effect of pegylated interferon and ribavirin on cells transepithelial electrical resistance (TER)
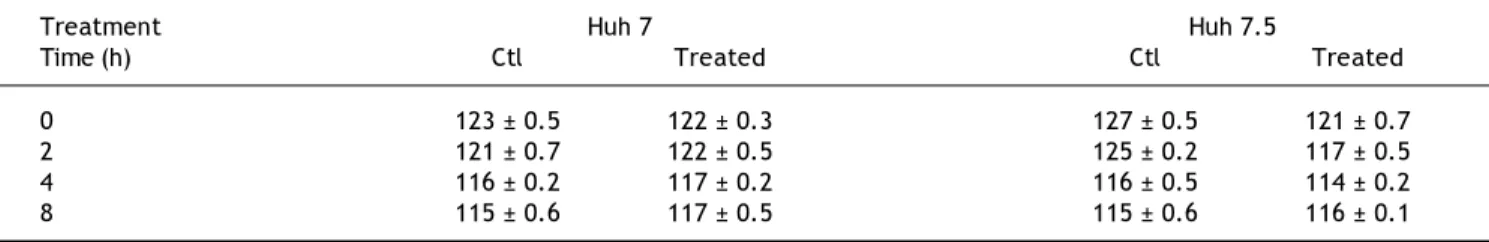
Because claudin expression was modified by PEG-IFNα-2b + ribavirin treatment we measured TER before and after treatment. Table 2 shows that there was a very marginal diminution in TER values in the Huh-7 and Huh-7.5 cell lines in non-treated and PEG-IFNα-2b + ribavirin treated conditions. The differences were not statistically significant.
Claudin-1 mRNA in all the cell lines
To corroborate if the treatments modified mRNA levels, claudin-1 mRNA was analyzed. Figure 5 shows that the basal concentration of claudin-1 RNAm in Huh-7 cells was lower in comparison with HepG2 and Huh-7.5 cell lines. Interestingly, all the
Table 1.
Effect of PEG-IFN
α
2b and/or ribavirin on the expression of other membrane expressed claudins in Hep G2 cells.
INF-α 2b (ng) Ribavirin (µg) INF-α
2b + Ribavirin (ng/µg)
Concentration 1 0 5 0 1 00 2 00 1 0 5 0 1 00 2 00 1 0 5 0 1 00 2 00 Time (h) 4 8 4 8 4 8 4 8 4 8 4 8 4 8 4 8 4 8 4 8 4 8 4 8 Cldn-3 M 1 11 11 2 1 2 1 1 1 22 22 2 C 1 11 11 1 1 1 E Cldn-4 M 12 2 1 1 2 C1 1 1 1 E 11 2 2 3 3 3 4 Cldn-6 M 2 22 2 2 2 2 22 33 3 C 12 22 2 2 22 2 2 E 1 11 1 1 1 1 11 11 2
M: membrane fraction. C: cytosol fraction, and E: cytoskeleton fraction (see Material and methods). The number represents the r
elative decrease in claudin expression: 1, trivial; 2, weak; 3, strong; 4,
different PEG-IFNα-2b + ribavirin treatments did not modify claudin-1 mRNA expression in any of the three cell lines.
DISCUSSION
Hepatitis C virus (HCV) is a small enveloped po-sitive stranded RNA virus that belongs to the Hepa-civirus genus in the Flaviviridae family. More than 80% of acutely HCV-infected patients fail to
eradica-te the virus and subsequently develop chronic hepa-titis,1,2 liver cirrhosis and hepatocellular carcinoma.
HCV entry is dependent on the interaction between viral envelope glycoproteins, E1 and E2, and multi-ple host membrane molecules that include CD81, LDLr, SRCB-I, claudins, occludin and glycosamino-glycans.9,10,16 The first line of defense against HCV
infection is provided by innate immune response cells, which secrete IFN-γ that inhibits replication of HCV.17,18 Endogenously produced type 1
interfe-Figure 3. Effect of pegylated IFN-α2b + riba-virin, on E-cadherin expression on HepG2 cells compartments. The dose of ribavirin was identi-cal to the dose of pegylated IFN-α2b being evaluated.
Concentration
Time (h)
Cytosol
Membrane
Cytoskeleton
Actin
0 10 50 100 200
0 4 8 4 8 4 8 4 8
Figure 4. Effect of pegylated IFN-α2b + riba-virin on claudin-1 expression in 7 and Huh-7.5 cells. The dose of ribavirin was identical to the dose of pegylated IFN- α2b being evaluated. The effect of the different doses evaluated was determined at two different exposure times.
Time (h)
Cytosol
Membrane
Cytoskeleton
0 10 50 100 200
0 4 8 4 8 4 8 4 8
Peg-IFN-α2a (ηg) + ribavirin (µg)
0 10 50 100 200
0 4 8 4 8 4 8 4 8
Peg-IFN-α2a (ηg) + ribavirin (µg)
Time (h)
Cytosol
Membrane
Cytoskeleton
A
B
Table 2. Effect of PEG-IFNα2b and ribavirin, on the TER values of Huh-7 and Huh-7.5 cell lines.
Treatment Huh 7 Huh 7.5
Time (h) Ctl Treated Ctl Treated
0 123 ± 0.5 122 ± 0.3 127 ± 0.5 121 ± 0.7
2 121 ± 0.7 122 ± 0.5 125 ± 0.2 117 ± 0.5
4 116 ± 0.2 117 ± 0.2 116 ± 0.5 114 ± 0.2
8 115 ± 0.6 117 ± 0.5 115 ± 0.6 116 ± 0.1
The values are reported in ohms/cm2. The results represent the mean ± standard deviation of three separate determinations. The wells were treated with 200
ng of PEG-IFNα2b + 200 μg of ribavirin. None of the differences reached statistically significant differences.
Figure 5. Claudin-1 mRNA expression on the three different cell lines with and without PEG-IFNα2b and ribavirin treatment. Similarly to the other experiments the effect of the different doses evaluated was determined at two different exposure times.
Cldn-1
Huh-7
Actin
Cldn-1
HepG2
Actin
Cldn-1
Huh-7.5
Actin
10 50 100 200
0 4 8 4 8 4 8 4 8
Peg-IFN-α2a (ηg) + ribavirin (µg)
Time (h)
rons IFN-α and IFN-β are also effective inhibitors of HCV replication19 but their short circulating
half-life (2-3 h in humans) makes frequent dosing neces-sary. Despite this, high-dose unmodified interferon-α therapy had a limited efficacy in naive patients20
partly because there was an increase in the frequen-cy and severity of adverse effects so patient com-pliance was difficult to maintain; the combination of unmodified interferon and ribavirin in patients with chronic HCV infection who relapsed after treatment
with interferon alone resulted in higher rates of SVR21 but the percentage of side effects was similar
and the response was dose-dependent. Renal elimi-nation is the predominant clearance mechanism of nonpegylated interferon but clearance after interac-ting with cellular interferon receptors has been shown.22 Pegylated interferon significantly
decrea-ses plasma drug clearance (35-77 h)23,24 providing
thera-peutic scheme for HCV infection used non-pegylated interferon and the maximal sustained viral response (SVR) was in the 25% range. When type I pegylated interferons appeared SVR increased slightly, but when ribavirin was included as a therapeutic complement to pegylated type I interferons, the SVR increased to a 45-55% (25). The plasma concentra-tion of ribavirin can be a predictor of efficacy and SVR to treatment26 but there is wide
pharmacokine-tic variability to pegylated type 1 interferon mainly driven by patient weight, so that the standard dose may not reach levels needed to achieve sustained vi-ral response.27 In order to eliminate the influence of
weight and renal clearance we evaluated pegylated interferon efficacy on a well-accepted cell model of HCV-infection.
HCV entry into the cell requires claudin-1, al-though to allow HCV entry into the hepatocyte, claudins need to interact with EWI-2wint, which blocks the E2-CD81 interaction.17 Occludin and
clau-dins 6 and 9 also enable HCV entry into cells.8,9,16
Our results showed that pegylated interferon in combination with ribavirin diminished the cell mem-brane expression of claudin-1 in HepG2 cells. We also observed a decrease on claudins 3 and 4 mem-brane expression induced by ribavirin alone or in combination with PEG-IFN-α2b. Claudin-4 gene is important for interferon-inducible antiviral respon-ses.28 Since claudin-1 mRNA was not affected by the
combined treatment of PEG-IFN-α2b plus ribavirin, we assume that the decrease in claudin-1 and -4 ex-pression could be related to alterations in the cytos-keleton, that possibly affect their transport to the cell membrane. Nevertheless, it has been shown that pro-inflammatory cytokines in highly inflammatory processes disrupt the distribution of claudin-1 in the cell membrane29 and this modification is crucial in
the regulation of HCV cellular tropism.30 Claudin
membrane disruption has also been observed with gamma interferon and tumor necrosis factor alpha, both of which induce internalization of claudin-1 and claudin-4.31
The membrane expression of E-cadherin, a pro-tein associated with bacterial adhesion and cancer progression, was significantly reduced with PEG-IFNα-2b + ribavirin. Down regulation of the E-cad-herin gene has been associated with early hepatocellular carcinoma32 but the incidence of
he-patocellular carcinoma in PEG-IFNα-2b/ribavirin treated patients is low. E-cadherin is a protein often adjacent to actin-containing filaments of the cytos-keleton; its inhibition alters the cadherin-based cell–cell junctions at sites where mechanical forces
are sensed and elicit proportional cellular responses such as regulation of cell growth and cell fate,33
thus favoring the “isolation” and further elimina-tion of the infected cells by immune response cells. Occludin expression, another tight junction protein utilized by the HCV to enter hepatocytes was not modified by ribavirin either alone or in combination with PEG-IFNα-2b. Occludin interacts with ZO-1 and ZO-2 proteins and is basically related to organi-zation of the microtubule network, but since inflam-matory mediators are emerging as regulators of the ability of hepatocytes to support HCV entry,10 our
results are consistent with those of Mee, et al.,34
that have shown that IFN perturbs the integrity of the tight junction but has no discernable effect on HCV entry.
The transepithelial electrical resistance of PEG-IFNα-2b + ribavirin treated cells showed an incons-picuous decrease. HCV subgenomic replicon containing Huh cells do not represent the actual viral infection and replication process, and Huh7.5 cells do not synthetize the E2 protein that is vitally required by the HC viruses to infect new cells through the claudin-1 and CD81 pathway. The bar-rier function is not altered when epithelial cells are exposed to virally mutated envelope proteins.35
Interferon-gamma is known to regulate claudin-1 expression in Caco-2 cells infected with cell culture-derived HCV but it does not affect the TER values in this cell line.36,37
Since claudin-1 mRNA was not affected by the combined treatment we must assume that the dimi-nished expression of claudin-1 at the membrane level of the cells must be secondary to an effect on the translation process induced by ribavirin, a gua-nosine nucleoside analogue that affects the mRNA of guanosyl transferase. Ribavirin affects translation in cells loaded with cyclin D1, GAPDH and VEGF mRNA by suppressing the translation initiation factor eIF4E.38 The HCV protein NS5A,
hyper-phosphorylates eIF4E, without altering global translation.39
The apparently different inhibitory capacity of both pegylated interferons might be secondary to their distinct chemical structure.40,41 PEG-IFNα-2a
has four domains that are responsible for the recep-tor binding interaction;42 the four major pegylation
sites in PEG-IFN fall within these domains. Pegyla-tion diminishes the affinity of the receptor-ligand in-teractions especially in PEG-IFNα-2a.43 Linear
PEG-IFNα-2a due to non-optimal interaction with IFN receptor.44,45 This might explain the differences
between both pegylated interferons in relation to their ability to inhibit claudin-1 membrane expres-sion, and thus explain differences in their antiviral activity. Nevertheless, this effect may not be univer-sal since the inhibitory effect of interferon-a upon SRCB-1 expression46 is not modified by pegylation.
Our results add to the understanding of the possi-ble antiviral mechanism of the combined pegylated in-terferon + ribavirin treatment used in chronic HCV infected patients. Nevertheless, the need for higher sustained viral responses in HCV infection has forced the search of new antiviral drugs since the use of pe-gylated interferons is being questioned.47
FINANCIAL SUPPORT
This work was supported by grants IN-208910 (DGAPA, UNAM), S0008-2009-1-112628 and CB-2012-01-177678 (CONACYT, México), and Buffington’s de Mexico, S.A. de C.V.
REFERENCES
1. Lauer GM, Walker BD. Hepatitis C virus infection. New Engl J Med 2001; 345: 45-52.
2. Hoofnagle JH. Course and outcome of hepatitis C. Hepato-logy 2002; 36: S21-S29.
3. Lindenbach BD, Evans MJ, Syder AJ, Wölk B, Tellinghuisen TL, Liu CC, Maruyama T, et al. Complete replication of he-patitis C virus in cell culture. Science 2005; 309: 623-6. 4. Benedicto I, Molina-Jimenez F, Barreiro O,
Maldonado-Ro-dríguez A, Prieto J, Moreno-Otero R, Aldabe R, et al. He-patitis C virus envelope components alter localization of hepatocyte tight junction-associated proteins and pro-mote occludin retention in the endoplasmic reticulum. He-patology 2008; 48: 1044-53.
5. Morita K, Furuse M, Fujimoto K, Tsukita S. Claudin multige-ne family encoding four-transmembramultige-ne domain protein components of tight junction strands. Proc Natl Acad Sci USA 1999; 96: 511-6.
6. Dubuisson J, Helle F, Cocquerel L. Early steps of the hepa-titis C virus life cycle. Cell Microbiol 2008; 10: 821-7. 7. Evans MJ, von Hahn T, Tscherne DM, Syder AJ, Panis M,
Wölk B, Hatziioannou T, et al. Claudin-1 is a hepatitis C vi-rus receptor required for a late step in entry. Nature
2007; 446: 801-5.
8. Zheng A, Yuan F, Li Y, Zhu F, Hou P, Li J, Song X, et al. Deng, Claudin-6 and claudin-9 function as additional core-ceptor for hepatitis C virus. J Virol 2007; 81: 12465-71. 9. Meertens L, Bertaux C, Cukierman L, Cormier E, Lavillette
D, Cosset FL, Dragic T. The tight junction proteins clau-din-1, -6 and -9 are entry cofactors for the hepatitis C vi-rus. J Virol 2008; 82: 3555-60.
10. Meredith LW, Wilson GK, Fletcher NF, McKeating JA. Hepa-titis C virus entry: beyond receptors. Rev Med Virol 2012; 22: 182-93.
11. Guan M, Wang W, Liu X, Tong Y, Liu Y, Ren H, Zhu S, et al. Three different functional microdomains in the hepatitis C
virus hypervariable region I (HVRI) mediate entry and immune evasion. J Biol Chem 2012 [Epub ahead of print]. 12. Chen SL, Morgan TR. The natural history of hepatitis C
virus (HCV) infection. Int J Med Sci 2006; 3: 47-52. 13. Lohmann V, Korner F, Herian U, Theilmann L,
Bartenschla-ger R. Replication of subgenomic hepatitis C virus RNAs in a hepatoma cell line. Science 1999; 285: 110-3.
14. Blight KJ, McKeating JA, Rice CM. Highly permissive cell li-nes for subgenomic and genomic hepatitis C virus RNA re-plication. J Virol 2002; 76: 13001-14.
15. Mullin JM, Soler AP, Laughlin JV, Kampherstein JA, Russo LM, Saladik DT, George K, et al. Chronic exposure of LLC-PK1 epithelia to the phorbol ester TPA produces polyp-like foci with leaky tight junctions and altered protein kinase C-alpha expression and localization. Exp Cell Res 1996; 227: 12-22.
16. Harris HJ, Davis C, Mullins JG, Hu K, Goodall M, Farquhar MJ, Mee CJ, et al. Claudin association with CD81 defines hepatitis C virus entry. J Biol Chem 2010; 285: 21092-102. 17. Frese M, Schwarzle V, Barth K. Interferon-gamma inhibits
replication of subgenomic and genomic hepatitis C virus RNAs. Hepatology 2002; 35: 694-703.
18. Kanto T, Hayashi N. Immunopathogenesis of hepatitis C virus infection: multifaceted strategies subverting innate and adaptative immunity. Intern Med 2006; 45: 183-91. 19. Tanabe Y, Sakamoto N, Enomoto N, Kurosaki M, Ueda E,
Maekawa S, Yamashiro T, et al. Synergistic inhibition of in-tracellular hepatitis C virus replication by combination of ribavirin and interferon-alpha. J Infect Dis 2004; 189: 1129-39.
20. Poynard T, Leroy V, Cohard M. Meta-analysis of interfe-ron randomized trial in the treatment of viral hepatitis C: effects of dose and duration. Hepatology 1996; 24: 778-89.
21. Davis GL, Esteban-Mur R, Rustgi V, Hoefs J, Gordon SC, Trepo C, Shiffman ML, et al. Interferon alfa-2b alone or in combination with ribavirin for the treatment of relapse of chronic hepatitis C. N Engl J Med 1998; 339: 1493-9. 22. Bocci V. Metabolism of protein anticancer agents.
Phar-macol Ther 1987; 34: 1-49.
23. Glue P, Fang JWS, Rouzier-Panis R, Raffanel C, Sabo R, Gup-ta SK, Salfi M, et al. Pegylated interferon-a2b: pharmaco-kinetics, pharmacodynamics, safety and preliminary efficacy data. Clin Pharmacol Ther 2000; 68: 556-67. 24. Perry CM, Jarvis B. Peginterferon-alpha-2a (40 Kd): a
re-view of its use in the management of chronic hepatitis C.
Drugs 2001; 61: 2263-88.
25. Zeuzem S. Interferon-based therapy for chronic hepatitis C: current and future perspectives. Nat Clin Pract Gas-troenterol Hepatol 2008; 5: 610-22.
26. Maynard M, Pradat P, Gagnieu MC, Souvignet C, Trepo C. Prediction of sustained virological response by riba-virin plasma concentration at week 4 of therapy in hepatitis C virus genotype 1 patients. Antivir Ther
2008; 13: 607-11.
27. Jain MK, Pasipanodya JG, Alder L, Lee WM, Gumbo T. Pegylated interferon fractal pharmacokinetics: individua-lized dosing for hepatitis C virus infection. Antimicrob Agents Chemother 2012. Doi: 10.1128/AAC.02208-12. 28. Jia D, Rahbar R, Fish EN. Interferon-inducible Stat2
acti-vation of JUND and CLDN4: mediators of IFN responses. J Interferon Cytokine Res 2007; 27: 559-66.
30. Yang W, Qiu C, Biswas N, Jin J, Watkins SC, Montelaro RC, Coyne CB, et al. Correlation oft he tight junction-like dis-tribution of claudin-1 to the cellular tropism of hepatitis C virus. J Biol Chem 2008; 283: 8643-53.
31. Bruewer M, Luegering A, Kucharzik T, Parkos CA, Madara JL, Hopkins AM, Nusrat A. Proinflammatory cytokines disrupt epithelial barrier function by apoptosis-indepen-dent mechanism. J Immunol 2003; 171: 6164-72.
32. Llovet JM, Chen Y, Wurmbach E, Roayale S, Fiel MI, Schwartz M, Thung SN, et al. A molecular signature to dis-criminate dysplastic nodules from early hepatocellular car-cinoma in HCV cirrhosis. Gastroenterology 2006; 131: 1758-67.
33. Kim NG, Koh E, Chen X, Gumbiner BM. E-cadherin mediates contact inhibition of proliferation through Hippo signa-ling-pathway components. Proc Natl Acad Sci USA 2011; 108: 11930-5.
34. Mee CJ, Harris HJ, Farquhar MJ, Wilson G, Reynolds G, Da-vis C, van Ijzendoorn SC, et al. Polarization restricts he-pattis C virus entry into HepG2 hepatoma cells. J Virol
2009; 83: 6211-21.
35. Nazli A, Chan O, Dobson-Belaire WN, Ouellet M, Trembaly MJ, Gray-Owen SD, Arsenaults AL, et al. Exposure to HIV-1 directly impairs mucosal epithelial barrier integrity allo-wing microbial translocation. PloS Pathogen 2010; 8: e1000852.
36. Wei X, Jia ZS, Lian JQ, Zhang Y, Li J, Ma L, Ye L, et al. In-hibition of hepatitis C virus infection by interferon-gam-ma through downregulating claudin-1. J Interferon Cytokine Res 2009; 29: 171-8.
37. Kawaguchi H, Akazawa Y, Watanabe Y, Takakura Y. Per-meability modulation of human intestinal Caco-2 cell monola-yers by interferons. Eur J Pharm Biopharm 2005; 59: 45-50. 38. Kentsis A, Topisirovic I, Culjkovic B, Shao L, Borden KL. Ri-bavirin suppresses elF4E-mediated oncogenic transforma-tion by physical mimicry of the 7-methyl guanosine mRNA cap. Proc Natl Acad Sci USA 2004; 101: 18105-10.
39. George A, Panda S, Kudmulwar D, Chhatbar SP, Nayak SC, Krishnan HH. Hepatitis C virus NS5A binds to the mRNA cap-binding eukaryotic translation initiation 4F (eIF4E) complex and up-regulates host translation initiation ma-chinery through eIF4E-binding protein 1 inactivation. J Biol Chem 2012; 287: 5042-58.
40. Foster GR. Pegylated interferons: chemical and clinical differences. Aliment Pharmacol Ther 2004; 20: 825-30. 41. Grace MJ, Cutler DL, Bordens RW. Pegylated IFNs for
chronic hepatitis C. an update. Expert Opin Drug Deliv
2005; 2: 219-26.
42. Dhalluin C, Ross A, Leuthold LA, Foser S, Gsell B, Müller F, Senn H. Structural and biophysical characterization of the 40 kDa PEG-interferon-alpha2a and its individual positional isomers. Bioconjug Chem 2005; 16: 504-17.
43. Dhalluin C, Ross A, Huber W, Gerber P, Brugger D, Gsell B, Senn H. Structural, kinetic, and thermodynamic analy-sis of the binding of the 40 kDa PEG-interferon-alpha2a and ist individual position isomers to the extracellular domain of the receptor IFNAR2. Bioconjug Chem 2005; 16: 518-27.
44. Boulestin A, Kamar N, Sandres-Saune K, Alric L, Vinel JP, Rostaing L, Izopet J. Pegylation of IFN-alpha and antiviral activity. J Interferon Cytokine Res 2006; 26: 849-53.
45. Grace MJ, Cutler D. Pegylating IFNs at his-34 improves the in vitro antiviral activity through the JAK/STAT pathway. Antivir Chem Chemother 2004; 15: 287-97. 46. Murao K, Imachi H, Yu X, Cao WM, Nishiuchi T, Chen K, Li
J, et al. Interferon alpha decreases expression of human scavenger receptor class B1, a possible HCV receptor in hepatocytes. Gut 2008; 57: 664-71.