Diagnostic performance of
controlled attenuation parameter for
predicting steatosis grade in chronic hepatitis B
Ana C. Cardoso,* Michel Beaugrand,† Victor de Ledinghen,‡ Catherine Douvin,§ Raoul Poupon,||Jean-Claude Trinchet,† Marianne Ziol,¶ Pierre Bedossa,** Patrick Marcellin*
* Department of Hepatology and INSERM U773-CRB3, Hôpital Beaujon, APHP, University of Paris 7, Clichy, France.
† Department of Hepatology, Hôpital Jean Verdier, Bondy, France.
‡ Department of Hepatology, Hôpital Haut-Leveque, CHU Bordeaux Pessac, France and INSERM U1053, Université Bordeaux Segalen, Bordeaux, France. § Department of Hepatology, Hôpital Henri Mondor, Créteil, France.
|| Department of Hepatology, Hôpital Saint Antoine, Paris, France.
¶ Department of Anatomy and Pathology, Hospital Group Paris-Seine-Saint Denis, Hôpital Jean Verdier, AP-PH, Bondy, France and Paris 13 University,
Sorbonne Paris Cité, UFR SMBH, Bobigny, France.
** Department of Anatomy Pathology and INSERM U773-CRB3, Hôpital Beaujon, Clichy, France.
ABSTRACT
Background & aims. A novel controlled attenuation parameter (CAP) using the signals acquired by the
Fi-broScan® has been developed as a method for evaluating steatosis. The aim of this study is to assess the performance of the CAP for the detection and quantification of steatosis in patients with chronic hepati-tis B (CHB). Material and methods. 136 subjects with CHB underwent liver biopsy and FibroScan® within 60 days. CAP was evaluated retrospectively using raw FibroScan® data. Steatosis was graded as follows: S0 (steatosis < 10% of hepatocytes), S1 (10 to < 30%), S2 (30 to < 60%) or S3 (≥ 60%). Performance was evaluated by area under the receiver operating characteristic (AUROC) curve. Results. Proportions of each steatosis grade (S0-S3) were 78, 10, 9 and 3%, respectively. Using univariate analysis, liver stiffness measurement (LMS) significantly correlated with fibrosis stage (τ = 0.43; P < 10-10), sex, necro-inflammatory activity,
stea-tosis, age, NASH, and perisinusoidal fibrosis, and with liver fibrosis stage (P < 10-8) and perisinusoidal fibrosis
(P = 0.008) using multivariate analysis. CAP correlated with steatosis (τ = 0.38, P < 10-7), body mass index,
NASH, fibrosis and perisinusoidal fibrosis using univariate analysis, but only steatosis (P < 10-10) and
perisinus-oidal fibrosis (P = 0.002) using multivariate analysis. AUROCs for LSM were: 0.77 (0.69-0.85), 0.87 (0.80-0.95), and 0.93 (0.83-1.00), respectively, for fibrosis stages F ≥ 2, F ≥ 3 and F = 4. AUROCs for CAP were: 0.82 (0.73-0.92), 0.82 (0.69-0.95), and 0.97 (0.84-1.00) for ≥ S1, ≥ S2 and S3 steatosis, respectively. Conclusions. In conclusion CAP is a novel, accurate non-invasive tool and may be suitable for detecting and quantifying steatosis in CHB patients.
Key words. HBV. Non-alcoholic fatty liver disease. CAP. Elastography.
Correspondence and reprint request: Ana C. Cardoso, M.D.
Service d’Hépatologie and INSERM U773-CRB3, Hôpital Beaujon. 100 Bd du General Leclerc, 92110, Clichy, France.
Tel.: +33 1 40 87 53 38; +33 1 40 87 50 95. Fax: +33 1 47 30 94 40 E-mail: [email protected]
Manuscript received: February 23, 2015. Manuscript accepted: March 28, 2015. INTRODUCTION
Non-alcoholic fatty liver disease is a proposed risk factor for the development of hepatocellular
carcino-ma (HCC).1 In chronic hepatitis C infection,
steato-sis is known to accelerate fibrosteato-sis progression,2-4
may predict the development of HCC,5,6 and is
associated with a decrease in antiviral treatment re-sponse.7,8 Although hepatitis B virus (HBV)
infec-tion is a leading cause of cirrhosis and HCC,9 the
impact of steatosis in chronic hepatitis B (CHB) is not well defined. Its frequency in CHB patients has been reported as between 22 and 51%10-12 and is,
therefore, probably higher than in the general popu-lation (16-31%).13-15 However, rather than being
vi-rus driven, steatosis in CHB appears to be related to host metabolic factors, such as serum triglyceride
levels, high body mass index (BMI) and metabolic syndrome.11,16-18 Furthermore, steatosis may be
as-sociated with a reduction in response to therapy for CHB with either pegylated interferon or entecav-ir.10,12 Taken together, evidence to date suggests a
potential role for steatosis in the progression of liver disease in patients with CHB.10,16
The gold standard method for assessing steatosis and liver fibrosis is currently liver biopsy (LB). However, for several reasons, such as the invasive nature of the technique and potential sampling error and complications,19,20 non-invasive methods for
evaluating fibrosis in particular have been investi-gated, including conventional imaging techniques such as computed tomography (CT), magnetic reso-nance imaging (MRI) and ultrasound.20 However,
none of these methods allows the simultaneous eval-uation of steatosis and fibrosis.
FibroScan® (Echosens, Paris, France) is already being used as a non-invasive method to evaluate fi-brosis. This is a vibration-controlled transient elas-tography (VCTETM) device that transmits
low-amplitude vibrations into the liver tissue and uses ultrasound pulses to measure the velocity of propagated elastic waves.20-22 As fat affects
ultra-sound propagation, a novel controlled attenuation parameter (CAP) using the signals acquired by the FibroScan® has been developed as a method for evaluating steatosis. Studies of this technique for evaluating steatosis in patients with chronic liver disease of any etiology23-25 and due to hepatitis C
virus infection26 have already been undertaken and
demonstrated good performance. Currently, CAP has emerged as a practical tool for evaluating steatosis in CHB as well, and so far few studies have addressed its relevance in mixed populations.
The aim of our study was to assess the perform-ance of the non-invasive CAP method linked to the FibroScan® test for the detection and quantification of steatosis in patients with CHB and validate the re-sults against the current gold standard which is LB.
MATERIAL AND METHODS
Study population
The patients reported here participated in a larg-er multicentric study of FibroScan® testing to vali-date transient elastography (TE) measurements as a marker of fibrosis.27-31 Patients with chronic liver
disease due to various etiologies were enrolled in the overall cohort. This study focuses on those patients whose liver disease was due to HBV infection
(in-cluding 100 patients previously reported by Marcel-lin, et al.29) and who were deemed to have CHB as
defined by the presence of hepatitis B surface anti-gen (HBsAg) and detectable serum HBV DNA for at least 6 months. Such patients underwent both FibroScan® and LB between November 2002 and December 2004 across five liver units in France: Hôpital Jean Verdier, Bondy; Hôpital Haut-Leveque, Pessac; Hôpital Henri Mondor, Créteil; Hôpital Beaujon, Clichy; and Hôpital Saint Antoine, Paris. Exclusion criteria were one or more of the following: a delay of > 60 days between FibroScan® and LB; an unreliable FibroScan® examination (< 10 valid measurements); an unsuitable LB for fibrosis staging (< 10 portal tracts in the case of no obvious cirrhosis); co-infection with human immun-odeficiency virus and/or hepatitis delta virus; other causes of liver disease; decompensated liver disease; complications of liver cirrhosis (including HCC); and previous liver surgery (including liver trans-plantation).
The study conformed to the Helsinki Declaration guidelines and was approved by an independent eth-ics committee. All patients included in the study pro-vided written informed consent.
Liver biopsy and histology
Percutaneous LBs were performed under ultra-sound guidance using the Menghini technique with disposable 16-gauge diameter needles. A single, expe-rienced pathologist (PB) who was blinded to the oth-er study data evaluated all specimens. Livoth-er fibrosis and necro-inflammatory activity were staged accord-ing to the METAVIR scoraccord-ing system.32 Steatosis was
categorized as:
• Absent (< 10% of hepatocytes affected; S0). • Mild (10 to 30% of hepatocytes affected; S1). • Moderate (30 to 60% of hepatocytes affected; S2)
or
• Severe (≥ 60% of hepatocytes affected; S3).
Non-alcoholic steatohepatitis (NASH) was defined as absent or present based on the association of st-eatosis with significant clarification/ballooning of hepatocytes and lobular inflammation,33 while
per-isinusoidal fibrosis was defined as:
• Absent/minimal (0).
• Marked (2; when perisinusoidal fibrosis was dif-fuse throughout the entire liver lobule).
The length of each liver fragment was recorded.
Biologic and clinical parameters
A complete physical examination, recording of clinical data and laboratory tests were carried out on the same day as the LB. HBsAg, hepatitis B ‘e’ antigen (HBeAg) and antibodies were measured us-ing standard enzyme linked immunosorbent assays (Abbott Diagnostics, Abbott Park, IL). HBV DNA levels were measured using the COBAS® Am-pliPrep/COBAS® TaqMan® HBV Test v2.0 (Roche Molecular Systems, Pleasanton, CA).
Transient elastography and
controlled attenuation parameter measurements
Liver stiffness measurements (LSM) were per-formed by FibroScan® using an established tech-nique as previously described.22,29 Only patients with
10 or more valid measurements were included in the final analysis. The final LSM result corresponds to the median LSM value and is expressed in KPa.
The CAP is a novel measurement designed to de-termine the liver ultrasonic attenuation (go and re-turn path) and is expressed in dB/m. The principles have been described previously.23,26 It is evaluated
using the signals acquired during FibroScan® ex-amination using the standard probe at 3.5 MHz in a fixed volume of liver parenchyma and is only ap-praised if the acquisition is valid. CAP is calculated using a predefined algorithm. The final CAP corre-sponds to the median of individual CAP values (range 100 to 400 dB/m).
Statistical analyses
Evaluation of potential relationships between LSM, CAP, and histologic parameters (activity grade, fibrosis stage, steatosis grade, NASH, and perisinusoidal fibrosis) was carried out using Kend-all’s rank correlation coefficient. Multivariate anal-yses with multiple linear regressions were used to investigate any potential influence of the histologic values on LSM and CAP. Features independently as-sociated with LSM and CAP were selected using a backward procedure, based on the minimization of the Akaike information criterion. Only those varia-bles that were statistically associated in the univari-ate analysis with the variables of interest (CAP and
liver stiffness) were included in the model of logistic regression. For perisinusoidal fibrosis, two different multivariate analyses were performed (separate analyses). The first one only included liver stiffness and CAP. The second one included all histological parameters that were correlated to perisinusoidal fi-brosis in univariate analysis.
Area under the receiver operating characteristics (AUROC) curves were calculated, with 95% confi-dence intervals (CIs), using the Mann-Whitney test.34 After maximizing the total sensitivity and
specificity (maximum Youden index), and accuracy, cutoff values, sensitivity, specificity, positive predic-tive value (PPV), and negapredic-tive predicpredic-tive value (NPV) were calculated for LSM and CAP. Internal validation was performed using the Jack-Knife method.35
Statistical analyses were carried out using the R software (R Development Core Team, 2008) with re-sults associated with P values < 0.05 considered significant.
RESULTS
Patients
A total of 197 patients who were considered for enrolment from the following centers: Hôpital Jean Verdier, n = 110; Hôpital Haut-Leveque, n = 28; Hôpital Henri Mondor, n = 20; Hôpital Beaujon, n = 37; and Hôpital Saint Antoine, n = 2. Of these, 61 patients (30%) were excluded as they had an hepatic tumor or other causes of liver disease/liver transplantation, or because there was a delay of > 60 days between LB and LSM, results were unreliable, or LSM was not successfully measured. More infor-mation on patient disposition is shown in figure 1.
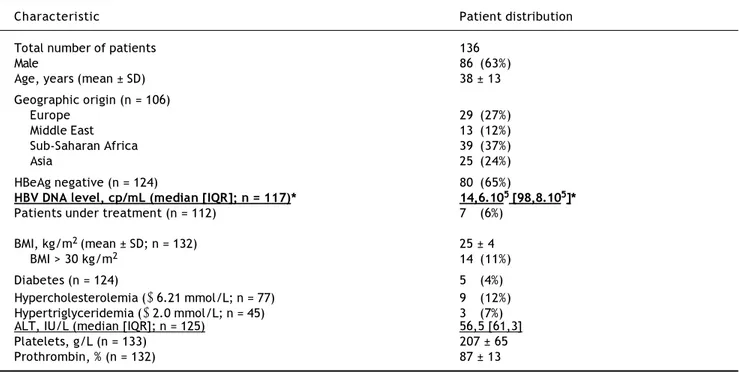
The characteristics of the 136 patients fulfilling the entry criteria are shown in table 1. The patients were predominantly male (63%) with a mean age of 38 years. As expected, the majority of patients were HBeAg negative (65%) and only a minority was be-ing treated when the LB was performed.
Histology
Table 1. Baseline characteristics of the patients enrolled in the study.
Characteristic Patient distribution
Total number of patients 136
Male 86 (63%)
Age, years (mean ± SD) 38 ± 13
Geographic origin (n = 106)
Europe 29 (27%)
Middle East 13 (12%)
Sub-Saharan Africa 39 (37%)
Asia 25 (24%)
HBeAg negative (n = 124) 80 (65%)
HBV DNA level, cp/mL (median [IQR]; n = 117)* 14,6.105 [98,8.105]*
Patients under treatment (n = 112) 7 (6%)
BMI, kg/m2 (mean ± SD; n = 132) 25 ± 4
BMI > 30 kg/m2 14 (11%)
Diabetes (n = 124) 5 (4%)
Hypercholesterolemia (≥ 6.21 mmol/L; n = 77) 9 (12%) Hypertriglyceridemia (≥ 2.0 mmol/L; n = 45) 3 (7%)
ALT, IU/L (median [IQR]; n = 125) 56,5 [61,3]
Platelets, g/L (n = 133) 207 ± 65
Prothrombin, % (n = 132) 87 ± 13
ALT: alanine aminotransferase. BMI: body mass index. HBeAg: hepatitis B ‘e’ antigen. SD: standard deviation. * IQR: interquartile range.
Figure 1. Flow diagram showing screened, included and
ex-cluded patients. HBV: hepatitis B virus. LB: liver biopsy. LSM: liver stiffness measurement.
1,556 patients with FibroScan® and LB
197 HBV patients
4 patients excluded:
delay > 90 days between FibroScan® LB
11 patients excluded:
hepatic tumor
12 patients excluded:
LB not suitable for evaluation
15 patients excluded:
transplanted or coinfected
19 patients excluded:
unreliable LSM
136 patients included
Table 2. Distribution of patients with respect to histological
parameters.
Parameter Distribution of
(classification) patients, n (%)
Fibrosis
F0/F1 70 (51)
F2 30 (22)
F3 24 (18)
F4 12 (9)
Necro-inflammatory activity
A0 26 (19)
A1 73 (54)
A2 28 (21)
A3 9 (7)
Steatosis
S0 106 (78)
S1 14 (10)
S2 12 (9)
S3 4 (3)
NASH
Absent 134 (98.5)
Present 2 (1.5)
Perisinusoidal fibrosis
0 61 (45)
1 53 (39)
2 22 (16)
of patients had absent/mild (45%) or moderate (39%) perisinusoidal fibrosis.
Diagnostic performance of liver stiffness measurement and controlled attenuation parameter
In the univariate analysis, LSM is mainly correlat-ed with METAVIR fibrosis stage (τ = 0.43, P < 10-10),
but also with gender (τ = 0.32, P < 10-5), age
(τ = 0.23, P < 10-4), METAVIR
necro-inflamma-tory activity (τ = 0.29, P < 10-4), steatosis (τ =
0.24, P < 10-3) and perisinusoidal fibrosis (τ = 0.27,
P < 10-4). In addition, LSM correlates in a modest
way with CAP (τ = 0.14, P < 0.02) and NASH (τ = 0.14, P < 0.05). Using multivariate analysis, LSM adjusted for sex and age is mainly associated with fibrosis stage (P < 10-8) and perisinusoidal fibrosis
(P = 0.008).
Univariate analysis of the data relating to CAP showed it to be mainly related to steatosis (τ = 0.38, P < 10-7), but also to BMI (τ = 0.22, P <
10-4), NASH (τ = 0.21, P < 10-3), fibrosis stage
(τ = 0.17, P < 0.01), and perisinusoidal fibrosis (τ = 0.23, P< 10-4). Activity was the only histological
parame-ter that was not included in the multivariate analy-sis since in univariate analyanaly-sis it was not shown to be associated with CAP (p = 0.80). Using multivari-ate analysis CAP was only associmultivari-ated with steatosis (P < 10-10) and perisinusoidal fibrosis (P = 0.002).
Given the association of both LSM and CAP with perisinusoidal fibrosis in the multivariate analyses, further analyses of this parameter were performed. Using univariate analysis, perisinu-soidal fibrosis was found to correlate with LSM (τ = 0.27, P < 10-4), CAP (τ = 0.27, P < 10-3),
fibrosis stage (τ = 0.23, P = 0.002), necro-inflam-matory activity (τ = 0.35, P < 10-5), ALT (τ = 0.17,
P = 0.02) and aspartate aminotransferase (AST; τ = 0.24, P < 10-3). Following multivariate analyses
associations were found with LSM (P = 0.03) and CAP (P = 0.003), and also (separate analyses) with steatosis (P = 0.05), and necro-inflammatory activity (P < 10-5).
Liver stiffness measurement and fibrosis assessment
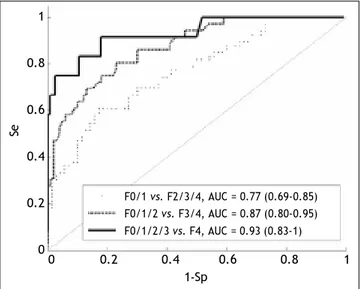
Box plots showing the distribution of LSM for each fibrosis stage are given in figure 2. The AUROCS for predicting significant fibrosis (F ≥ 2), advanced liver fibrosis (F ≥ 3) and cirrhosis (F = 4) are shown in table 3 and figure 3. Specificity,
sensi-tivity, PPV and NPV values are shown in table 3 for LSM cutoff values obtained for the study population with the internal validation performances.
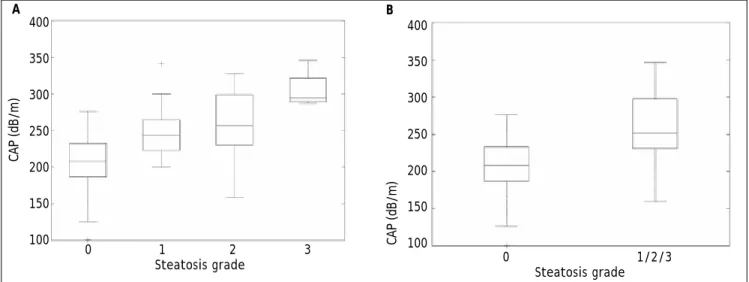
Controlled attenuation parameter and steatosis assessment
Box plots showing the distribution of CAP for each steatosis stage and for absent (S0) vs.
E (kPa)
50 45 40 35
30 25 20 15 10 5 0
0/1 2 3 4
Fibrosis stage (METAVIR)
Figure 2. Liver stiffness measurement distribution for
each fibrosis stage. The bottom and top of each box represent the 25th and 75th percentiles, line through the box indicates the median, and the bars indicate the 10th and 90th percenti-les. E: elasticity. +Indicates values smaller than the 10th per-centile or greater than the 90th perper-centile.
Se
1-Sp
0 0.2 0.4 0.6 0.8 1
1
0.8
0.6
0.4
0.2
0
F0/1 vs. F2/3/4, AUC = 0.77 (0.69-0.85) F0/1/2 vs. F3/4, AUC = 0.87 (0.80-0.95) F0/1/2/3 vs. F4, AUC = 0.93 (0.83-1)
Figure 3. Assessment of the liver stiffness measurement
A
CAP (dB/m)
400
350
300
250
200
150
100
0 1 2 3
Steatosis grade
400
350
300
250
200
150
100
B
0 1/2/3
Steatosis grade
Figure 4. Controlled attenuation parameter (CAP) distribution by individual (A) and combined (B) steatosis grade. The
bo-ttom and top of each box represent the 25th and 75th percentiles, line through the box indicates the median, and the bars indi-cate the 10th and 90th percentiles; +indicates values smaller than the 10th percentile or greater than the 90th percentile.
CAP (dB/m)
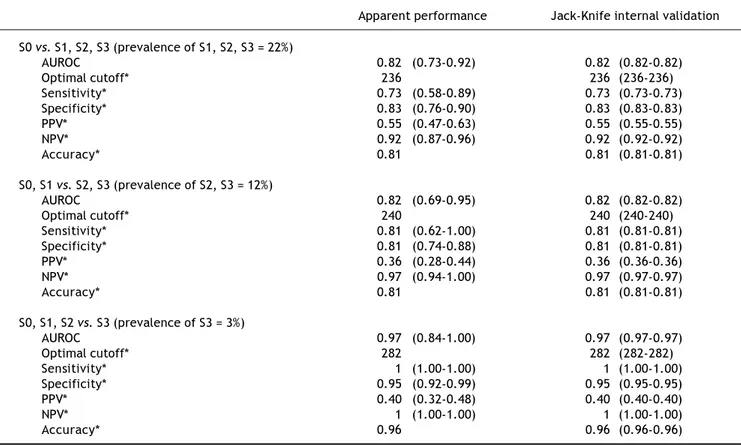
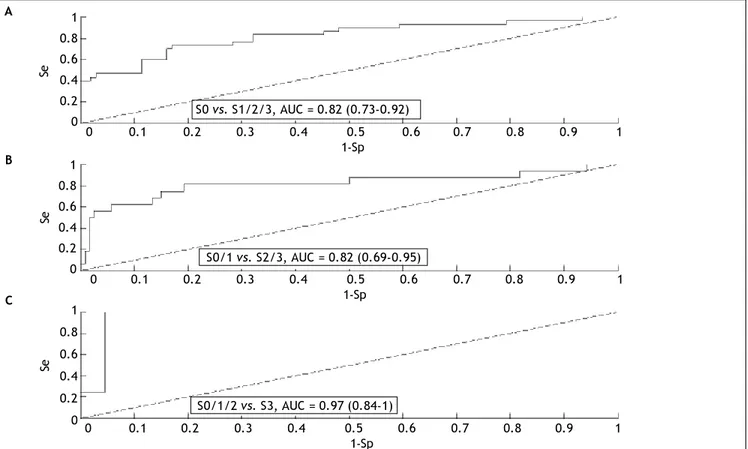
present (S1/S2/S3) steatosis are given in figure 4. The AUROCs for detecting mild (≥ S1), moderate (≥ S2) and severe (S3) steatosis are shown in table 4 and figure 5. Specificities, sensitivities, positive
and negative predictive values are shown in table 4 for optimal CAP cutoff values obtained on the study population with the internal validation per-formances.
Table 3. Apparent and validated performance (with confidence intervals) of liver stiffness measurementsfor determining fibrosis.
Apparent performance Jack-Knife internal validation
F0, F1 vs. F2, F3, F4 (prevalence of F2, F3, F4 = 49%)
AUROC 0.77 (0.69-0.85) 0.77 (0.77-0.77)
Optimal cutoff* 8.0 8.0 (8.0-8.0)
Sensitivity* 0.61 (0.49-0.72) 0.61 (0.61-0.61)
Specificity* 0.83 (0.74-0.92) 0.83 (0.83-0.83)
PPV* 0.77 (0.70-0.84) 0.77 (0.77-0.77)
NPV* 0.69 (0.61-0.77) 0.69 (0.69-0.69)
Accuracy* 0.72 0.72 (0.72-0.72)
F0, F1, F2 vs. F3, F4 (prevalence of F3, F4 = 26%)
AUROC 0.87 (0.80-0.95) 0.87 (0.87-0.87)
Optimal cutoff* 8.0 8.0 (8.0-8.0)
Sensitivity* 0.81 (0.68-0.93) 0.80 (0.80-0.81)
Specificity* 0.77 (0.69-0.85) 0.77 (0.77-0.77)
PPV* 0.56 (0.47-0.64) 0.56 (0.56-0.56)
NPV* 0.92 (0.87-0.96) 0.92 (0.92-0.92)
Accuracy* 0.78 0.78(0.78-0.78)
F0, F1, F2, F3 vs. F4 (prevalence of F4 = 9%)
AUROC 0.93 (0.83-1.00) 0.93 (0.93-0.93)
Optimal cutoff* 10.0 10.0 (9.9-10.1)
Sensitivity* 0.92 (0.76-1.00) 0.92 (0.91-0.92)
Specificity* 0.82 (0.76-0.89) 0.82 (0.82-0.83)
PPV* 0.33 (0.25-0.41) 0.34 (0.33-0.34)
NPV* 0.99 (0.97-1.00) 0.99 (0.99-0.99)
Accuracy* 0.83 0.83 (0.83-0.83)
Table 4. Apparent and validated performance (with confidence intervals) of the controlled attenuation parameter for
determi-ning steatosis.
Apparent performance Jack-Knife internal validation
S0 vs. S1, S2, S3 (prevalence of S1, S2, S3 = 22%)
AUROC 0.82 (0.73-0.92) 0.82 (0.82-0.82)
Optimal cutoff* 236 236 (236-236)
Sensitivity* 0.73 (0.58-0.89) 0.73 (0.73-0.73)
Specificity* 0.83 (0.76-0.90) 0.83 (0.83-0.83)
PPV* 0.55 (0.47-0.63) 0.55 (0.55-0.55)
NPV* 0.92 (0.87-0.96) 0.92 (0.92-0.92)
Accuracy* 0.81 0.81 (0.81-0.81)
S0, S1 vs. S2, S3 (prevalence of S2, S3 = 12%)
AUROC 0.82 (0.69-0.95) 0.82 (0.82-0.82)
Optimal cutoff* 240 240 (240-240)
Sensitivity* 0.81 (0.62-1.00) 0.81 (0.81-0.81)
Specificity* 0.81 (0.74-0.88) 0.81 (0.81-0.81)
PPV* 0.36 (0.28-0.44) 0.36 (0.36-0.36)
NPV* 0.97 (0.94-1.00) 0.97 (0.97-0.97)
Accuracy* 0.81 0.81 (0.81-0.81)
S0, S1, S2 vs. S3 (prevalence of S3 = 3%)
AUROC 0.97 (0.84-1.00) 0.97 (0.97-0.97)
Optimal cutoff* 282 282 (282-282)
Sensitivity* 1 (1.00-1.00) 1 (1.00-1.00)
Specificity* 0.95 (0.92-0.99) 0.95 (0.95-0.95)
PPV* 0.40 (0.32-0.48) 0.40 (0.40-0.40)
NPV* 1 (1.00-1.00) 1 (1.00-1.00)
Accuracy* 0.96 0.96 (0.96-0.96)
* Given for the maximum Youden index. AUROC: area under the receiver operating characteristic curve. PPV: positive predictive value. NPV: negative predictive value.
Steatosis quantification using controlled attenuation parameter
ROC curves and the corresponding AUROCs were calculated to assess the ability of the CAP to differ-entiate between grades of steatosis. This analysis suggests that CAP performance is:
• Excellent in differentiating between S0/S3 grades (AUROC = 1 [1-1]).
• Good at differentiating between S1/S3 (AUROC = 0.89 [0.85-0.93]) and S0/S1 grades (AUROC = 0.80 [0.75–0.86]), but is
• Poor at differentiating between S0/S2 (AUROC = 0.78 [0.73–0.84]), S2/S3 (AUROC = 0.75 [0.69– 0.81]), and S1/S2 (AUROC = 0.59 [0.52–0.66]) grades.
DISCUSSION
This study is the first one in HBV patients that evaluates steatosis by CAP in a predominantly non-Asian population, mostly HBeAg-negative subjects.
Furthermore, it demonstrates that in patients with CHB, CAP correlates with steatosis, which can be detected with good accuracy. In accordance with studies recently published, it demonstrates that in patients with CHB, CAP is correlated with steatosis which can be detected with good diagnostic accura-cy and can be applied worldwide to better detect st-eatosis.36,37 Additionally, the FibroScan® test can be
used to non-invasively and simultaneously assess not only steatosis (using CAP) but also fibrosis (using LSM). While LSM correlated with fibrosis in both the univariate (P < 10-10) and multivariate
(P < 10-8) analyses, it only correlated with steatosis
in the univariate analysis (P < 10-3) and to a lesser
extent than fibrosis. Likewise, CAP correlated with steatosis in both the univariate (P < 10-7) and
mul-tivariate analyses (P < 10-10), but only correlated
with fibrosis in the univariate analysis (P < 0.01) and to a lesser extent than steatosis.
in the multivariate analysis. This is of potential in-terest as in non-alcoholic fatty liver disease of viral origin, fibrosis may originate from the sinusoids and perisinusoidal space.38,39 While no association was
found between perisinusoidal fibrosis and parame-ters reflecting metabolic disorders, this could be due to the small size of these datasets within this study rather than a lack of association. Hence, additional studies could prove beneficial.
Our previous study validating the use of the Fi-broScan® test to detect fibrosis via LMS have in-cluded investigation of patients with CHB. This study compared the performance of the technique in patients with CHB or hepatitis C found AUROCs for detecting significant fibrosis and cirrhosis of 0.87 and 0.94 in the 202 patients with CHB.21 Similarly,
in a study of 173 patients with CHB the AUROCs for detecting significant fibrosis and cirrhosis were 0.81 and 0.93, respectively.29 In this study the
AU-ROC for detecting significant fibrosis was 0.77 and cirrhosis was 0.93.
The diagnostic accuracy of LSM for detecting fi-brosis was good with the greatest ability to predict
cirrhosis (F4 vs. F0, F1, F2, F3): sensitivity, 0.92; specificity 0.82; PPV, 0.33; NPV 0.99. For compari-son, the corresponding sensitivity, specificity, PPV, and NPV for significant fibrosis (F ≥ 2) were 0.61, 0.83, 0.77, and 0.69, respectively. These find-ings were similar to those previously determined in patients with CHB: sensitivity, 0.75; specificity 0.90; PPV, 0.39; NPV 0.98 for F4 vs. F0, F1, F2, F3 and 0.74, 0.88, 0.82, and 0.82, for F ≥ 2.21
Overall, the data generated in the current study confirm those reported previously and add to the literature supporting LSM via the FibroScan® test as an effective non-invasive method for assessing fibrosis.20
CAP has been studied previously in patients with chronic liver disease of various etiologies or caused by hepatitis C and B. While a direct comparison be-tween all studies is not possible due to the differenc-es between populations, an indication of overall effectiveness can be determined.
The AUROC for detecting mild steatosis (≥ S1) ranged from 0.81-0.91 in studies of general liver dis-ease,23-25 and was reported as 0.80 for patients with
A
B
C
Figure 5. Receiver operating characteristics curves (ROC) and area under the ROC curve (AUC) between steatosis grades.
Se: sensitivity. Sp: specificity.
Se
Se
Se
1 0.8 0.6 0.4 0.2 0 1 0.8 0.6 0.4 0.2 0 1 0.8 0.6 0.4 0.2 0
0 0.1 0.2 0.3 0.4 0.5 0.6 0.7 0.8 0.9 1
1-Sp
0 0.1 0.2 0.3 0.4 0.5 0.6 0.7 0.8 0.9 1
1-Sp S0 vs. S1/2/3, AUC = 0.82 (0.73-0.92)
S0/1 vs. S2/3, AUC = 0.82 (0.69-0.95)
S0/1/2 vs. S3, AUC = 0.97 (0.84-1)
0 0.1 0.2 0.3 0.4 0.5 0.6 0.7 0.8 0.9 1
chronic hepatitis C.26 These figures compare
favora-bly with the AUROC for steatosis ≥ S1 found in this study of patients with CHB, which was 0.82, and suggest good efficacy for detecting steatosis. In gen-eral, similar values have been observed for detecting moderate steatosis while the AUROC for severe stea-tosis ranged from 0.70-0.9323-25 in patients with
gen-eral liver disease, 0.88 in patient with chronic hepatitis C26 and 0.97 in patients with CHB (this
study).
In terms of diagnostic accuracy, CAP was found to have a high NPV in all studies to date suggesting its use as an effective screening device. The NPV in the current study was 0.92, 0.97, and 1.00 for S ≥ 1, ≥ 2, and S3, respectively, while in patients with chronic hepatitis C it was found to be 0.79 for S ≥ 1 but 0.98 for S = 3.26 In patients with liver disease of
any etiology, NPV was ≥ 0.87,23 ≥ 0.81,24 and ≥
0.64,25 depending on the study.
In 2014, de Lédinghen, et al. showed in a study with 5323 examinations of patients with mixed causes of chronic liver diseases, of whom 7.5% with CHB, that CAP has a strong association with metabolic syndrome and alcohol use, that could be of interest in the follow-up of NAFLD or alcoholic patients.40
In a Chinese study with 88 chronic hepatitis B patients a positive correlation was observed between the AUROC of CAP and liver pathological stage (r = 0.582, p < 0.05). CAP was not correlated with inflammation and fibrosis degree (r = -0.025, p > 0.05; r = 0. 068, p > 0.05).36 Mi, et al. evaluated
340 patients, mainly HBe positive, and observed that CAP could detect the different grades of steatosis with good AUROC. Furthermore, the LSM and fi-brosis and activity grades on biopsy did not influ-ence the CAP performance. CAP correlated with the BMI and steatosis grade according to the multivari-ate analysis (both p < 0.001). Interestingly, as in our study, the prevalence of severe steatosis and st-eatohepatitis in Chinese studies was low in patients with CHB.37
The ability of CAP to differentiate between differ-ent steatosis grades was also assessed and in pa-tients with CHB was found to be excellent in differentiating between S0/S3 grades, good at differ-entiating between S1/S3 and S0/S1 grades, but poor at differentiating between S0/S2, S2/S3, and S1/S2 grades. These results are in agreement with previ-ous findings that suggested the method was good at differentiating more extreme grades but poor at dif-ferentiating between adjacent grades.23-26 These
results warrant further investigation, particularly in patients with CHB, as good differentiation
between S0/S1 and S2/S3 would be advantageous for a screening tool.
Although LB remains the gold standard for as-sessing steatosis it is subject to limitations as dis-cussed briefly in the introduction.19,20 Most
importantly, due to the invasive nature of the tech-nique it cannot be performed on all patients, repeat-ed regularly or usrepeat-ed as a screening tool. Hence, other non-invasive methods have been developed to diagnose steatosis.20,41-44 Of the imaging techniques,
ultrasonography is the most frequently used for liv-er imaging and steatosis can be assessed by compar-ing parenchymal echogenicity with kidney echogenicity.41,44,45 However, use of this method for
assessing steatosis in clinical practice is controver-sial as it is highly operator and machine depend-ent.41,44-46 Other imaging techniques can also detect
steatosis, but have limitations such as being ionis-ing (CT), lackionis-ing sensitivity and specificity,41,44,45
lacking validation or standardization (MRI and magnetic resonance spectroscopy),44,47,48 and/or
be-ing costly.44,49 Similarly, the use of serum markers
for predicting steatosis has been investigated, but found to have low performance.42-44,50
In conclusion, CAP seems to be a a novel, accu-rate, non-invasive tool to detect and quantify steato-sis in patients with CHB from different geographic regions. The advantages of CAP are that it is non-invasive, non-ionising, inexpensive, machine and op-erator independent, easy to perform, provides immediate results, and can be assessed simultane-ously with evaluating fibrosis. Furthermore, the CAP test shows good diagnostic accuracy for steato-sis in CHB and accurately differentiates between S0/ S3, S1/S3, and S0/S1 grades.
ABBREVIATIONS
• AUROC: area under the receiver operating
char-acteristics.
• BMI: body mass index.
• CAP: controlled attenuation parameter.
• CHB: chronic hepatitis B.
• CT: computed tomography.
• HBeAg: hepatitis B ‘e’ antigen.
• HBsAg: hepatitis B surface antigen.
• HBV: hepatitis B virus.
• HCC: hepatocellular carcinoma. • LB: liver biopsy.
• LSM: liver stiffness measurements.
• MRI: magnetic resonance imaging.
• NPV: negative predictive value.
• TE: transient elastography.
• VCTETM: vibration-controlled transient
elas-tography.
CONFLICT OF INTERESTS
Ana-Carolina Cardoso, Michel Beaugrand, Cather-ine Douvin, Raoul Poupon, Jean-Claude Trinchet and Pierre Bedossa have no conflicts of interest to declare. Victor de Ledinghen is a consultant for Echosens. Marianne Ziol has received a research grant from Echosens. Patrick Marcellin has received grants from and acted as an investigator, speaker and expert for BMS, Gilead, Janssen-Tibotec, MSD, Novartis and Roche; he has also acted as an investigator and expert for Abbott and Vertex, as an investigator for Boe-hringer Ingelheim and Pfizer, and has received grants and acted as an investigator for Alios BioPharma.
FINANCIAL SUPPORT
None.
CONTRIBUTORS
Ana-Carolina Cardoso: study concept and design, acquisition of data, statistical analysis, analysis and interpretation of data, drafting, finalizing the arti-cle, critical revision of draft of artiarti-cle, approval of fi-nal version.
Michel Beaugrand, Victor de Ledinghen, Cather-ine Douvin, Raoul Poupon, Jean-Claude Trinchet: acquisition of data, critical revision of draft of arti-cle, approval of final version.
Marianne Ziol, Pierre Bedossa: analysis and in-terpretation of data, critical revision of draft of arti-cle, approval of final version.
Patrick Marcellin: study concept and design, study supervision, analysis and interpretation of data, critical revision of draft of article, approval of final version.
ACKNOWLEDGMENTS
The authors thank the staff at Echosens for tech-nical support.
REFERENCES
1. Petta S, Craxì A. Hepatocellular carcinoma and non-alcoho-lic fatty liver disease: from a clinical to a molecular asso-ciation. Curr Pharm Des 2010; 16: 741-52.
2. Adinolfi LE, Gambardella M, Andreana A, Tripodi MF, Utili R, Ruggiero G. Steatosis accelerates the progression of liver
damage of chronic hepatitis C patients and correlates with specific HCV genotype and visceral obesity.
Hepato-logy 2001; 33: 1358-64.
3. Castéra L, Hézode C, Roudot-Thoraval F, Bastie A, Zafrani ES, Pawlotsky JM, Dhumeaux D. Worsening of steatosis is an independent factor of fibrosis progression in untrea-ted patients with chronic hepatitis C and paired liver biopsies. Gut 2003; 52: 288-92.
4. Fartoux L, Chazouillères O, Wendum D, Poupon R, Serfaty L. Impact of steatosis on progression of fibrosis in pa-tients with mild hepatitis C. Hepatology 2005; 41: 82-7. 5. Ohata K, Hamasaki K, Toriyama K, Matsumoto K, Saeki A,
Yanagi K, Abiru S, et al. Hepatic steatosis is a risk factor for hepatocellular carcinoma in patients with chronic he-patitis C virus infection. Cancer 2003; 97: 3036-43. 6. Kurosaki M, Hosokawa T, Matsunaga K, Hirayama I,
Ta-naka T, Sato M, Yasui Y, et al. Hepatic steatosis in chro-nic hepatitis C is a significant risk factor for developing hepatocellular carcinoma independent of age, sex, obesi-ty, fibrosis stage and response to interferon therapy.
He-patol Res 2010; 40: 870-7.
7. Poynard T, Ratziu V, McHutchison J, Manns M, Goodman Z, Zeuzem S, Younossi Z, et al. Effect of treatment with pegin-terferon or inpegin-terferon alfa-2b and ribavirin on steatosis in pa-tients infected with hepatitis C. Hepatology 2003; 38: 75-85. 8. Harrison SA, Brunt EM, Qazi RA, Oliver DA,
Neuschwander-Tetri BA, Di Bisceglie AM, Bacon BR. Effect of significant histologic steatosis or steatohepatitis on response to an-tiviral therapy in patients with chronic hepatitis C. Clin
Gastroenterol Hepatol 2005; 3: 604-9.
9. Kao JH, Chen PJ, Chen DS. Recent advances in the resear-ch of hepatitis B virus-related hepatocellular carcinoma: epidemiologic and molecular biological aspects. Adv
Can-cer Res 2010; 108: 21-72.
10. Jin X, Chen YP, Yang YD, Li YM, Zheng L, Xu CQ. Associa-tion between hepatic steatosis and entecavir treatment failure in Chinese patients with chronic hepatitis B. PLoS
ONE 2012; 7: e34198.
11. Lesmana LA, Lesmana CR, Pakasi LS, Krisnuhoni E. Preva-lence of hepatic steatosis in chronic hepatitis B patients and its association with disease severity. Acta Med
Indo-nes 2012; 44: 35-9.
12. Ates F, Yalniz M, Alan S. Impact of liver steatosis on res-ponse to pegylated interferon therapy in patients with chronic hepatitis B. World J Gastroenterol 2011; 17: 4517-22.
13. Nomura H, Kashiwagi S, Hayashi J, Kajiyama W, Tani S, Goto M. Prevalence of fatty liver in a general population of Okinawa, Japan. Jpn J Med 1988; 27: 142-9.
14. Bellentani S, Saccoccio G, Masutti F, Crocè LS, Brandi G, Sasso F, Cristanini G, et al. Prevalence of and risk factors for hepatic steatosis in Northern Italy. Ann Intern Med 2000; 132: 112-7.
15. Browning JD, Szczepaniak LS, Dobbins R, Nuremberg P, Horton JD, Cohen JC, Grundy SM, et al. Prevalence of he-patic steatosis in an urban population in the United Sta-tes: impact of ethnicity. Hepatology 2004; 40: 1387-95. 16. Persisco M, Iolascon A. Steatosis as a co-factor in chronic
liver diseases. World J Gastroenterol 2010; 16: 1171-6. 17. Fung J, Yuen MF, Lai CL. The role of steatosis in HBsAg
se-roclearance for patients with chronic hepatitis B infec-tion: fact or fiction? Dig Dis Sci 2013; 58: 20-2.
18. Vere CC, Neagoe D, Streba CT, Prejbeanu I, Ianosi G, Comanescu V, Pirici D. Steatosis and serum lipid patterns in patients with chronic viral hepatitis: differences related to viral etiology. Rom J Morphol Embryol 2010; 51: 509-14.
>
,
19. Regev A, Berho M, Jeffers LJ, Milikowski C, Molina EG, Pyr-sopoulos NT, Feng ZZ, et al. Sampling error and intraobser-ver variation in liintraobser-ver biopsy in patients with chronic HCV infection. Am J Gastroenterol 2002; 97: 2614-8.
20. Cardoso AC, Carvalho-Filho RJ, Marcellin P. Transient elas-tography in chronic viral hepatitis: a critical appraisal.
Gut 2011; 60: 759-64.
21. Cardoso AC, Carvalho-Filho RJ, Stern C, Dipumpo A, Giuily N, Ripault MP, Asselah T, et al. Direct comparison of diag-nostic performance of transient elastography in patients with chronic hepatitis B and chronic hepatitis C. Liver Int 2012; 32: 612-21.
22. Sandrin L, Fourquet B, Hasquenoph JM, Yon S, Fournier C, Mal F, Christidis C, et al. Transient elastography: a new noninvasive method for assessment of hepatic fibrosis.
Ul-trasound Med Biol 2003; 29: 1705-13.
23. Sasso M, Beaugrand M, de Ledinghen V, Douvin C, Marce-llin P, Poupon R, Sandrin L, et al. Controlled attenuation parameter (CAP): a novel VCTE™ guided ultrasonic atte-nuation measurement for the evaluation of hepatic stea-tosis: preliminary study and validation in a cohort of patients with chronic liver disease from various causes.
Ultrasound Med Biol 2010; 36: 1825-35.
24. de Lédinghen V, Vergniol J, Foucher J, Merrouche W, le Bail B. Non-invasive diagnosis of liver steatosis using con-trolled attenuation parameter (CAP) and transient elasto-graphy. Liver Int 2012; 32: 911-8.
25. Myers RP, Pollett A, Kirsch R, Pomier-Layrargues G, Beaton M, Levstik M, Duarte-Rojo A, et al. Controlled Attenuation Parameter (CAP): a noninvasive method for the detection of hepatic steatosis based on transient elastography.
Li-ver Int 2012; 32: 902-10.
26. Sasso M, Tengher-Barna I, Ziol M, Miette V, Fournier C, Sandrin L, Poupon R, et al. Novel controlled attenuation parameter for noninvasive assessment of steatosis using Fibroscan®: validation in chronic hepatitis C. J Viral
He-pat 2012; 19: 244-53.
27. Ziol M, Handra-Luca A, Kettaneh A, Christidis C, Mal F, Kazemi F, de Lédinghen V, et al. Noninvasive assess-ment of liver fibrosis by measureassess-ment of stiffness in pa-tients with chronic hepatitis C. Hepatology 2005; 41: 48-54.
28. Corpechot C, El Naggar A, Poujol-Robert A, Ziol M, Wendum D, Chazouillères O, de Lédinghen V, et al. Assessment of biliary fibrosis by transient elastography in patients with PBC and PSC. Hepatology 2006; 43: 1118-24.
29. Marcellin P, Ziol M, Bedossa P, Douvin C, Poupon R, de Lé-dinghen V, Beaugrand M. Non-invasive assessment of liver fibrosis by stiffness measurement in patients with chronic hepatitis B. Liver Int 2009; 29: 242-7.
30. de Lédinghen V, Douvin C, Kettaneh A, Ziol M, Roulot D, Marcellin P, Dhumeaux D, et al. Diagnosis of hepatic fibro-sis and cirrhofibro-sis by transient elastography in HIV/hepati-tis C virus-coinfected patients. J Acquir Immune Defic
Syndr 2006; 41: 175-9.
31. Nahon P, Kettaneh A, Tengher-Barna I, Ziol M, de Léding-hen V, Douvin C, Marcellin P, et al. Assessment of liver fi-brosis using transient elastography in patients with alcoholic liver disease. J Hepatol 2008; 49: 1062-8. 32. Bedossa P, Poynard T. An algorithm for the grading of
acti-vity in chronic hepatitis C. The METAVIR Cooperative Stu-dy Group. Hepatology 1996; 24: 289-93.
33. Bedossa P, Poitou C, Veyrie N, Bouillot JL, Basdevant A, Paradis V, Tordjman J, et al. Histopathological algorithm and scoring system for evaluation of liver lesions in morbi-dly obese patients. Hepatology 2012; 56: 1751-9.
34. Hanley JA, McNeil BJ. The meaning and use of the area un-der a receiver operating characteristic (ROC) curve.
Ra-diology 1982; 143: 29-36.
35. Steyerberg EW, Harrell FE Jr, Borsboom GJ, Eijkemans MJ, Vergouwe Y, Habbema JD. Internal validation of pre-dictive models: efficiency of some procedures for logis-tic regression analysis. J Clin Epidemiol 2001; 54: 774-81.
36. Wang CY, Lu W, Hu DS, Wang GD, Cheng XJ. Diagnostic value of controlled attenuation parameter for liver stea-tosis in patients with chronic hepatitis B. World J
Gas-troenterol 2014; 20: 10585-90.
37. Mi YQ1, Shi QY, Xu L, Shi RF, Liu YG, Li P, Shen F, et al. Controlled Attenuation Parameter for Noninvasive Asses-sment of Hepatic Steatosis Using Fibroscan®: Validation in Chronic Hepatitis B. Dig Dis Sci 2014 [Epub ahead of print].
38. Liu J, Yan J, Ma Y. Disorders of hepatic sinusoids and pe-risinusoidal space in chronic viral hepatitis B and its rela-tionship to hepatic fibrosis. Zhonghua Gan Zang Bing Za
Zhi 2000; 8: 206-08 [article in Chinese].
39. Shi J, Hao JH, Ren WH, Zhu JR, Wang SY, Xie YB. Pathoge-nesis of liver fibrosis in patients with chronic hepatitis B.
Zhonghua Gan Zang Bing Za Zhi 2009; 17: 443-445 [article
in Chinese].
40. de Lédinghen V, Vergniol J, Capdepont M, Chermak F, Hi-riart JB, Cassinotto C, Merrouche W, et al. Controlled at-tenuation parameter (CAP) for the diagnosis of steatosis: a prospective study of 5323 examinations. J Hepatol 2014; 60: 1026-31.
41. Schwenzer NF, Springer F, Schraml C, Stefan N, Machann J, Schick F. Non-invasive assessment and quantification of liver steatosis by ultrasound, computed tomography and magnetic resonance. J Hepatol 2009; 51: 433-45.
42. Poynard T, Ratziu V, Naveau S, Thabut D, Charlotte F, Messous D, Capron D, et al. The diagnostic value of bio-markers (SteatoTest) for the prediction of liver steatosis.
Comp Hepatol 2005; 4: 10.
43. Bedogni G, Bellentani S, Miglioli L, Masutti F, Passalacqua M, Castiglione A, Tiribelli C. The Fatty Liver Index: a sim-ple and accurate predictor of hepatic steatosis in the ge-neral population. BMC Gastroenterol 2006; 6: 33.
44. Boursier J, Calès P. Controlled attenuation parameter (CAP): a new device for fast evaluation of liver fat? Liver
Int 2012; 32: 875-7.
45. Mehta SR, Thomas EL, Bell JD, Johnston DG, Taylor-Robin-son SD. Non-invasive means of measuring hepatic fat con-tent. World J Gastroenterol 2008; 14: 3476-83.
46. Lee SS, Park SH, Kim HJ, Kim SY, Kim MY, Kim DY, Suh DJ, et al. Non-invasive assessment of hepatic steatosis: pros-pective comparison of the accuracy of imaging examina-tions. J Hepatol 2010; 52: 579-85.
47. McPherson S, Jonsson JR, Cowin GJ, O’Rourke P, Clouston AD, Volp A, Horsfall L, et al. Magnetic resonance imaging and spectroscopy accurately estimate the severity of steatosis provided the stage of fibrosis is considered. J
Hepatol 2009; 51: 389-97.
48. Guiu B, Loffroy R, Hillon P, Petit JM. Magnetic resonance imaging and spectroscopy for quantification of hepatic steatosis: urgent need for standardization! J Hepatol 2009; 51: 1082-3.
49. Clark JM, Brancati FL, Diehl AM. Nonalcoholic fatty liver disease. Gastroenterology 2002; 122: 1649-57.