The performance of prognostic models as predictors of
mortality in patients with acute decompensation of cirrhosis
Leonardo Fayad,* Janaína Luz Narciso-Schiavon,* César Lazzarotto,* Marcelo Fernando Ronsoni,* Letícia Muraro Wildner,** Maria Luiza Bazzo,** Leonardo de Lucca Schiavon,* Esther Buzaglo Dantas-Corrêa*
* Department of Internal Medicine, Division of Gastroenterology, ** Department of Clinical Analysis, Federal University of Santa Catarina (UFSC). Brazil.
ABSTRACT
Background. Although several prognostic models have been proposed for cirrhotic patients listed for transplantation, the performance of these scores as predictors of mortality in patients admitted for acute decompensation of cirrhosis has not been satisfactorily investigated. Aims. To study MELD, MELD-Na, MESO, iMELD, Refit-MELD and Refit MELD-Na models as prognostic predictors in cirrhotic patients admitted for acute decompensation, and to compare their performance between admission and 48 hours of hospi-talization to predict in-hospital mortality. Material and methods. This cohort study included cirrhotic pa-tients admitted to hospital due to complications of the disease. Individuals were evaluated on admission and after 48 h of hospitalization, and mortality was evaluated during the present admission. Results. One hundred and twenty-three subjects with a mean age of 54.26 ± 10.79 years were included; 76.4% were male. Mean MELD score was 16.43 ± 7.08 and 52.0% of patients were Child-Pugh C. Twenty-seven patients (22.0%) died during hospitalization. Similar areas under the curve (AUROCs) for prognosis of mortality were observed when different models were compared on admission (P > 0.05) and after 48 h of hospitalization (P > 0.05). When models executed after 48 h of hospitalization were compared to their corresponding model calculated on admission, significantly higher AUROCs were obtained for all models (P < 0.05), except for MELD-Na (P = 0.075) and iMELD (P = 0.119). Conclusion. The studied models showed similar accuracy as pre-dictors of in-hospital mortality in cirrhotic patients admitted for acute decompensation. However, the per-formance of these models was significantly better when applied 48 h after admission when compared to their calculation on admission.
Key words. Liver cirrhosis. Mortality. Survival. Prognosis. MELD.
Correspondence and reprint request: Janaína Luz Narciso-Schiavon, MD, PhD.
Departamento de Clínica Médica. Hospital Universitário Polydoro Ernani de São Thiago (UFSC), 3º andar.
Rua Professora Maria Flora Pausewang s/no, Trindade, Florianópolis–SC, 88040-900, Brazil.
Phone: (+55 48) 37219149. Fax: (+55 48) 37219014. E-mail: janaina.narciso@uol.com.br
Manuscript received: February 28, 2014. Manuscript accepted: August 8, 2014.
BACKGROUND
Liver fibrosis stage is probably the most robust
prognostic factor in several liver diseases.1
Cirrho-sis is the end-stage of every chronic liver disease.2
Its natural history is characterized by an asympto-matic phase, named “compensated cirrhosis”, and followed by the development of complications of portal hypertension and/or liver dysfunction,
named “decompensated cirrhosis”.3 Decompensated
cirrhosis is defined by the presence of ascites, variceal bleeding, encephalopathy, and/or
jaun-dice.4 Transition from a compensated to a
decom-pensated stage occurs at a rate of approximately
11% per year.5 Ten years after diagnosis, the
prob-ability of developing decompensated cirrhosis is 58%, whereas ascites is the most frequent
compli-cation (47%).6 Once patients have developed the
first episode of decompensation, life expectancy is
markedly reduced.7 The course of cirrhosis is
ex-tremely variable from patient to patient due to sev-eral factors. Hence, it is very difficult to define prognosis in individuals with end-stage liver
dis-ease.8
in patients undergoing surgery for portal hyper-tension and transjugular intrahepatic
portosys-temic shunts, respectively.9-11 The name
“Child-Pugh” refers to a currently applied
modi-fied score system from the original CTP.12 Many
known limitations of the Child-Pugh score exist, including the reliance on subjective interpretation of qualitative variables and the empirical choice of
the five variables.13
MELD score is based on bilirubin, international normalized ratio (INR) and creatinine. The three variables were selected based on statistical analysis rather than by empirical means, as with the
Child-Pugh score.14 MELD score became a reliable marker
of early mortality and has been adopted for organ al-location to patients listed for liver transplantation in the United States since 2002 and in Brazil since
2006.14-16
The MELD score-Na (MELD-Na) incorporated serum sodium (SNa) into the equation by adding additional scores to the original MELD in patients with SNa between 120 mEq/L and 134 mEq/L. Re-cent studies have shown that the incorporation of SNa to MELD calculations can improve the predic-tion of short-term mortality in patients with
cir-rhosis.17-20
Posteriorly, further studies also assessed the prognosis of cirrhotic patients with MELD-based models, such as iMELD (integrated MELD) and MESO index (MELD to sodium index), and likewise, both scores included the SNa within their equations
to improve their prognostic power.21,22 Additional
modifications of the MELD score were proposed for
optimization of the model.23 These versions, called
Refit MELD and Refit MELDNa, incorporate coeffi-cients and restore lower and upper bounds for the variables MELD and MELD-Na, respectively. Refit MELD and Refit MELDNa have been shown to be more efficient than the original model as prognostic predictors in patients listed for liver
transplanta-tion.23
Although several prognostic models have been proposed for cirrhotic patients on the transplanta-tion list, the performance of these scores as pre-dictors of mortality in patients admitted for acute decompensation of cirrhosis has not been satisfacto-rily investigated. The aim of this study was to eval-uate the models MELD, MELD-Na MESO, iMELD, Refit MELD, and Refit MELD-Na as prognostic predictors of in-hospital mortality in cirrhotic pa-tients admitted for acute decompensation, and to compare their performance on admission and 48 h after admission.
MATERIAL AND METHODS
Patients
This cohort study included consecutive patients admitted to the emergency department of a tertiary Brazilian hospital for acute decompensation of liver cirrhosis. Acute decompensation was defined by the acute development of hepatic encephalopathy, large ascites, gastrointestinal bleeding, bacterial infection, or any combination of these. Exclusion criteria from this study included the following: individuals admit-ted for elective procedures, admissions unrelaadmit-ted to liver cirrhosis complications or those that lasted less than 48 h, absence of laboratory tests for calculating the prognostic models at admission and/or 48 h after, and refusal from patient or caregiver or inability to understand the terms of the informed consent. If a patient was admitted more than once during the study period, only the most recent was considered.
Diagnosis of cirrhosis was established histologi-cally (when possible), or clinihistologi-cally by combining im-aging, clinical, and laboratorial findings, as well as evidence of portal hypertension.
The study protocol was approved by the Ethics Committee on Human Research of the Federal Uni-versity of Santa Catarina (UFSC).
Procedures
Individuals with suspected infection at hospital admission were submitted to clinical examination to confirm this diagnosis and to establish the primary source of infection. A diagnostic paracentesis was performed in all patients with ascites at admission. Spontaneous bacterial peritonitis (SBP) was diag-nosed when the neutrophil count of the ascitic fluid
was ≥ 250 neutrophils/mm3 in the absence of
intra-abdominal source of infection, regardless of negative
culture.24 All patients with SBP received ceftriaxone
plus weight-based intravenous albumin in the first and third day after the diagnosis. Hepatic encepha-lopathy was graded according to the West-Haven criteria (and, if present, a precipitant event was ac-tively investigated, lactulose was initiated, and the
dose adjusted as needed).25 All subjects with acute
propranolol (if not contra-indicated) was started on the 6th day of hospitalization, and the patients were scheduled for follow-up endoscopies with band
liga-tion.26 All patients were initially admitted in the
emergency room. The decision to transfer the pa-tient to the ward or the intensive care unit (ICU) was made at the discretion of the attending physi-cian according to the severity of the acute decom-pensation.
Patients were evaluated within the first 12 h of admission by one of the involved researchers, and the following clinical variables were collected: age, gender, etiology of cirrhosis, and current and previ-ous decompensation. Current alcoholism was de-fined as an average consumption of 21 or more alcoholic drinks per week for men and 14 or more alcoholic drinks per week for women during 4 weeks prior to inclusion in the study (a standard dose of alcohol is equivalent to 12 g of absolute
alco-hol).27 All patients underwent laboratory evaluation
within 12 h of hospital admission and 48 h after ad-mission, and the following variables were considered for the study: creatinine, sodium, total bilirubin and INR. Patients were observed during hospitalization for definition of the studied outcome (in-hospital mortality). CTP classification was used for
charac-terization of the patients.28
Prognostic models
The following prognostic models were calculated based on tests performed on admission and 48 h
af-ter admission: MELD,29 MELD-Na,30 MESO,21
iMELD,22 Refit MELD, and Refit MELD-Na.23 See
annex 1 for calculation formula of prognostic models.
Statistical analysis
Kolmogorov-Smirnov Testing was performed to evaluate the normality of the distribution of each variable. Continuous variables were compared using the Student’s “t” test, for normal distributions, or Mann-Whitney, for the remaining cases. Categorical variables were evaluated using a chi-square or Fish-er’s exact test as needed. The accuracy of prognostic models was analyzed by receiver operating charac-teristics (ROC) curves and by calculating the sensi-tivity, specificity, and positive and negative predictive values for the chosen cutoffs. Compari-sons of ROC curves were performed by MedCalc soft-ware version 12.4 (MedCalc Softsoft-ware, Mariakerke, Belgium) by the technique described by Hanley &
McNeil.31 Calibration of the models was assessed by
the Hosmer-Lemeshow goodness-of-fit test. All the remaining tests were two-tailed and were performed by the statistical software SPSS, version 17.0
(SPSS, Chicago, IL, USA). P-Values of less than
0.05 were considered statistically significant.
RESULTS
Patient characteristics
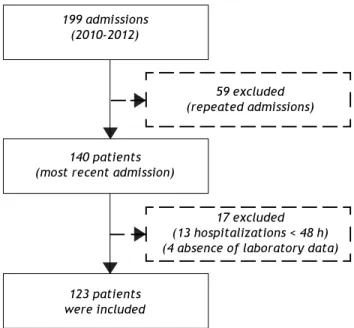
From December 2010 to November 2012, 199 ad-missions for acute decompensation of liver cirrhosis were performed. However, some patients had more than one hospitalization during the study period and, in this case, only the most recent admission was considered. Though, 140 patients were evaluat-ed for inclusion. Thirteen patients who remainevaluat-ed hospitalized for less than 48 h were excluded. Also, an additional four individuals were excluded due to absence of laboratory tests. Thus, 123 patients were eligible for the study (Figure 1).
The included patients had a mean age of 54.26 ± 10.79 years, and were mostly male (76.4%) and Cau-casian (56.9%). Current alcohol consumption was reported by 42.3% of patients. The main causes of liver cirrhosis were hepatitis C virus and alcohol in 50 (40.7%) and 49 (39.8%) patients, respectively. Previous episodes of decompensated liver disease was reported by 79 patients (64.2%), and 52.0% were classified as Child-Pugh C.
Figure 1. Flow diagram of the potential candidates for participation in the study, reason for exclusions, and subjects enrolled.
199 admissions (2010-2012)
59 excluded (repeated admissions)
140 patients (most recent admission)
17 excluded (13 hospitalizations < 48 h) (4 absence of laboratory data)
Table 1. Characteristics of 123 individuals admitted for acute decompensation of liver cirrhosis.
All Surviving Dead P
(n = 123) (n = 96) (n = 27)
Mean age (years) 54.26 53.53 52.30
± SD ± 10.79 ± 10.94 ± 10.39
Male, n (%) 94 (76.4%) 73 (76.0%) 21 (77.8%) 0.851
Cause of cirrhosis, n (%)
HCV 50 (40.7%) 39 (40.6%) 11 (40.7%) 0.991
HBV 4 (3.3%) 4 (4.2%) 0 (0%) 0.575
Alcohol 49 (39.8%) 35 (36.5%) 14 (51.9%) 0.149
Cryptogenic 7 (5.7%) 7 (7.3%) 0 (0%) 0.346
Other 13 (10.6%) 11 (11.5%) 2 (7.4%) 0.731
First decompensation, n (%) 44 (35.8%) 34 (35.4%) 10 (37.0%) 0.877
Current alcoholism, n (%) 52 (42.3%) 37 (38.5%) 15 (55.6%) 0.114
Current ascites, n (%) 64 (52.0%) 40 (41.7%) 24 (88.9%) < 0.001 Gastrointestinal bleeding, , n (%) 70 (56.9%) 58 (60.4%) 12 (44.4%) 0.139 Hepatic encephalopathy, n (%) 77 (62.6%) 55 (57.3%) 22 (81.5%) 0.022
SBP, n (%) 19 (15.4%) 10 (10.4%) 9 (33.3%) 0.007
Other infections, n (%) 21 (17.1%) 13 (13.5%) 8 (29.6%) 0.079
Creatinine (mg/dL), median 1.10 1.00 1.50 < 0.001
Sodium (mEq/L), median 136.00 136.00 134.00 0.208
INR, median 1.40 1.38 1.57 0.023
Total bilirubin (mg/dL), median 1.70 1.40 2.70 0.019
CTP Classification, n (%)
A 15 (12.2%) 15 (15.6%) 0 (0%) 0.040
B 44 (35.8%) 39 (40.6%) 5 (18.5%) 0.034
C 64 (52.0%) 42 (43.8%) 22 (81.5%) 0.001
SD: standard deviation. HCV: hepatitis C virus. HBV: hepatitis B virus. SBP: spontaneous bacterial peritonitis. mg/dL: milligrams per deciliter. mEq/L: miliequivalents per liter. INR: international normalized ratio. CTP: child-turcotte-pugh.
Upon admission, present complications included ascites (52.0%), upper gastrointestinal bleeding (56.9%), and hepatic encephalopathy (62.6%). Re-garding infections, SBP was present in 15.4% of cas-es, and other infections were present in 17.1% of the sample (Table 1). Renal disfunction (creatinine
lev-els ≥ 2 mg/dL) was observed in 16.3% of the patients.
Twenty-one patients (17%) were later transferred to the intensive care unit.
Performance of prognostic models in predicting in-hospital mortality
Among individuals included in the study, 27 (22.0%) died during hospitalization. Compared to the others, these individuals had higher proportions
of ascites (P < 0.001), hepatic encephalopathy (P =
0.022) and spontaneous bacterial peritonitis (SBP)
(P = 0.007) at admission. Moreover, those who died
were classified as CTP C more frequently (P <
0.001) and had higher creatinine (P < 0.001), INR
(P = 0.023) and bilirubin levels (P = 0.019). Also,
a trend was found towards higher rates of other infectious complications among those who died
com-pared to others (P = 0.079). No differences were
observed for the other variables (Table 1).
Table 2 shows values of the MELD, MELD-Na, MESO, iMELD, Refit MELD, and Refit MELD-Na models at admission and 48 h after admission.
Sig-nificantly, higher mean values (P < 0.001) were
ob-served for all models among individuals who died compared to survivors.
ROC curves of the studied models at admission and 48 h after admission were plotted to evaluate their performance in predicting in-hospital mortality. Upon admission, the values for the area under the ROC curve (AUROC) were 0.785 ± 0.053 (MELD), 0.784 ± 0.052 (MESO), 0.782 ± 0.050 (Refit MELD), 0.781 ± 0.053 (MELD-Na), 0.776 ± 0.052 (Refit MELD-Na), and 0.770 ± 0.053 (iMELD). No significant differences were observed when model equations calculated at admission were compared
among each other (P > 0.05). The same models were
Table 2. Values of prognostic models accordingly to in-hospital mortality.
All Surviving Dead Pt
(n = 123) (n = 96) (n = 27)
Admission
MELD 16.43 ± 7.08 14.73 ± 5.92 22.44 ± 7.70 < 0.001
MELD-Na 19.12 ± 7.38 17.45 ± 6.48 25.06 ± 7.44 < 0.001
MESO 1.23 ± 0.55 1.09 ± 0.47 1.69 ± 0.59 < 0.001
iMELD 38.12 ± 9.22 36.21 ± 8.42 44.90 ± 8.84 < 0.001
ReFit MELD 16.51 ± 6.98 14.93 ± 6.09 22.16 ± 7.11 < 0.001
ReFit MELD-Na 16.67 ± 6.46 15.26 ± 5.83 21.69 ± 6.19 < 0.001
48 hours
MELD 15.67 ± 7.32 13.25 ± 5.07 24.28 ± 7.64 < 0.001
MELD-Na 17.99 ± 7.37 15.68 ± 5.41 26.21 ± 7.62 < 0.001
MESO 1.16 ± 0.55 0.97 ± 0.37 1.82 ± 0.59 < 0.001
iMELD 36.52 ± 8.71 33.89 ± 6.30 45.88 ± 9.71 < 0.001
ReFit MELD 15.73 ± 7.25 13.44 ± 5.33 23.88 ± 7.38 < 0.001
ReFit MELD-Na 15.79 ± 6.52 13.78 ± 4.89 22.95 ± 6.63 < 0.001
MELD: Model for End-Stage Liver Disease. MELD-Na: MELD with serum sodium incorporation. MESO: model for end stage liver disease to sodium index. iMELD: integrated MELD. Refit MELD: revised model for end-stage liver disease. Refit MELD-Na: revised model for end-stage liver disease with sodium. t: Student’s “t” test.
Table 3. Performance of the selected cutoffs and the values for the area under the ROC curve of prognostic models calculated at admission and 48 h after admission in predicting in-hospital mortality.
Model Cutoff Sensitivity (%) Specificity (%) PPV (%) NPV (%) AUROC
Admission
MELD 17.5 74 77 48 91 0.785 ± 0.053
MELD-Na 22.0 70 79 49 90 0.781 ± 0.053
MESO 1.3 74 78 49 91 0.784 ± 0.052
iMELD 39.0 81 70 43 93 0.770 ± 0.053
Refit MELD 18.0 74 78 49 91 0.782 ± 0.050
Refit MELD-Na 17.0 78 72 44 92 0.776 ± 0.052
48 hours
MELD 19.5 77 91 70 94 0.882 ± 0.039
MELD-Na 23.0 74 90 67 92 0.858 ± 0.049
MESO 1.5 74 93 74 93 0.880 ± 0.041
iMELD 40.0 78 86 62 93 0.842 ± 0.052
Refit MELD 19.5 78 90 68 93 0.876 ± 0.040
Refit MELD-Na 20.0 74 91 69 93 0.858 ± 0.048
PPV: positive predictive valor. NPV: negative predictive value. AUROC: area under the ROC curve- MELD: Model for End-Stage Liver Disease. MELD-Na: MELD with sodium. MESO: Model for End-Stage liver Disease to sodium index. iMELD: integrated MELD. Refit MELD: revised model for end-stage liver disease. Refit MELD-Na: revised model for end-stage liver disease with sodium.
ing AUROC values were 0.882 ± 0.039 (MELD), 0.880 ± 0.041 (MESO), 0.876 ± 0.040 (Refit MELD), 0.858 ± 0.048 (Refit MELD-Na), 0.858 ± 0.049 (MELD-Na), and 0.842 ± 0.052 (iMELD). Again, no differences were observed when comparing the
models calculated after 48 h of admission (P > 0.05).
However, when admission models were compared to models calculated 48 h after admission, significantly higher AUROC values were observed for MELD-48
vs. MELD-admission (P = 0.015), MESO-48 against
MESO-ADM (0.015), MELD-48 against
Refit-MELD-ADM (P = 0.011), and Refit-MELD-Na-48
against Refit MELD-Na-admission (P = 0.049). A
trend was observed towards greater AUROC values for the Na-48 model compared with
MELD-Na-admission (P = 0.075). No statistical differences
Based on the ROC curve, best cutoff points were chosen for studied models at admission and 48 h af-ter admission (Table 3). Generally, similar sensitivi-ty was noted at the two moments of model calculation; however, a significant gain in specifici-ty and positive predictive value (PPV) was observed at the 48 h evaluation. Upon admission, very simi-lar performances were observed in many of the mod-els; however, the MELD-Na model showed lower sensitivity (70%) and the iMELD and Refit-MELD-Na models showed lower specificity (70 and 72%, respec-tively) when compared to the remaining models. The models at 48 h after admission all presented similar performance, except for iMELD, which showed slightly lower specificity than the rest (86%).
In patients admitted for the first episode of hepat-ic decompensation, the models evaluated after 48 h performed only slightly better than the admission
evaluation, without statistical significance (P >
0.05). However, in patients having a history of pre-vious decompensation, a significantly better per-formance was noted for models calculated at 48 h as compared to their counterparts calculated at
admis-sion (P < 0.05 for all models except MESO, which
reached a P-value of 0.094). The AUROCs observed
for admission models in those patients were 0.741 ± 0.068 (MELD), 0.745 ± 0.067 (MESO), 0.733 ± 0.066 (Refit MELD), 0.738 ± 0.069 (MELD-Na), 0.734 ± 0.066 (Refit MELD-Na), and 0.721 ± 0.071 (iMELD). The AUROCs for the models at 48 h were 0.874 ± 0.047 (MELD), 0.871 ± 0.049 (MESO), 0.869 ± 0.047 (Refit MELD), 0.841 ± 0.066 (MELD-Na), 0849 ± 0.059 (Refit MELD-Na), and 0.818 ± 0.068 (iMELD).
The P-values for the Hosmer-Lemeshow
good-ness-of-fit test for the models at admission were: MELD = 0.441, MELD-Na = 0.367, MESO = 0.271, iMELD = 0.247, Refit-MELD = 0.631, Refit-MELD-Na = 0.366. Similar values were observed after
48 h, with the following P-values: MELD = 0.873,
MELD-Na = 0.172, MESO = 0.257, iMELD = 0.594, Refit-MELD = 0.655, Refit-MELD-Na = 0.766. These results indicate adequate calibration of the models at both moments.
DISCUSSION
The determination of prognosis is an essential part in the initial evaluation of any disease. Progno-sis is not only the baProgno-sis for the information that a physician provides to the patient, but also guides clinical approach. Identification of prognostic mark-ers of poor outcome in cirrhotic patients admitted
for acute decompensation could allow better risk stratification, and eventually guide the most appro-priate therapeutic measures for each case.
The models MELD-Na, MESO, iMELD, Refit MELD, and Refit MELD-Na incorporate to MELD score coefficients and lower and upper limits of in-dividual variables that have been optimized for the patients for which the MELD score is applied. Most of these models assess waiting-list mortality and thus are the most efficient donated organ allo-cation classifiallo-cation.
Lee, et al. remark that an important issue,
per-haps requiring further attention, is that the MELD system was originally created in patients who did not have acute or reversible complications. Whether the MELD system and its derived models can be equally applied as a tool for outcome prediction in different clinical scenarios beyond their original aim
requires additional study.32 In contrast to the
ma-jority of published studies on this subject, the cur-rent work was conducted by evaluation of in-hospital mortality. The present study has com-pared MELD score to five different prognostic scales (MELD-Na, iMELD, MESO, MELD-Refit, and Refit-MELD-Na), both in admission and after 48 h of hos-pitalization, to assess in-hospital (short-term) mortality in patients with acute decompensation of liver cirrhosis. Most studies intend to evaluate mid-term and long-mid-term mortality.
In 2009, Didier Samuel recognized the importance of improving prognostic scoring systems for cirrhot-ic patients. He stressed that applying the new scores to a variety of cirrhotic patients and to different eti-ologies of the disease is vital, as well as determining the prognostic value of the scores in the short,
me-dium, and longer terms.(33) Before the publication of
Refit models,18 many studies have compared MELD
to the new MELD-based models in combination with SNa. Most studies found that new models with the addition of SNa were superior to traditional MELD scores in predicting short, medium, and long term
mortality.16,17,34-36
Kim, et al. evaluated data from 13,940 patients
from the U.S. Standard Transplant Analysis and Re-search, and concluded that assignment of priority ac-cording to the MELD score combined with the SNa concentration might have resulted in transplantation
and prevented death.17 In Southern Brazil, Marroni,
et al. evaluated 558 individuals on the waiting list
for liver transplantation, and they observed that SNa-modified MELD scores are able to more
accu-rately predict 3- and 6-month mortality (P <
Table 4.
Characteristics of different studies that evaluated MELD and MELD-based models to predict mortality.
Authors N . Sample Endpoint A ge MELD Child C Serum Hypona-Ascites Mortality ME LD MELD-Na subjects (years) sodium tremia AUROC AUROC (mmol/L) Fayad, 123 Decompensated In-hospital 54.26 ± 16.43 ± 5 2 % 135.0 ± 4 4 % 5 2 % 2 2 % 0.882 0.858 et al . cirrhosis mortality 10.79* 7 .0 8 * 4.7* Emergency room Marroni, 558 Transplant list 53.5 ± 15.7 ± N /A 137 ± 1 2 % N /A 3 3 % 0.736/6 N /A et al . 16 Data bank 9.5* 5.5* 5.7* m Kim, 13,940 Transplant list 3 m m or ta li ty o n 53 (18-83) ‡ 15 (6-40) ‡ N/A 13 7 ‡ 3 1 % N /A 3 % 0.883 0.868 et al . 17 Data bank
the waiting list.
(112-168) Hassan, 1,000 Decompensated 12 m mortality 54.8 ± 8*
16.6 ± 5.9*
7 3 % 134 ± 2 5 % 7 4 % 1 1 % 0.725 0.743 et al . 34 cirrhosis 75.5* In Hospital Hsu, 18 2 Acute 3 m mortality 48 ± 1 3* 16.8±6.3* -137.4 ± N /A 8 % 1 1 % 0.823 0.908 et al . 35 decompensated 3.5* hepatitis Lv , 25 6 In Hospital et al . 36 Decompensated 1
and 3 months
54.3 ± 15.1 ± 4 1 % 134.3 ± 3 2 % 4 3 % 10 % / 0 .8 1 9 / N /A cirrhosis mortality 11.5* 6.3* 7.8* 1 m § 1 m In Hospital 57%/ 0.820/ 1m §§ 3 m Jiang, 16 6 Decompensated 3, 6 a nd 62.3 ± N /A N /A N /A N /A N /A 23%/3 m N /A N /A et al . 37 cirrhosis 12 m mortality 12.9* 45%/12 m In Hospital Zhang, 435 Liver cirrhosis 6
and 12 m
N /A N /A N /A N /A N /A N /A 25%/6 m N /A N /A et al . 38 N /A mortality 35%/12 m Koo, 88 2 Liver cirrhosis 3 m mortality 57.5 ± 16.3 ± 2 8 % N /A N /A N /A 9 % 0.844 0.848 et al . 39 In hospital 10.9 7.3*
N/A: not avaiable. AUROC: area under the curve.
‡ median (variation). *mean
±
standard deviation.
§ MELD
≤
17.
The majority of the studies that evaluate the abil-ity of MELD and its derivatives to predict mortalabil-ity in cirrhotic patients are retrospective, and aim to evaluate 1-, 3-, 6- or 12-month mortality
(Table 4).34,37-39 As far as we are concerned, this is
the first study to evaluate in-hospital mortality. Very few studies have assessed prognosis of decompensated cirrhosis in the emergency room.
Orloff, et al. evaluated 211 unselected consecutive
patients with cirrhosis and bleeding varices to endo-scopic sclerotherapy or emergency portacaval shunt. In baseline determinations of MELD versus Child-Pugh, there were no significant differences in pre-dicting survival, recurrent encephalopathy, and rebleeding. The Child-Turcotte score was signifi-cantly more effective in predicting survival and time
to recurrent encephalopathy.40
No significant differences were observed among the employed scores upon admission and 48 h after admission. We suppose that the similarity encoun-tered among different prognostic models may reflect the finding that admission SNa was not related to mortality in the bivariate analysis and the high pro-portion of individuals decompensated with hy-ponatremia. In our series, the median SNa was 135.0 ± 4.7 mEq/mL, 44% of the individuals evi-denced hyponatremia, and ascites was present in 52% of the sample. Other studies report a mean SNa
level of 134-137 mEq/mL,16,17,34-36 with lower
propor-tions of hyponatremia, varying from 12% to 32%.16,17,34,36 Cirrhotic patients often exhibit
dilu-tional hyponatremia because of portal hypertension
and vasodilatation.41 Remarkably, hyponatremia is
commonly associated with severe complications in liver cirrhosis, including ascites, hepatorrenal
syn-drome and liver related mortality.42-45 Previous
stud-ies have shown that hyponatremia is a strong predictor of early mortality, independent of MELD
score.19,30,46 The majority (90%) of patients with
hy-ponatremia has a history of ascites,30 and ascites is
also a predictor of mortality.47 In the present study,
when individuals with hyponatremia were compared to those with normal SNa levels, we observed a higher proportion of individuals with ascites among
those with hyponatremia (52 vs. 25%, P = 0.002;
data not shown).
In the present study, higher AUROCs were ob-served within 48 h after hospital admission to pre-dict in-hospital mortality when compared to models upon admission. This was the first study assessing this issue. Patients who respond to initial medical management are probably those with better progno-sis, which is more clearly evidenced after 48 h of
ad-mission. Therefore, the MELD score and its deriva-tives more precisely represent the current liver func-tion status after treating the acute complicafunc-tions that develop in these patients. Higher values of MELD in patients with fatal outcomes were ob-served in those who developed ascites, hepatic encephalopathy, spontaneous bacterial peritonitis, and those who presented higher values of creati-nine, bilirubin, or INR. The MELD score and its derivatives correlate with residual liver function. They have demonstrated the ability to predict mortality in a broad spectrum of liver diseases. The variation in MELD values over time may cor-respond to dynamic changes in liver function and its increase may predict liver decompensation, especially in those with onset of hepatic encepha-lopathy or ascites. The determination of MELD score at two moments provides updated informa-tion on the severity of the disease and allows more aggressive therapy. On the other hand, the decrease in serial MELD values could indicate the correction of a reversible element, therefore reflect-ing a lower risk of mortality. Thus, the MELD score analysis in two different periods of time transmits additional clinical information and should be considered as a predictive factor in patients admitted for decompensated cirrhosis.
CONCLUSION
MELD-based models showed similar accuracy as predictors of mortality in cirrhotic patients admitted for acute decompensation. However, the perform-ance of these models was significantly better when applied 48 h after hospitalization when compared to their calculation on admission especially in patients with history of previous hepatic decompensation.
ABBREVIATIONS
• CTP: Child-Turcotte-Pugh.
• iMELD: integrated MELD.
• MELD: Model for End-Stage Liver Disease.
• MESO index: MELD to sodium index.
• Refit MELD: Revised Model for End-Stage Liver Disease.
• SNa: serum sodium.
REFERENCES
1. Schiavon L de L, Narciso-Schiavon JL, de Carvalho-Filho RJ. Non-invasive diagnosis of liver fibrosis in chronic hep-atitis C. World J Gastroenterol 2014; 20: 2854-66. 2. Anthony PP, Ishak KG, Nayak NC, Poulsen HE, Scheuer PJ,
Sobin LH. The morphology of cirrhosis. Recommendations on definition, nomenclature, and classification by a work-ing group sponsored by the World Health Organization. J
Clin Pathol 1978; 31: 395-414.
3. D’Amico G, Garcia-Tsao G, Cales P, Escorsell A, Nevens F, Cestari R, Caletti G, et al. Session 2 Diagnosis of Portal Hypertension: How and When. In: Portal Hypertension III: Proceedings of the Third Baverno International Consensus Workshop on Definitions, Methodology and Therapeutic Strategies: Blackwell Science Ltd; 2008, 36-64.
4. Saunders JB, Walters JR, Davies AP, Paton A. A 20-year prospective study of cirrhosis. Br Med J (Clin Res Ed) 1981; 282: 263-6.
5. Fleming KM, Aithal GP, Card TR, West J. The rate of de-compensation and clinical progression of disease in people with cirrhosis: a cohort study. Aliment Pharmacol Ther 2010; 32: 1343-50.
6. Gines P, Quintero E, Arroyo V, Teres J, Bruguera M, Rimola A, Caballeria J, et al. Compensated cirrhosis: natural his-tory and prognostic factors. Hepatology 1987; 7: 122-8. 7. D’Amico G, Garcia-Tsao G, Pagliaro L. Natural history and
prognostic indicators of survival in cirrhosis: a systemat-ic review of 118 studies. J Hepatol 2006; 44: 217-31. 8. Kim HJ, Lee HW. Important predictor of mortality in
pa-tients with end-stage liver disease. Clin Mol Hepatol 2013; 19: 105-15.
9. Kamath PS, Kim WR. The model for end-stage liver disease (MELD). Hepatology 2007; 45: 797-805.
10. Child CG. Surgery and portal hypertension. In: Child C (ed.). The Liver and Portal Hypertension. Philadelphia, PA: WB Saunders; 1964, 50-72.
11. Malinchoc M, Kamath PS, Gordon FD, Peine CJ, Rank J, ter Borg PC. A model to predict poor survival in patients un-dergoing transjugular intrahepatic portosystemic shunts.
Hepatology 2000; 31: 864-71.
12. Pugh RN, Murray-Lyon IM, Dawson JL, Pietroni MC, Wil-liams R. Transection of the oesophagus for bleeding oesophageal varices. Br J Surg 1973; 60: 646-9.
13. Durand F, Valla D. Assessment of prognosis of cirrhosis.
Semin Liver Dis 2008; 28: 110-22.
14. Wiesner R, Edwards E, Freeman R, Harper A, Kim R, Kamath P, Kremers W, et al. Model for end-stage liver dis-ease (MELD) and allocation of donor livers.
Gastroenterol-ogy 2003; 124: 91-6.
15. Freeman RB, Wiesner RH, Edwards E, Harper A, Merion R, Wolfe R. Results of the first year of the new liver alloca-tion plan. Liver Transpl 2004; 10: 7-15.
16. Marroni CP, de Mello Brandao AB, Hennigen AW, Marroni C, Zanotelli ML, Cantisani G, Fuchs SC. MELD scores with in-corporation of serum sodium and death prediction in cir-rhotic patients on the waiting list for liver transplantation: a single center experience in southern Brazil. Clin Transplant 2012; 26: E395-401.
17. Kim WR, Biggins SW, Kremers WK, Wiesner RH, Kamath PS, Benson JT, Edwards E, et al. Hyponatremia and mortality among patients on the liver-transplant waiting list. N Engl
J Med 2008; 359: 1018-26.
18. Heuman DM, Abou-Assi SG, Habib A, Williams LM, Stravitz RT, Sanyal AJ, Fisher RA, et al. Persistent ascites and low serum sodium identify patients with cirrhosis and low MELD scores who are at high risk for early death.
Hepa-tology 2004; 40: 802-10.
19. Biggins SW, Rodriguez HJ, Bacchetti P, Bass NM, Roberts JP, Terrault NA. Serum sodium predicts mortality in pa-tients listed for liver transplantation. Hepatology 2005; 41: 32-9.
20. Cardenas A, Gines P. Predicting mortality in cirrhosis—se-rum sodium helps. N Engl J Med 2008; 359: 1060-2. 21. Huo TI, Wang YW, Yang YY, Lin HC, Lee PC, Hou MC, Lee
FY, et al. Model for end-stage liver disease score to serum sodium ratio index as a prognostic predictor and its cor-relation with portal pressure in patients with liver cirrho-sis. Liver Int 2007; 27: 498-506.
22. Luca A, Angermayr B, Bertolini G, Koenig F, Vizzini G, Plon-er M, Peck-Radosavljevic M, et al. An integrated MELD model including serum sodium and age improves the pre-diction of early mortality in patients with cirrhosis. Liver
Transpl 2007; 13: 1174-80.
23. Leise MD, Kim WR, Kremers WK, Larson JJ, Benson JT, Therneau TM. A revised model for end-stage liver disease optimizes prediction of mortality among patients await-ing liver transplantation. Gastroenterology 2011; 140: 1952-60.
24. Runyon BA. Management of adult patients with ascites due to cirrhosis: an update. Hepatology 2009; 49: 2087-107. 25. Bajaj JS. Review article: the modern management of
he-patic encephalopathy. Aliment Pharmacol Ther 2010; 31: 537-47.
26. de Franchis R. Revising consensus in portal hypertension: report of the Baveno V consensus workshop on methodolo-gy of diagnosis and therapy in portal hypertension. J
Hepatol 2010; 53: 762-8.
27. Addolorato G, Leggio L, Ferrulli A, Cardone S, Vonghia L, Mirijello A, Abenavoli L, et al. Effectiveness and safety of baclofen for maintenance of alcohol abstinence in alcohol-dependent patients with liver cirrhosis: randomised, dou-ble-blind controlled study. Lancet 2007; 370: 1915-22. 28. Angermayr B, Cejna M, Karnel F, Gschwantler M, Koenig F,
29. Kamath PS, Wiesner RH, Malinchoc M, Kremers W, Therneau TM, Kosberg CL, D’Amico G, et al. A model to predict survival in patients with end-stage liver disease.
Hepatology 2001; 33: 464-70.
30. Biggins SW, Kim WR, Terrault NA, Saab S, Balan V, Schiano T, Benson J, et al. Evidence-based incorporation of serum sodium concentration into MELD. Gastroenterology 2006; 130: 1652-60.
31. Hanley JA, McNeil BJ. A method of comparing the areas un-der receiver operating characteristic curves un-derived from the same cases. Radiology 1983; 148: 839-43. 32. Lee YH, Hsu CY, Huo TI. Assessing liver dysfunction in
cir-rhosis: role of the model for end-stage liver disease and its derived systems. J Chin Med Assoc 2013; 76: 419-24. 33. Samuel D. MELD-Na as a prognostic score for cirrhotic
pa-tients: Hyponatremia and ascites are back in the game. J
Hepatol 2009; 50: 836-8.
34. Hassan EA, Abd El-Rehim AS. A revised scope in different prognostic models in cirrhotic patients: Current and fu-ture perspectives, an Egyptian experience. Arab J
Gas-troenterol 2013; 14: 158-64.
35. Hsu CY, Lin HC, Huang YH, Su CW, Lee FY, Huo TI, Lee PC, et al. Comparison of the model for end-stage liver disease (MELD), MELD-Na and MELDNa for outcome prediction in patients with acute decompensated hepatitis. Dig Liver
Dis 2010; 42: 137-42.
36. Lv XH, Liu HB, Wang Y, Wang BY, Song M, Sun MJ. Vali-dation of model for end-stage liver disease score to se-rum sodium ratio index as a prognostic predictor in patients with cirrhosis. J Gastroenterol Hepatol 2009; 24: 1547-3.
37. Jiang M, Liu F, Xiong WJ, Zhong L, Chen XM. Comparison of four models for end-stage liver disease in evaluating the prognosis of cirrhosis. World J Gastroenterol 2008; 14: 6546-50.
38. Zhang QB, Chen YT, Lian GD, Qian CC, Chen SJ, Huang KH. A combination of models for end-stage liver disease and cir-rhosis-related complications to predict the prognosis of liver cirrhosis. Clin Res Hepatol Gastroenterol 2012; 36: 583-91.
39. Koo JK, Kim JH, Choi YJ, Lee CI, Yang JH, Yoon HY, Choi HJ, et al. Predictive value of Refit Model for End-Stage Liv-er Disease, Refit Model for End-Stage LivLiv-er Disease-Na, and pre-existing scoring system for 3-month mortality in Korean patients with cirrhosis. J Gastroenterol Hepatol 2013; 28: 1209-16.
40. Orloff MJ, Vaida F, Isenberg JI, Wheeler HO, Haynes KS, Jinich-Brook H, Rapier R, et al. Child-Turcotte score ver-sus MELD for prognosis in a randomized controlled trial of emergency treatment of bleeding esophageal varices in cirrhosis. J Surg Res 2012; 178: 139-46.
41. Albillos A, Colombato LA, Groszmann RJ. Vasodilatation and sodium retention in prehepatic portal hypertension.
Gas-troenterology 1992; 102: 931-5.
42. Borroni G, Maggi A, Sangiovanni A, Cazzaniga M, Salerno F. Clinical relevance of hyponatraemia for the hospital outcome of cirrhotic patients. Dig Liver Dis 2000; 32: 605-10.
43. Gines A, Escorsell A, Gines P, Salo J, Jimenez W, Inglada L, Navasa M, et al. Incidence, predictive factors, and prog-nosis of the hepatorenal syndrome in cirrhosis with as-cites. Gastroenterology 1993; 105: 229-36.
44. Gines P, Guevara M. Hyponatremia in cirrhosis: pathogen-esis, clinical significance, and management. Hepatology 2008; 48: 1002-10.
45. Porcel A, Diaz F, Rendon P, Macias M, Martin-Herrera L, Giron-Gonzalez JA. Dilutional hyponatremia in patients with cirrhosis and ascites. Arch Intern Med 2002; 162: 323-8.
46. Londono MC, Cardenas A, Guevara M, Quinto L, de Las Heras D, Navasa M, Rimola A, et al. MELD score and serum sodium in the prediction of survival of patients with cir-rhosis awaiting liver transplantation. Gut 2007; 56: 1283-90.
47. Silva PE, Fayad L, Lazzarotto C, Ronsoni MF, Bazzo ML, Co-lombo BD, Dantas-Correa EB, et al. Single-center validation of the EASL-CLIF Consortium definition of acute-on-chronic liver failure and CLIF-SOFA for prediction of mortality in cirrhosis. Liver Int 2014. doi: 10.1111/liv.12597.
Annex 1. Calculation of prognostic models.
MELD 9.57 loge (creatinine [mg/dL]) + 3.78 loge (bilirubin [mg/dL]) + 11.2 loge (INR) + 6.43 MELD-Na MELD + 1.59 x (135-Na [mmol/L]); Na range = 120 and 135 mmol/L
MESO (MELD / Na [mmol/L]) x 100
iMELD MELD + (age [years] x 0.3)-(0.7 x Na [mmol/L]) + 100
ReFit MELD 4.082 x Loge (bilirubinC) + 8.485 x Loge (creatinineC) +10.671 x Loge (INRC)+7.432 ReFit MELD-Na 4.258 x Loge (bilirubinC) + 6.792 x Loge (creatinineC) + 8.290 x Loge (INRC) +
0.652 x (140 - NaC) - 0.194 x (140 - NaC) x BiliCC + 6.327