NEK2 Promotes Hepatoma Metastasis and
Serves as Biomarker for High Recurrence
Risk after Hepatic Resection
Yu-Ying Chang,* Chia-Jui Yen,† Shih-Huang Chan,‡ Yi-Wen Chou,* Yun-Ping Lee,* Ching-Yu Bao,* Chien-Jung Huang,§ Wenya Huang*,||,¶ * Department of Medical Laboratory Science and Biotechnology, College of Medicine, National Cheng Kung University, Tainan, Taiwan. † Division of Hematology and Oncology, Department of Internal Medicine, National Cheng Kung University Hospital, College of Medicine, National Cheng Kung. University, Tainan, Taiwan. ‡ Department of Statistics, College of Management, National Cheng Kung University, Tainan, Taiwan. § Department of Internal Medicine, Taipei City Hospital, Taipei, Taiwan. || Institute of Basic Medicine, National Cheng Kung University, Tainan, Taiwan. ¶ Department of Pathology, National Cheng Kung University Hospital, Tainan, Taiwan.
September-October, Vol. 17 No. 5, 2018: 843-856 The Official Journal of the Mexican Association of Hepatology,
the Latin-American Association for Study of the Liver and the Canadian Association for the Study of the Liver
Manuscript received: Manuscript received:Manuscript received:
Manuscript received:Manuscript received: February 10, 2018. Manuscript accepted:Manuscript accepted:Manuscript accepted:Manuscript accepted:Manuscript accepted: April 07, 2018. DOI:10.5604/01.3001.0012.3146
A B S T R A C T A B S T R A C T A B S T R A C T A B S T R A C T A B S T R A C T
Introduction and aim. Introduction and aim.Introduction and aim. Introduction and aim.
Introduction and aim. Developing reliable biomarkers for hepatocellular carcinoma (HCC) patients who are at a high risk of re-currence after curative hepatic resection is very important for determining subsequent therapeutic strategies. We investigated the role of the cell cycle factor NIMA-related kinase 2 (NEK2) in HCC progression in hepatoma cells and post-surgery patients. Materi-Materi-Materi-Materi- Materi-al and methods.
al and methods.al and methods. al and methods.
al and methods. The effects of NEK2 on proliferation, invasion and migration of hepatoma HuH7 and SK-Hep1 cells were evalu-ated. In a post-surgery HCC cohort (N = 97), the Nek2 induction levels in the tumors were examined with real-time RT-PCR analysis, and the results were analyzed for their correlations with recurrence. Results.Results.Results.Results.Results. NEK2 promoted G1 to S phase cell cycle progression by causing increases in cyclin D1 and AKT phosphorylation and decreases in the cyclin-dependent kinase inhibitor p27, indicating that NEK2 plays an important role during interphase in addition to its previously identified role in M phase. NEK2 also en-hanced the proliferation, migration and invasion of hepatoma cells and regulated the expression of E-cadherin and MMP9. The Nek2 mRNA levels in the tumors were highly correlated with recurrence rates in the post-surgery HCC patients. Combined evaluation of the tumor AJCC stage and the Nek2 level can serve as a reliable method for predicting the relative risk of HCC recurrence in these patients. Conclusions. NEK2 plays a significant role in cell cycle progression in the inter- and M-phases. NEK2 enhances HCC me-tastasis and is correlated with recurrence and thus can potentially serve a promising high-risk biomarker for HCC.
Key words. Key words. Key words. Key words.
Key words. Hepatocellular carcinoma. Cancer progression. Cell cycle. Invasion. Hepatitis virus.
INTRODUCTION
Hepatocellular carcinoma (HCC) is among the leading causes of deaths by cancer worldwide, with over 500,000
people affected every year.1 Understanding the etiologies
and developing effective preventive strategies for HCC are very important for lowering its incidence. The main etio-logical factors causing HCC include chronic viral hepati-tis B/C, alcohol intoxication, and chronic metabolic syndromes such as non-alcoholic fatty liver disease
(NASH).2 In countries with hepatitis B/C epidemics,
most HCCs are related to chronic viral hepatitis, whereas in most American and European countries, in which viral hepatitis is not highly prevalent, non-viral factors, such as alcohol addiction and chronic metabolic syndromes, are
the major causes of HCC.2,3 Most early cases of HCC are
not diagnosed due to the lack of observable symptoms, which leads to high recurrence rates after primary
thera-pies.4 Therefore, developing reliable biomarkers to screen
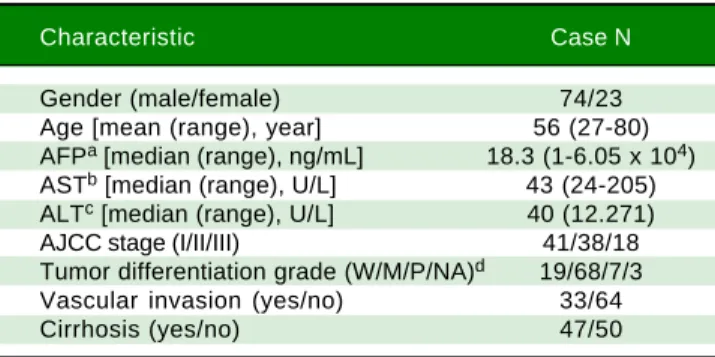
inten-Table 1. Demographic characteristics of the HBV-related HCC cases (n = 97) in this study.
Characteristic Case N
Gender (male/female) 74/23
Age [mean (range), year] 56 (27-80) AFPa [median (range), ng/mL] 18.3 (1-6.05 x 10⁴)
ASTb [median (range), U/L] 43 (24-205)
ALTc [median (range), U/L] 40 (12.271)
AJCC stage (I/II/III) 41/38/18
Tumor differentiation grade (W/M/P/NA)d 19/68/7/3
Vascular invasion (yes/no) 33/64
Cirrhosis (yes/no) 47/50
a Alpha-fetal protein. b Aspartate transaminase. c Alanine transaminase. d W/M/P: well/moderately/poorly differentiated tumors. NA: not available.
unique role in tumor progression.15,16 Therefore, in this
study, we explored the molecular mechanism by which NEK2 regulates HCC progression through a non-centro-somal role. We found that NEK2 plays a regulatory role in
the G1-S phase transition. We also found that the Nek2
ex-pression level is highly correlated with HCC recurrence in patients who have received hepatectomy surgeries. Therefore, NEK2 could potentially serve as a biomarker for a high risk of recurrence in post-surgery HCC pa-tients.
MATERIAL AND METHODS
HCC patients, cell lines and transgenic mice
Human liver tissue sections were collected from the HCC patients who were admitted to National Cheng Kung University Hospital (NCKUH) for hepatectomy surgery from 2008 to 2012. All the HCC was diagnosed by medical imaging evaluation and biopsy histopathologic re-views by two pathologists independently. The tumor stag-ing and histologic gradstag-ing followed the American Joint
Committee on Cancer (AJCC) classification.31 Liver
cir-rhosis in the non-tumorous liver was observed with the stainings of the H&E and Masson’s trichrome methods. The patients were regularly followed-up at clinic visits every 1-3 months after a hepatic resection. HCC recur-rence was detected by medical imaging and biopsy con-firmed. All of the patients provided signed informed consent to use their surgical specimens for this research. And all of the protocols for this study were reviewed and approved by the NCKUH Institutional Review Board (IRB No.: ER-100-058 [04/25/2011]). A total of 109 HCC cases were recruited: 12 patients, including 6 HBV- and 6 HCV-related HCC cases, were analyzed with a cDNA microarray assay, and 97 HBV-related HCC cases (Table 1) were analyzed with a quantitative reverse transcription-polymerase chain reaction (RT-PCR) assay. The human
hepatoma HuH7 and SK-Hep1 cell lines were used for in
vitro cell culture studies. Nek2 and Plk1 (polo-like kinase 1)
gene knockdown (KD) constructs were prepared using specific short hairpin RNAs (shRNAs) whose genes were cloned into the lentiviral vector pLKO.1, which was ob-tained from the National RNAi Core Facility (Academia Sinica, Taipei, Taiwan), according to a previously
de-scribed protocol.17 An shRNA construct against GFP
(shGFP) was used as a negative control. A HuH7 cell line
with stable Nek2 overexpression was constructed using
the Tet-off gene expression system (Clontech) for the
Nek2 gene. HCC tumorous and peri-tumorous mouse
liv-er tissue samples wliv-ere dissected from 18-month-old C57BL/6 transgenic mice carrying HBx, pre-S2 mutant
LHBS, and pre-S2/HBx double transgenes.18
sive follow ups to closely monitor possible disease pro-gression.
Thus far, curative surgical resection of the tumor is the primary therapeutic approach for HCC in the early stages, such as the Barcelona Clinic Liver Cancer (BCLC) stage
A.4 For these HCC cases, the tumor genotype has been
demonstrated to greatly affect the efficacy of post-surgery
adjuvant therapies and the relative risk of recurrence.5
Many high-risk prognostic biomarkers have been
identi-fied for HCC.5 An important group of high-risk
biomark-ers includes cell cycle and mitosis factors.6 During the
prophase of mitosis, centrosome duplication and separa-tion occur and equip the cell for chromosome alignment
and bipolar movement.7 The efficiency of centrosome
du-plication/separation has been demonstrated to be highly
correlated with cell proliferation and growth.8 Never in
mitosis-related kinase 2 (NEK2), a member of the NEK serine/threonine kinase family, is an essential factor for centrosome assembly/separation and has been found to
correlate with recurrence in some types of cancer.9-11
NEK2 interacts with the kinetochore complex compo-nent NDC80 in the control of centrosome separation and bipolar spindle formation in mitotic cells by phosphor-ylating centrosomal proteins, such as centrosome-associ-ated protein (CEP) 250 and ninein-like (NINL), which
results in their displacement from the centrosomes.12,13
NEK2 also regulates kinetochore microtubule attachment stability and the mitotic checkpoint protein complex via the phosphorylation of NDC80, cell-division cycle (CDC) 20 and mitotic arrest deficient 2 like 1
(MAD2L1).14
Cell survival and proliferation analyses
Cell proliferation and colony formation assays were employed to detect the effect of NEK2 on cell
prolifera-tion. Briefly, the Nek2 KD and vector control HuH7 cells
were grown in 24-well cell culture plates at 1 x 10⁵ cells/ well, and the cell numbers were determined using cell counting chambers after 24, 48 and 72 h of growth. For the
colony formation assay, 1000 Nek2 knockdown,
overex-pression and control HuH7 cells were seeded in 10-cm cell culture dishes and then grown for 14 days before
har-vest. The numbers of cell colonies (diameter ≥ 0.5 mm) in
the culture dishes were calculated according to a
previ-ously described protocol.18 Regarding the assays of cell
sensitivity to the NEK2 inhibitor pelitinib,19 the Sk-Hep1
and HuH7 cells were treated with various doses of pelitinib (Cayman, Inc.) or else mock treated for 8 and 24
h and then subjected to the MTT [α
3-(4,5-dimethylthia-zol-2-yl)-2,5-diphenyltetrazolium bromide] assay
accord-ing to a previously described protocol.20
Cell cycle analysis
The Nek2 KD and control HuH7 cells were
synchro-nized with nocodazole (330 nM) treatment for 16 h. The cells were then released into the regular growth medium and harvested after 4, 8, 12 and 24 h. After serial washing with phosphate-buffered saline (pH 7.4), the cells were fixed with 70% ethanol (v/v) overnight at -20 °C and then
stained with a propidium iodide solution (20 μg/mL
pro-pidium iodide, 0.001% Triton X-100 and 200 μg/mL
RNase) for 30 min at room temperature. The DNA con-tents of the cells were determined by flow cytometry
(BDTM Biosciences).
Cell migration and invasion assays
HuH7 cells overexpressing or with knocked down
Nek2 were analyzed for migration activities following a
previously described protocol. Briefly, 1 x 10⁵ cells were seeded in each upper chamber of 24-well Transwell in-serts (Corning, NY, USA) and grown in serum-free medi-um; the bottom chamber contained regular DMEM growth medium with 10% fetal bovine serum. After 24 and 48 h of incubation, the cells that adhered to the Transwell inserts were fixed with 4% formaldehyde and then stained with crystal violet. The cells on the upper surface of the Transwell membrane were wiped off using a cotton swab, and the cells that had migrated to the lower surface of the membrane were counted using Image J image processing software (NIH, USA). For the cell invasion assay, cells were grown in 24-well Transwell inserts that were
pre-coated with 0.5% Matrigel (BDTM Biosciences) and
grown for 24 and 48 h before harvest. The invading cells were counted according to the same protocol that was used in the cell migration assay. For the wound healing
as-say, 2 x 10⁶/well cells were seeded in 6-well culture dishes
and grown for 24 h to form a confluent monolayer. The wound was created by cutting a line on the cell monolayer using a pipette tip, and the detached cells were washed off with PBS (pH 7.4). The wound images were photo-graphed immediately after the wound was created and after incubation for 24 h, and the wound healing rate was meas-ured.
Quantitative reverse
transcription polymerase chain reaction
Total RNA was extracted from the tumorous and adja-cent non-tumorous HCC tissues using TRIzol reagent (Sigma-Aldrich) according to a previously described
pro-tocol and then reverse transcribed into cDNA.20 The
ex-pression levels of the Nek2, FoxM1, and Plk1 genes were
examined by quantitative RT-PCR (Applied Biosystems,
Inc.).18 Briefly, the liver cDNA was mixed with
Taq-Man™ Master Mix, the gene-specific PCR primers and TaqMan™ probes and then analyzed using an Applied
Bi-osystems® 7500 Real-Time PCR System. The
housekeep-ing gene Gapdh was used as endogenous control for gene
expression. The real-time RT-PCR data were analyzed us-ing the StepOne™ Software (ABI).
cDNA microarray analysis
Twelve pairs of the tumorous and peri-tumorous liver tissues (6 HBV- and 6 HCV-related HCC) that were sur-gically resected from the HCC patients were subjected to cDNA microarray analysis (Agilent Human Gene Expres-sion v2 4x44K Microarray Kit) to screen for genes whose expression levels were changed in the tumor. Moreover, the HCC tumorous and peri-tumorous mouse liver tis-sues from fourteen 18-month-old C57BL/6 transgenic
mice carrying HBx, pre-S2 mutant LHBS, and pre-S2/HBx
double transgenes were similarly analyzed using an Agilent
Mouse Gene Expression v2 4x44K Microarray Kit.21 The
experimental protocol and data analysis methods followed a previously described protocol.
Multivariate regression and Cox proportional hazards statistical analyses
The relative Nek2 mRNA levels, as determined by
quantitative RT-PCR, were analyzed for their correlations with various clinicopathological factors. The association
of the Nek2 level with HCC recurrence was analyzed
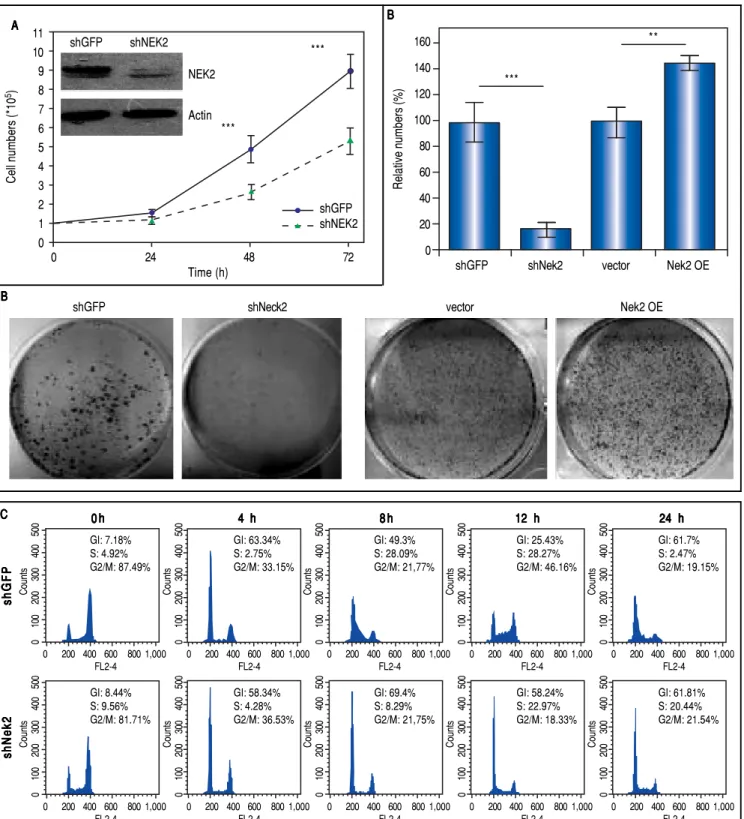
Figure 1. Figure 1. Figure 1. Figure 1.
Figure 1. Effects of NEK2 on cell growth and G1 to S phase cell cycle progression. A.A.A.A. Cell proliferation assay of human hepatoma HuH7 cells stably ex-A. pressing shNek2 and shGFP constructs. The cell numbers after 24, 48 and 72 h of growth in regular medium were counted. The KD efficiency of Nek2 at the time of seeding was detected by Western blotting as shown in the top left region of the graph. B.B.B.B. Colony formation assay in the HuH7 cells stably expressingB. shNek2 and shGFP and overexpressing Nek2 or the vector only. Left: one set of representative images of the experimental results; right: summary of the data from three independent experiments. C.C.C.C.C. Cell cycle profile analysis in the Nek2 KD and control HuH7 cells. After synchronization with nocodazole treatments, the cell cycle profiles were analyzed immediately after the treatment (0 h) and at various time points after release from nocodazole. The percentages of cells in the G1, S and G2/M phases are indicated. The Nek2 KD cells exhibited G1 to S phase arrest.
A AA A
A BBBBB
C C C C C
Cell numbers (*10
5) 11 10 9 8 7 6 5 4 3 2 1 0
0 24 48 72
Time (h) shGFP shNEK2 shGFP shNEK2 NEK2 Actin *** ***
Relative numbers (%)
160 140 120 100 80 60 40 20 0
shGFP shNek2 vector Nek2 OE
B B B B B *** ** 0 h 0 h0 h 0 h
0 h 4 h4 h4 h4 h4 h 8 h8 h8 h8 h8 h 12 h12 h12 h12 h12 h 24 h24 h24 h24 h24 h
shGFPshGFPshGFPshGFPshGFP shNek2shNek2shNek2shNek2shNek2 0 100 200 300 400 500 Counts
0 200 400 600 800 1,000
FL2-4 GI: 7.18% S: 4.92% G2/M: 87.49% 0 100 200 300 400 500 Counts
0 200 400 600 800 1,000
FL2-4 GI: 63.34% S: 2.75% G2/M: 33.15% 0 100 200 300 400 500 Counts
0 200 400 600 800 1,000
FL2-4 GI: 49.3% S: 28.09% G2/M: 21,77% 0 100 200 300 400 500 Counts
0 200 400 600 800 1,000
FL2-4 GI: 25.43% S: 28.27% G2/M: 46.16% 0 100 200 300 400 500 Counts
0 200 400 600 800 1,000
FL2-4 GI: 61.7% S: 2.47% G2/M: 19.15% 0 100 200 300 400 500 Counts
0 200 400 600 800 1,000
FL2-4 GI: 8.44% S: 9.56% G2/M: 81.71% 0 100 200 300 400 500 Counts
0 200 400 600 800 1,000
FL2-4 GI: 58.34% S: 4.28% G2/M: 36.53% 0 100 200 300 400 500 Counts
0 200 400 600 800 1,000
FL2-4 GI: 69.4% S: 8.29% G2/M: 21,75% 0 100 200 300 400 500 Counts
0 200 400 600 800 1,000
FL2-4 GI: 58.24% S: 22.97% G2/M: 18.33% 0 100 200 300 400 500 Counts
0 200 400 600 800 1,000
FL2-4
GI: 61.81% S: 20.44% G2/M: 21.54%
Figure 1. (Cont.). D. Figure 1. (Cont.). D.Figure 1. (Cont.). D.
Figure 1. (Cont.). D.Figure 1. (Cont.). D. Expressions of the cell cycle regulatory factors that were affected by NEK2. Left: representative images of Western blotting and RT-PCR for the detection of the expression levels of p27, E2F1, phosphorylated AKT, and cyclin D1; right: summary of the data from three independent ex-periments. The p-AKT level in the bar chart indicates the ratio of the intensity of phosphorylated AKT to the total AKT. Actin served as the internal control. *: p < 0.05. **: p < 0.01. ***: p < 0.001.
analysis was used to screen for the clinicopathologic fac-tors that were correlated with HCC recurrence. Facfac-tors for which the p-value was < 0.1 (a value that is commonly used to screen for significant factors for uni- to multivari-ate analyses) were retained for multivarimultivari-ate regression
analysis.22,23 The HCC recurrence probabilities for
differ-ent combinations of Nek2 level and AJCC stage (i.e., well/
moderately and poorly differentiated stages) were then es-timated based on Cox proportional hazards analyses. The relative risk scores of the various combinations in the groups with well/moderately and poorly differentiated tu-mors were computed, and Cox survival curves were de-veloped.
RESULTS
To characterize the role of NEK2 in HCC progression, its effect on the proliferation of HCC cells was first ana-lyzed. Based on the direct cell counting and colony
forma-tion assays, the Nek2 knockdown cells exhibited lower
cell propagation and colony formation, whereas those that
overexpressed Nek2 exhibited the opposite effects, which
indicated that NEK2 promotes the proliferation of hepatoma HuH7 cells (Figure 1A and B). Recent studies have found that the nuclear localization of NEK2 is associ-ated with worse prognoses for some cancers, implying that NEK2 plays a unique role in interphase. We found that, af-ter the synchronization of cells in the M phase with
noco-dazole treatments, the Nek2 KD cells exhibited delayed G1
to S phase cell cycle progression, as 8 h after the release
from arrest, 69% and 49% of the Nek2 KD and HuH7
con-trol cells remained in G1 phase, respectively; 12 h after
the release, the corresponding values were 58% and 25% (Figure 1C). These findings indicate that NEK2 promotes G1 to S phase cell cycle progression. Additionally, the
knockdown of Nek2 caused decreases in cyclin D1 and
E2F1 and AKT phosphorylation, as well as an increase in
the cyclin-dependent kinase inhibitor p27kip1 (Figure
1D).24,25 Taken together, these results indicate that NEK2 regulates the expression of G1-S cell cycle factors and thereby enhances G1 to S progression.
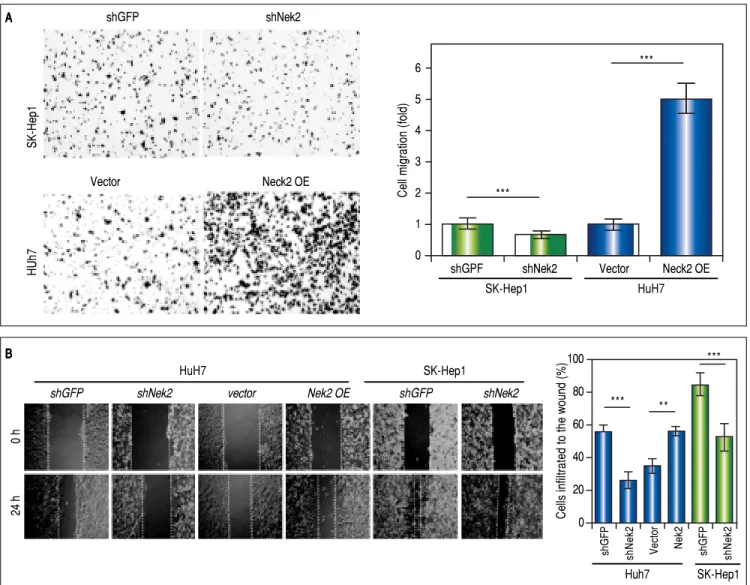
The effects of NEK2 on the invasion and migration of HuH7 and SK-Hep1 hepatoma cells were investigated. Analyses of the Transwell migration and wound healing
assays revealed that the Nek2 expression level was
positive-ly correlated with the cell migration and wound healing activities (Figure 2A and B). Additionally, the small-mole-cule NEK2 inhibitor pelitinib (EKB-569), which binds to the NEK2 catalytic site with high affinity and blocks its kinase activity, was used to validate the effects of NEK2
on cell migration.19 The results revealed that while
pelitinib at the concentrations used to treat the HuH7 (5
μM) and SK-Hep1 (1 μM) cells did not cause significant
cytotoxicity (Figure 2C), it greatly reduced the migration activities of the HuH7 and SK-Hep1 cells, which supports the notion that NEK2 is an essential factor for HCC cell migration (Figure 2D). Furthermore, analysis of the
Matrigel cell invasion assays revealed that Nek2 KD
signif-icantly decreased the invasion activities (Figure 2E). In these cells, the level of NEK2 was closely correlated with the levels of invasion factors, including MMP9 and E-cad-herin, which indicated that NEK2 promotes HCC inva-sion by regulating the expresinva-sions of these essential
invasion factors (Figure 2F).26
D D D D D
Relative expression level (fold)
2.0
1.5
1.0
0.5
0.0
p27 E2F1 p-AKT cyclin D1
shGFP shNek
Nek2
cyclin D1
actin
NEK2
p27
E2FI
p-AKT
AKT
Actin
shGFP shNEK2 shGFP shNEK2
*** * *
Figure 2. Figure 2. Figure 2. Figure 2.
Figure 2. Enhancement of cell migration and invasion by NEK2 in hepatoma cells. A.A.A.A.A. The Transwell migration assay to detect the effect of NEK2 on the mi-gration abilities of the HuH7 and SK-Hep1 hepatoma cells. The Nek2 KD (shNek2) and control (shGFP) cells, as well as the cells overexpressing Nek2 (Nek2
OE) and the plasmid vector were analyzed. Left: representative images of the migrated cells among the various analyzed cell types; right: quantitation of the migrated cells summarized over three independent experiments. B.B.B.B. Wound healing assays. The B. Nek2 KD and overexpressing cells were analyzed for their mi-gration activities toward a pre-cut wound in confluent cell cultures. Left: representative images of the data before (0 h) and after 24 h of incubation (24 h). The dotted lines indicate the edges of the wounds. Right: measurement of the percent of the areas of the cell wounds that were infiltrated by cell migration after 24 h of incubation summarized over the data from three independent experiments.
A A A A A
B B B B B
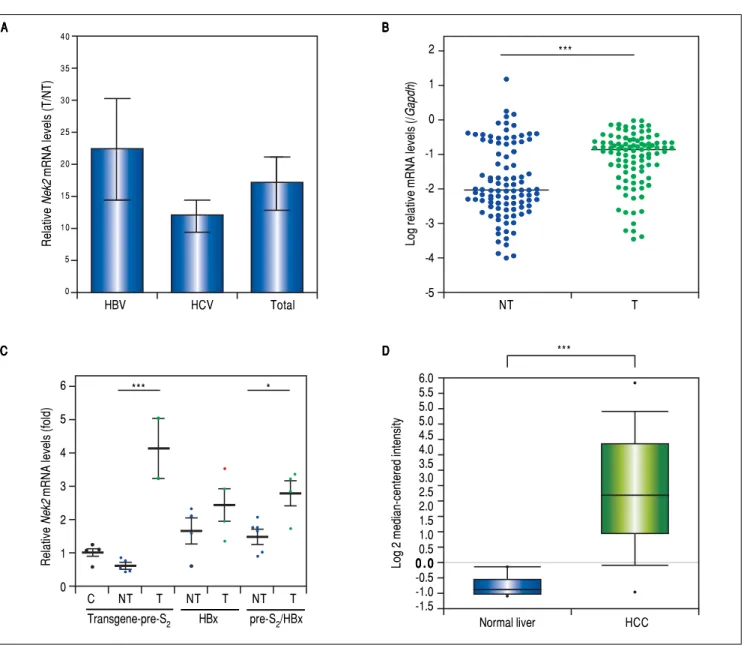
Given the findings that NEK2 contributes to the migra-tion and invasion of HCC cells, an HCC cohort of pa-tients who had undergone curative resection surgeries in NCKUH was recruited for the relevant clinical observa-tions. Based on the cDNA microarray analysis (N = 12), both HBV- and HCV-related HCCs presented with
in-creases in the Nek2 mRNA levels in the tumors compared
with the levels in the peri-tumorous liver tissues (Figure 3A). Ninety-seven HBV-related HCC cases were further
analyzed by real-time RT-PCR, which revealed that Nek2
expression in the tumorous regions was much higher than that in the peri-tumorous regions (Figure 3B). Additional-ly, the transgenic mice carrying the HBV oncogenes HBx
and pre-S2 mutant LHBS and those carrying both genes all
exhibited significant increases in Nek2 expression in the
HCC tumors (Figure 3C). Similarly, in the Oncomine
HCC database, Nek2 induction in primary liver cancer (N
= 75) is clearly demonstrated (with a median increase val-ue of 8-fold) compared with normal livers. The
correla-tion of the Nek2 expression level with HCC recurrence in
our cohort was further examined. Based on a multivariate regression statistical analysis, among the various
clinico-pathological factors analyzed, only the Nek2 induction
lev-el in the tumor (T) compared with the adjacent non-tumorous (NT) region and the AJCC stage (stage III
vs. I/II) were found to be correlated with the HCC
recur-Cells infiltrated to the wound (%)
100 80 60 40 20 0
*** **
***
shGFP shNek2 Vector Nek2 shGFP shNek2
Huh7 SK-Hep1
shGFP shNek2
Vector Neck2 OE
HUh7
SK-Hep1
shGPF shNek2 Vector Neck2 OE
SK-Hep1 HuH7
Cell migration (fold)
6 5 4 3 2 1 0
***
***
HuH7 SK-Hep1
shGFP shNek2 vector Nek2 OE shGFP shNek2
24 h
0
Figure 2. (Cont.). Figure 2. (Cont.).Figure 2. (Cont.).
Figure 2. (Cont.).Figure 2. (Cont.). C.C.C.C.C. Cytotoxicities of pelitinib to the HuH7 and SK-Hep1 cells as detected with MTT assays. Pelitinib was examined for its cytotoxicity at the concentrations used in the Transwell migration assays of the HuH7 (1 μM) and SK-Hep1 (5 μM) cells. The bar charts represent data summarized from three independent experiments. At the indicated dosages, pelitinib did not cause significant cell death. D.D.D.D.D. Inhibition of cell migration by the NEK2 inhibitor pelitinib as demonstrated in the Transwell migration assays with the HuH7 (1 μM) and SK-Hep1 (5 μM) cells. The left and right panels display representative images and quantitation of the data from three independent experiments, respectively.
C C C C C
D D D D D
rence rate (Table 2). Moreover, among the patients with the same tumor AJCC stage and differentiation grade (i.e.,
poor or well/moderate), those with higher Nek2 levels
ex-hibited higher odds ratios for recurrence than did the oth-er patients (Table 3). The relative HCC recurrence risks in the post-hepatic resection patients were calculated based on a Cox proportional hazards analysis using the
Nek2 level (level 1 to 3), the tumor AJCC stage (I/II vs.
III) and the differentiation grade (well/moderate vs. poor)
as covariables. This Cox analysis revealed that, for the pa-tients with tumors at the same AJCC stage and
differentia-tion grade, those with higher Nek2 levels had higher risk
scores than did those with lower Nek2 levels. The tumor
AJCC stage and differentiation grade also exhibited strong correlations with the HCC recurrence risk (Table 4). Cox
survival curves were developed to examine the time-relat-ed HCC recurrence probabilities of the post-hepatic re-section patients (Figure 4A). These curves can potentially serve as a convenient method for predicting the recurrence risk of HCC patients. In parallel, a similar finding was re-ported in the HCC database (N = 371) of the cBioPortal for Cancer Genomics, which reported positive correlations
of alterations in Nek2 expression with disease-free and
overall survival rates after hepatectomy surgeries (Figure 4B). Taken together, the findings of others and ours in
vari-ous HCC cohorts indicate that the Nek2 level in HCC is a
promising biomarker for a high risk of recurrence in pa-tients following curative resection surgeries.
Recent studies have demonstrated that the cell cycle factors FOXM1 and PLK1 up-regulate the expression of
Cell survival (% of control)
120 100 80 60 40 20 0
SK-Hep1 HuH7
0 1 0 5 +Pelitinib (μM)
HUh7
SK-Hep1
DMSO Pelitinib
Cell migration (fold)
1.2 1.0 0.8 0.6 0.4 0.2 0.0
*** ***
- + - + Pelitinib
Figure 2 (Cont.). Figure 2 (Cont.). Figure 2 (Cont.). Figure 2 (Cont.).
Figure 2 (Cont.). E.E.E.E.E. The Matrigel invasion assay to detect the cell invasion activities in the Nek2 KD (shNek2), control (shGFP) HuH7 and SK-Hep1 cells. Left, representative images of the cells that migrated through the Matrigel; right, quantitation of the invaded cells summarized from the data from three inde-pendent experiments. F.F.F.F. Western blotting to detect the levels of the cell invasion markers E-cadherin and MMP9, which are regulated by NEK2. F. Nek2 KD (shNek2) caused a significant decrease in MMP9 and an increase in E-cadherin. The left and right panels display representative images and quantitation of the data from three independent experiments (mean ± S.D.), respectively. **: p < 0.01. ***: p < 0.001.
E E E E E
F FF FF
Nek2, which enables Nek2 to execute its tasks in
centro-some separation and maturation.27-30 In the FoxM1
-overex-pressing cells, Nek2 as well as Plk1 and β-catenin were
induced, and all of these increases were abolished by the
FOXM1 inhibitor thiostrepton (5 mM).31 In the Plk1 KD
cells, Nek2 was also greatly down-regulated (Figure 5A).
These results supported the notion that FOXM1 and
PLK1 up-regulated Nek2 expression and β
-catenin-medi-ated invasion. Furthermore, the real-time RT-PCR
analy-ses revealed that the expression levels of both the FoxM1
and Plk1 genes were greatly enhanced in the HCC tumors
as was Nek2 (Figure 5B). However, in contrast to Nek2,
neither FoxM1 nor Plk1 exhibited a positive correlation
with HCC recurrence (Figure 5C). These findings
indi-cate that, although the NEK2 activators FOXM1 and PLK1 play some roles in activating NEK2 in HCC, NEK2 be-haves as a unique oncogenic factor that promotes HCC re-currence and can potentially serve as a biomarker for a high risk of recurrence.
DISCUSSION
Currently, deep analysis and interpretation of biomark-ers in cancer tissue is the most important approach for the
execution of precision cancer medicine.32 Exploration of
targetable biomarkers in cancer patients is the most high-lighted field in the new generation of cancer therapy
ap-proaches.33 In this study, using whole-genome cDNA
Protein level (fold)
6 5 4 3 2 1 0
***
**
E-cadherin MMP9
shGFP shNek2
shGFP shNek2
HUh7
SK-Hep1
HuH7
shGFP shNek2
NEK2
E-cadherin
MMP9
Actin
Cell invasion (fold)
1.2 1.0 0.8 0.6 0.4 0.2 0.0
shGFP shNek2 shGFP shNek2
SK-Hep1 HuH7
Figure 3. Figure 3.Figure 3.
Figure 3.Figure 3. Overexpression of Nek2 in tumors in HCC patients and HBV HBx/pre-S2 mutant LHBS transgenic mice. Nek2 expressions were detected in the HCC patients (N = 12) by cDNA microarray and in the HBV-related HCC patients (N = 97) and HBx/pre-S2 mutant LHBS transgenic mice by real-time RT-PCR. A.A.A.A.A. Nek2 overexpression in human HCC as detected with the cDNA microarray analysis. Both the HBV- (N = 6) and HCV-related (N = 6) HCCs exhibit-ed significant increases in Nek2 mRNA in the tumors. The data are indicated by the mean ± the S. E. M. B.B.B.B. Real-time RT-PCR to detect the B. Nek2 mRNA levels in the tumorous (T) and adjacent non-tumorous (NT) regions in the HCC cases (N = 97). The data are indicated as the relative mRNA levels of Nek2 to the Gapdh internal control gene in the same patient. The bar represents the median value for the set of samples. (C) Real-time RT-PCR to detect Nek2 ex-pressions in the HCCs in the HBx (N = 4), pre-S2 mutant LHBS (N = 5), HBx/pre-S2 mutant LHBS double (N = 5) transgenic, and control C57BL/6 (N = 5) mice. D.D.D.D.D. Overexpression of Nek2 in the human primary HCCs and the corresponding normal liver tissues (N =75) as presented in the Oncomine™ Cancer Microarray Database. *: p < 0.05. ***: p < 0.001.
microarray analysis of surgically resected HCC tissues, we
found that the cell cycle factor gene Nek2 was greatly
over-expressed in tumors, and it was also highly correlated with the recurrence rate. In addition to its function in M phase progression, NEK2 was found to play an important role in G1 to S phase progression that is mediated by the regula-tion of the activities of some G1/S cell cycle checkpoints,
which indicates that the function of NEK2 in interphase likely promotes cell proliferation and cancer metastasis. Interestingly, the upstream activators of NEK2, i.e., FOXM1 and PLK1, were not correlated with recurrence despite being overexpressed in most of the analyzed tu-morous HCC tissues, which suggests that NEK2 is a
unique factor in regulation of cancer progression.27-30
Sev-A A A A A
C C C C C
B BB B B
D DD D D
HBV HCV Total
Relative
Nek2
mRNA levels (T/NT)
40
35
30
25
20
15
10
5
0
Relative
Nek2
mRNA levels (fold)
6
5 4
3 2
1
0
*** *
Transgene-pre-S2 HBx pre-S2/HBx
6.0 5.5 5.0 5.0 4.5 4.0 3.5 3.0 2.5 2.0 1.5 1.0 0.5 0 . 0 0 . 0 0 . 0 0 . 0 0 . 0 -0.5 -1.0 -1.5
Normal liver HCC
***
Log 2 median-centered intensity
2
1
0
-1
-2
-3
-4
-5
***
Log relative mRNA levels (/
Gapdh
)
NT T
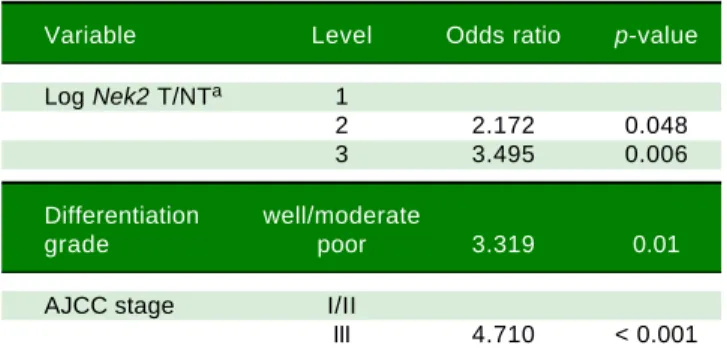
Table 3. Odds ratios for HCC recurrence based on the AJCC stage, Nek2 level and differentiation grade (Fisher’s exact test).
Variable Level Odds ratio p-value
Log Nek2 T/NTa 1
2 2.172 0.048
3 3.495 0.006
Differentiation well/moderate
grade poor 3.319 0.01
AJCC stage I/II
III 4.710 < 0.001
a Nek2 induction levels in the tumorous (T) compared with the adjacent non-tumorous (NT) regions: 1, LogNek2 T/NT < 0.0112; 2, 0.0112-3.67; 3, > 3.67.
Table 4. Cox proportional hazards risk scores for HCC
recur-rence based on the AJCC stage, Nek2 level, and differentiation grade.
Nek2 Level AJCC stage Risk score
well/moderatea poora
1 I/IIb 1 3.319
2 I/IIb 2.172 5.491
3 I/IIb 3.495 6.814
1 III 4.710 8.029
2 III 6.882 10.201
3 III 8.205 11.524
a Tumor differentiation grade. b Tumor AJCC stage I or II.
Table 2. Multivariate regression analysis of the correlations of the various clinicopathologic factors with HCC recurrence.
Variable Univariate Multivariate
Hazard ratio p value Hazard ratio p value
(95% CI)a (95% CI)
Nek2
T/NTb 1.11 0.075 1.13 0.047
(0.98 – 1.25) (1.01-1.28)
Nek2
T/Gadphc 1.13 0.159
(0.95-1.35)
ALTd 0.91 0.648
(0.61-1.36)
ASTe 1.85 0.031 1.25 0.443
(1.06-3.23) (0.71-2.19)
Cirrhosis
Yes vs. no 0.86 0.578
(0.51-1.46)
Gender
Male vs. female 0.93 0.802
(0.51-1.68)
Histological grade
Moderate vs. well 1.12 0.761 0.58 0.197
(0.54-2.32) (0.26-1.32)
Poor vs. well 3.82 0.009 1.32 0.651
(1.40-10.39) (0.40-4.36)
AJCC stage
II vs. I 1.58 0.158 1.31 0.453
(0.84-2.98) (0.64-2.68)
III vs. I/II 5.75 < 0.001 5.49 < 0.001
(2.85-11.60) (2.44-12.35)
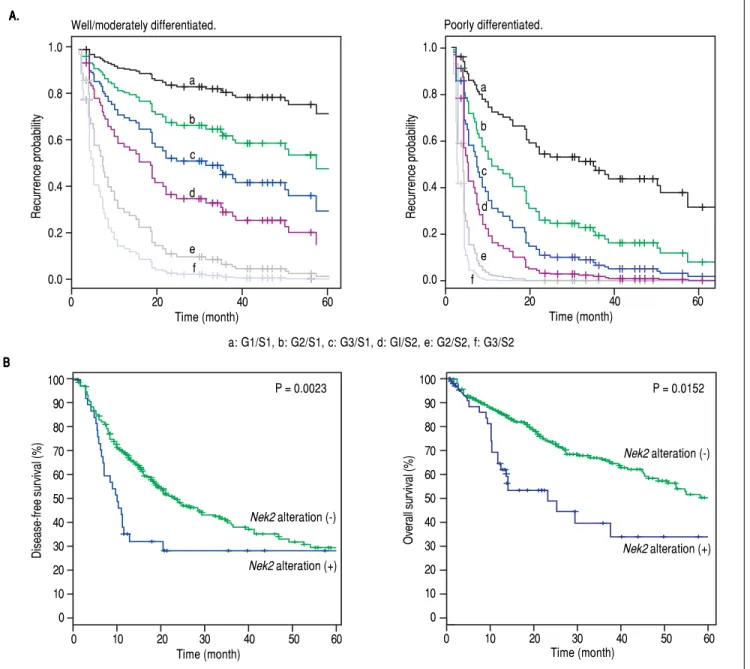
Figure 4. Figure 4.Figure 4.
Figure 4.Figure 4. Correlation of Nek2 expression with HCC recurrence. A.A.A.A.A. Cox survival curves for the HCC cases shown according to the risk scores of the AJCC stages (S) and Nek2 expression levels (G, also summarized in Table 4). In the well/moderately and poorly differentiated HCC group, both the AJCC stage and
Nek2 expression are correlated with the recurrence probabilities after curative hepatic resections. B.B.B.B.B. Correlations of the alterations of Nek2 expression in the HCCs with the disease-free (left) and overall survivals as presented in the HCC database of cBioPortal for Cancer Genomics. The threshold for gene expres-sion alteration (Z-score) in a tumor was a 1.8-fold increase or decrease compared with the level expressed in the peri-tumorous region. Both of HCC disease-free (p value 0.0023) and overall (p value 0.0152) survival rates are correlated with alterations of Nek2 expression in the tumor.
eral other studies in different populations have made
simi-lar findings that Nek2 expression level in HCC was
corre-lated with high proliferation, invasion, and recurrence
rates.34-36 Therefore, the current study in our HCC cohort
in Southern Taiwan has revealed consistent findings with those in other regions, and together, clearly demonstrated that NEK2 is indeed an important high-risk factor for HCC progression.
The effect of NEK2 on cancer progression has been well documented mainly through its involvement in cen-trosome duplication and separation, which promotes
mi-tosis progression.10-14 Thus, the expression of NEK2 has
been reported to correlate with increased β-catenin
relo-calization and shortened cancer-related survival time.16
NEK2 has also been found to co-localize with nuclear splicing speckles through its interaction with and
A. A. A. A. A.
B B B B B
Poorly differentiated.
100 90 80 70 60 50 40 30 20 10 0
0 10 20 30 40 50 60
Time (month)
P = 0.0023
Disease-free survival (%)
Nek2 alteration (-)
Nek2 alteration (+)
P = 0.0152 100
90 80 70 60 50 40 30 20 10 0
Overall survival (%)
Nek2 alteration (-)
Nek2 alteration (+)
0 10 20 30 40 50 60
Time (month)
Recurrence probability
1.0
0.8
0.6
0.4
0.2
0.0 a
b
c
d
e f
0 20 40 60
Time (month) 1.0
0.8
0.6
0.4
0.2
0.0
0 20 40 60
Recurrence probability
a
b
c
d
e f
Time (month) Well/moderately differentiated.
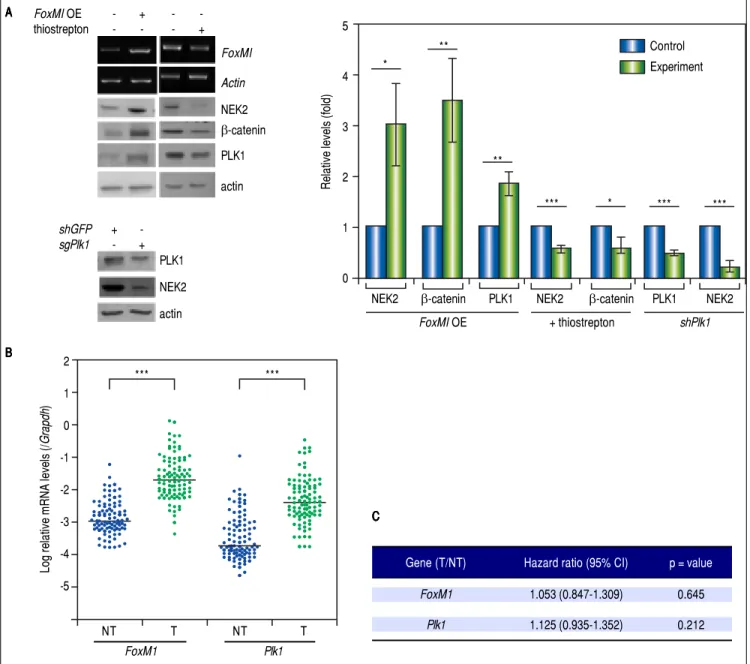
Figure 5. Figure 5. Figure 5. Figure 5.
Figure 5. The levels of the NEK2 activators FOXM1 and PLK1 are increased in HCC but are not correlated with recurrence. A.A.A.A. A.FoxM1 was over-expressed by plasmid transfection in HuH7 cells. Western blotting and RT-PCR assays revealed that FoxM1 overexpression (FoxM1 OE) increased the levels of NEK2, PLK1, and β-catenin, whereas the FOXM1 inhibitor thiostrepton (5 mM) decreased these levels. Knockdown of Plk1 with shRNA also caused a decrease in NEK2. Left, representative images of the experimental results. Right, quantitation of the data summarized from three independent experiments. Control, mock-treated cells; experiment, the cells transfected with exogenous gene or KD constructs or treated with thiostrepton. B.B.B.B. Expressions of B. FoxM1 and Plk1 in the tumorous (T) and adjacent non-tumorous (NT) regions of the HCCs (N = 97) as detected by real-time RT-PCR. The levels of the FoxM1 and Plk1 mR-NAs were normalized to that of the housekeeping gene Gapdh. *: p < 0.05. **: p < 0.01. ***: p < 0.001. C.C.C.C. Neither the C. FoxM1 nor the Plk1 mRNA level in the tumor (T) compared with the level in the non-tumorous (NT) region was correlated with HCC recurrence after curative hepatic resections as indicated by Fisher’s exact statistical tests.
phorylation of the oncogenic splicing factors serine/ar-ginine-rich splicing factor (SRSF) 1 and 2, which facilitate the splicing of the pyruvate kinase transcript and promotes
aerobic glycolysis in multiple myeloma.37,38 Here, we also
found that NEK2 enhanced AKT phosphorylation and
p27Kip1 degradation, which led to the G1-to-S transition
and thus demonstrated a new role of NEK2 in regulating cancer progression in interphase.
The expression of and associated centrosomal functions of NEK2 have been demonstrated to be regulated through oncoprotein FOXM1-mediated transactivation activity, which has been reported to enhance G1/S and G2/M cell
A A A A A
B B B B B
FoxMI
Actin
NEK2
β-catenin PLK1 actin
FoxMI OE - + -
-thiostrepton - - - +
shGFP +
-sgPlk1 - +
PLK1 NEK2 actin
Log relative mRNA levels (/
Grapdh
)
2 1 0 -1 -2 -3 -4 -5
*** ***
FoxM1 Plk1
NT T NT T
Relative levels (fold)
5
4
3
2
1
0
Control Experiment *
**
**
*** * *** ***
NEK2 β-catenin PLK1 NEK2 β-catenin PLK1 NEK2
FoxMI OE + thiostrepton shPlk1
C CC CC
Gene (T/NT) Hazard ratio (95% CI) p = value
FoxM1 1.053 (0.847-1.309) 0.645
cycle progression, tumor initiation and metastasis.29,30 In
the current study, the expression level of FoxM1 was
found to be greatly increased in the tumorous HCCs com-pared with the peri-tumorous regions. In hepatoma cells, the overexpression of FoxM1 also increased the level of
NEK2. However, unlike Nek2, FoxM1 did not exhibit a
significant correlation with HCC recurrence, suggesting that NEK2 mediates HCC progression through FOXM1-dependent and FOXM1-inFOXM1-dependent pathways and can serve as a unique promising biomarker for a high risk of HCC recurrence. Similarly, PLK1, which has been found to regulate NEK2 phosphorylation and thereby promote
the stabilization of β-catenin and centrosome disjunction,
has been found to increase the level of NEK2 in hepatoma
cells.27,28 Moreover, similar to FoxM1, the mRNA levels of
Plk1 were greatly increased in the HCC tumors; however,
unlike Nek2, the Plk1 levels did not exhibit a correlation
with HCC recurrence. Taken together, these results sup-port the strong and unique positive association of NEK2 with HCC recurrence that is likely mediated by its
inte-grated effects on the activation of β-catenin transactivation
and the promotion of cell cycle progression in the M- and inter-phases.
In the current study, based on the Cox proportional hazard statistical analysis of the HCCs that were stratified by tumor differentiation stage, a predictive model indicat-ing the recurrence probabilities in relation to time after surgery was developed using the AJCC tumor stage and
the Nek2 induction level as covariables. This model could
potentially serve as a convenient method for identifying the HCC patients who are at a relatively high risk for re-currence after surgery and those who ought to undertake intensive adjuvant therapies. In conclusion, the results of this study identified NEK2 as an important factor for the high risk of HCC recurrence after curative hepatic resec-tion, and together with tumor AJCC stage and differentia-tion status, NEK2 could serve as a promising biomarker for precision medicine.
ABBREVIATIONS
• BCLC: Barcelona Clinic Liver Cancer.
• CDC: cell division cycle.
• CEP: centrosome-associated protein.
• FoxM1: forkhead box protein M1.
• HCC: hepatocellular carcinoma.
• MAD2L1: mitotic arrest deficient 2 like 1.
• NASH: non-alcoholic fatty liver disease.
• NEK2: NIMA-related kinase 2.
• NINL: ninein-like.
• PLK1: polo-like kinase 1.
• RT-PCR: reverse transcription-polymerase chain re-action.
• shRNAs: short hairpin RNAs.
• SRSF: serine/arginine-rich splicing factor.
• TGCT: testicular gem cell tumors.
FUNDING
This study was supported by the Taiwan Ministry of Science and Technology (grant nos. 106-2622-B-006-003-CC2 and 106-2320-B-006-048-MY3 to WH), the Taiwan Ministry of Health and Welfare (grant no. MOHW106-TDU-B-211-113003 to CJY and WH), and the National Cheng Kung University Center of Infectious Disease and Signaling Research (grant no. D105-22004 to WH).
AUTHOR CONTRIBUTIONS
YYC, YWC, and CYB analyzed the growth and cell cy-cle progression of hepatoma cells and drafted the manu-script; CJY recruited the main HCC study participants, did the clinical follow-up, and drafted the manuscript; SHC and YPL did the statistical analyses; CJH performed the analyses of the clinicopathological factors in HCC pa-tients; and WH designed the study. All authors read and approved the final manuscript.
REFERENCES
1. Jemal A, Bray F, Center MM, Ferlay J, Ward E, Forman D. Global cancer statistics. CA Cancer J Clin 2011; 61: 69-90. 2. Bosetti C, Turati F, La Vecchia C. Hepatocellular carcinoma
epidemiology. Best Pract Res Clin Gastroenterol 2014; 28: 753-70.
3. Arbuthnot P, Kew M. Hepatitis B virus and hepatocellular carcinoma. Int J Exp Pathol 2001; 82: 77-100.
4. Bruix J, Sherman M, Llovet JM, Beaugrand M, Lencioni R, Burroughs AK, Christensen E, et al. Clinical management of hepatocellular carcinoma. Conclusions of the Barcelona-2000 EASL conference. European Association for the Study of the Liver. EASL Conference. J Hepatol 2001; 35: 421-30. 5. Zhu K, Dai Z, Zhou J. Biomarkers for hepatocellular
carcino-ma: progression in early diagnosis, prognosis, and personal-ized therapy. Biomark Res 2013; 1: 10.
6. Hui AM, Makuuchi M, Li X. Cell cycle regulators and human hepatocarcinogenesis. Hepato Gastroenterology 1998; 45: 1635-42.
7. Ou Y, Rattner JB. The centrosome in higher organisms: structure, composition, and duplication. Int Rev Cytol 2004; 238: 119-82.
8. Wang Q, Hirohashi Y, Furuuchi K, Zhao H, Liu Q, Zhang H, Murali R, et al. The centrosome in normal and transformed cells. DNA Cell Biol 2004; 23: 475-89.
9. Fry AM, O’Regan L, Sabir SR, Bayliss R. Cell cycle regulation by the NEK family of protein kinases. J Cell Sci 2012; 125: 4423-33.
10. Hayward DG, Fry AM. Nek2 kinase in chromosome instability and cancer. Cancer Lett 2006; 237: 155-66.
12. Wei R, Ngo B, Wu G, Lee WH. Phosphorylation of the Ndc80 complex protein, HEC1, by Nek2 kinase modulates chromo-some alignment and signaling of the spindle assembly check-point. Mol Biol Cell 2011; 22: 3584-94.
13. Sonn S, Jeong Y, Rhee K. Nip2/centrobin may be a sub-strate of Nek2 that is required for proper spindle assembly during mitosis in early mouse embryos. Mol Reprod Dev 2009; 76: 587-92.
14. Liu Q, Hirohashi Y, Du X, Greene MI, Wang Q. Nek2 targets the mitotic checkpoint proteins Mad2 and Cdc20: a mecha-nism for aneuploidy in cancer. Exp Mol Pathol 2010; 88: 225-33.
15. Barbagallo F, Paronetto MP, Franco R, Chieffi P, Dolci S, Fry AM, Geremia R, et al. Increased expression and nuclear lo-calization of the centrosomal kinase Nek2 in human testicular seminomas. J Pathol 2009; 217: 431-41.
16. Neal CP, Fry AM, Moreman C, McGregor A, Garcea G, Berry DP, Manson MM. Overexpression of the Nek2 kinase in colorectal cancer correlates with beta-catenin relocalization and shortened cancer-specific survival. J Surg Oncol 2014; 110: 828-38.
17. Moffat J, Grueneberg DA, Yang X, Kim SY, Kloepfer AM, Hinkle G, Piqani B, et al. A lentiviral RNAi library for human and mouse genes applied to an arrayed viral high-content screen. Cell 2006; 124: 1283-98.
18. Hsieh YH, Su IJ, Yen CJ, Tsai TF, Tsai HW, Tsai HN, Huang YJ, et al. Histone deacetylase inhibitor suberoylanilide hy-droxamic acid suppresses the pro-oncogenic effects in-duced by hepatitis B virus pre-S2 mutant oncoprotein and represents a potential chemopreventive agent in high-risk chronic HBV patients. Carcinogenesis 2013; 34: 475-85. 19. Das TK, Dana D, Paroly SS, Perumal SK, Singh S, Jhun H,
Pendse J, et al. Centrosomal kinase Nek2 cooperates with oncogenic pathways to promote metastasis. Oncogenesis 2013; 2: e69.
20. Hsieh HC, Hsieh YH, Huang YH, Shen FC, Tsai HN, Tsai JH, Lai YT, et al. HHR23A, a human homolog of Saccharomyces cerevisiae Rad23, regulates xeroderma pigmentosum C pro-tein and is required for nucleotide excision repair. Biochem Biophys Res Commun 2005; 335: 181-7.
21. Hsieh YH, Chang YY, Su IJ, Yen CJ, Liu YR, Liu RJ, Hsieh WC, et al. Hepatitis B virus pre-S2 mutant large surface pro-tein inhibits DNA double-strand break repair and leads to ge-nome instability in hepatocarcinogenesis. J Pathol 2015; 236: 337-47.
22. Hosmer DW, Lemeshow S. Applied Logistic Regression. 3rd ed. John Wiley & Sons, Inc; 2000.
23. Yen CJ, Ai YL, Tsai HW, Chan SH, Su IJ, Yen CS, Cheng YC, et al. Hepatitis B virus surface gene pr-S2 mutant as a high-risk serum marker for hepatoma recurrence after curative hepatic resection. Hepatology [In press] 2018.
24. Koff A, Polyak K. p27KIP1, an inhibitor of cyclin-dependent kinases. Prog Cell Cycle Res 1995; 1: 141-7.
25. Hsieh YH, Su IJ, Wang HC, Tsai JH, Huang YJ, Chang WW, Lai MD, et al. Hepatitis B virus pre-S2 mutant surface antigen induces degradation of cyclin-dependent kinase inhibitor p27Kip1 through c-Jun activation domain-binding protein 1. Mol Cancer Res 2007; 5: 1063-72.
26. Kessenbrock K, Plaks V, Werb Z. Matrix metalloproteinases: regulators of the tumor microenvironment. Cell 2010; 141: 52-67.
27. Mardin BR, Agircan FG, Lange C, Schiebel E. Plk1 controls the Nek2A-PP1ã antagonism in centrosome disjunction. Curr Biol 2011; 21: 1145-51.
28. Mbom BC, Siemers KA, Ostrowski MA, Nelson WJ, Barth AI. Nek2 phosphorylates and stabilizes beta-catenin at mitotic centrosomes downstream of Plk1. Mol Biol Cell 2014; 25: 977-91.
29. Calvisi DF, Pinna F, Ladu S, Pellegrino R, Simile MM, Frau M, De Miglio MR, et al. Forkhead box M1B is a determinant of rat susceptibility to hepatocarcinogenesis and sustains ERK ac-tivity in human HCC. Gut 2009; 58: 679-87.
30. Wonsey DR, Follettie MT. Loss of the forkhead transcription factor FoxM1 causes centrosome amplification and mitotic catastrophe. Cancer Res 2005; 65: 5181-9.
31. Jiang L, Wang P, Chen L, Chen H. Down-regulation of FoxM1 by thiostrepton or small interfering RNA inhibits proliferation, transformation ability and angiogenesis, and induces apopto-sis of nasopharyngeal carcinoma cells. Int J Clin Exp Pathol 2014; 7: 5450-60.
32. Garofalo A, Sholl L, Reardon B, Taylor-Weiner A, Amin-Man-sour A, Miao D, Liu D, et al. The impact of tumor profiling ap-proaches and genomic data strategies for cancer precision medicine. Genome Med 2016; 8: 79.
33. Smith AD, Roda D, Yap TA. Strategies for modern biomarker and drug development in oncology. J Hematol Oncol 2014; 7: 70.
34. Li G, Zhong Y, Shen Q, Zhou Y, Deng X, Li C, Chen J, et al. NEK2 serves as a prognostic biomarker for hepatocellular carcinoma. Int J Oncol 2017; 50: 405-13.
35. Wubetu GY, Morine Y, Teraoku H, Yoshikawa M, Ishikawa D, Yamada S, Ikemoto T, et al. High NEK2 expression is a pre-dictor of tumor recurrence in hepatocellular carcinoma pa-tients after hepatectomy. Anticancer Res 2016; 36: 757-62. 36. Wu SM, Lin SL, Lee KY, Chuang HC, Feng PH, Cheng WL,
Liao CJ, et al. Hepatoma cell functions modulated by NEK2 are associated with liver cancerprogression. Int J Cancer 2017; 140: 1581-96.
37. Naro C, Barbagallo F, Chieffi P, Bourgeois CF, Paronetto MP, Sette C. The centrosomal kinase NEK2 is a novel splicing factor kinase involved in cell survival. Nucleic Acids Res 2014; 42: 3218-27.
38. Gu Z, Xia J, Xu HW, Frech I, Tricot G, Zhan FH. NEK2 promotes aerobic glycolysis in multiple myeloma through regulating splic-ing of pyruvate kinase. J Hematol Oncol 2017; 10: 17.
Correspondence and reprint request: Wenya Huang, Ph.D.
Department of Medical Laboratory Science and Biotechnology, College of Medicine, National Cheng Kung University, 1 Univer-sity Road, Tainan 70101, Taiwan. Tel.: +886-6-2353535-5766,