MicroRNA Profile in
Peripheral Blood Mononuclear Cells from
Hepatitis B Virus Infected Patients
Kangkang Yu,* Qian Li,** Ning Li** Department of Infectious Diseases, Huashan Hospital, Fudan University, Shanghai, China. ** Department of General Surgery, Qingdao Municipal Hospital, Qingdao, Shandong, China.
INTRODUCTION
Hepatitis B virus (HBV) infection is a serious public health problem. Two billion people worldwide have been infected with HBV, and among them more than 240 mil-lion are chronic HBV carriers.1 This results in about
650,000 deaths of HBV related liver failure, cirrhosis, and hepatocellular carcinoma annually,2 which bring huge
healthcare cost and socioeconomic burdens.
MicroRNAs (miRNAs), as a class of small non-cod-ing molecules approximately 22 nt in length, play critical roles in the post-transcriptional regulation of gene ex-pression either by repressing translation initiation and protein synthesis, or by inducing degradation of messen-ger RNA (mRNA).3,4 Evidence indicates that miRNAs
play a fundamental role in the control of many biological processes, such as cellular development, differentiation,
proliferation, apoptosis, and metabolism,5 and many
studies have reported a potential link between miRNAs and human diseases.6-8 In HBV-related liver diseases,
re-searches concerning miRNAs mainly focused on hepato-cellular carcinoma.6,9-11 In addition, Ji, et al.12 investigated
the differentially expressed miRNAs in serum during HBV infection and underscored the potential importance of miR-122 in the infection process. More importantly, it is reported that in human lupus, overexpression of miR-146a can reduce the induction of type I interferon (IFN) in peripheral blood mononuclear cells (PBMCs),13
which are the major extrahepatic milieu of infection and viral replication, meantime, is a critical component in the immune system to fight against infection and adapt to intruders. Therefore, to elucidate the pathogenesis of hepatitis B, a better understand of the miRNA expres-sion profile and their biological function in PBMCs in
The Official Journal of the Mexican Association of Hepatology, the Latin-American Association for Study of the Liver and
the Canadian Association for the Study of the Liver
Manuscript received: Manuscript received: Manuscript received: Manuscript received:
Manuscript received: October 30, 2017. Manuscript accepted:Manuscript accepted:Manuscript accepted:Manuscript accepted:Manuscript accepted: March 01, 2018.
DOI:10.5604/01.3001.0012.7201
A B S T R A C T A B S T R A C T A B S T R A C T A B S T R A C T A B S T R A C T
Introduction and aim. Introduction and aim.Introduction and aim. Introduction and aim.
Introduction and aim. The pathogenesis of hepatitis B virus (HBV)-related liver diseases remains not fully understood. Here, we aim to explore the potential roles of dysregulated miRNAs in chronic hepatitis B (CHB) and HBV-related acute-on-chronic liver failure (ACLF). Material and methods.Material and methods.Material and methods.Material and methods.Material and methods. MiRNA microarray was conducted in peripheral blood mononuclear cells (PBMCs) obtained from healthy donors or patients with CHB or ACLF. Altered expression of miRNAs was further confirmed by quantitative real-time polymerase chain reaction (qRT-PCR) analysis. Finally, the differentially expressed miRNAs and their target genes were subjected to bioinformatics analysis. Results.Results.Results.Results.Results. The miRNA microarray identified 45 up-regulated and 62 down-regulated miRNAs with a fold change ≥ 1.5. Expression of eight miRNAs was validated using qRT-PCR analysis, which was consistent with miRNA microarray analysis. Bioinformatics analysis indicated that multiple biological processes and signaling pathways were affected by these miRNAs and a miRNA-gene regulatory network was generated with Cytoscape. Conclusion.Conclusion.Conclusion.Conclusion.Conclusion. The current study provided a global view of miRNA expression in PBMCs from CHB and ACLF patients. Functional analysis showed that multiple biological processes and sig-naling pathways were modulated by these miRNAs. These data provide intriguing insights into the molecular pathogenesis of HBV-related liver diseases, which deserve further investigation.
Key words. Key words.Key words. Key words.
patients with chronic hepatitis B virus infection is of great importance.
In this study, we described the differentially expressed miRNAs in PBMCs from chronic hepatits B (CHB) and HBV-related acute-on-chronic liver failure (ACLF) pa-tients, and identified their potential targets. A subset of differentially expressed miRNAs was validated by quanti-tative real-time polymerase chain reaction (qRT-PCR). We also analyzed the biological function of these miRNAs through bioinformatic analysis. A regulatory network of miRNA-mRNA was constructed to provide new insights into the pathogenesis of hepatitis B.
MATERIALS AND METHODS
Participants
Blood samples were collected from healthy donors (n = 32) or patients with CHB (n = 28) or ACLF (n = 6) that met the eligibility criteria.14 In particular, the ACLF
patients had a history of CHB, with serum total bilirubin more than five times the upper limit of normal (≥ 85
μmol/L), prothrombin activity < 40%, recent occurrence of hepatic encephalopathy (≥ grade II), plus ascites or hepato-renal syndrome. They were also negative for other viruses, e.g., hepatitis C virus, hepatitis D virus and human immunodeficiency virus. Patients had not received any anti-viral treatment or immunotherapy for 6 months prior to blood collection. Healthy donors (n = 20) (age-, sex-and race-matched) had no evidence of prior exposure to HBV (negative for hepatitis B surface antigen). The inves-tigational protocol was approved by the Human Ethics Committee of Shanghai Fudan University, and informed consents were obtained from all study participants.
Generation of
Peripheral blood mononuclear cells (PBMCs)
Blood samples were collected in sterile Vacutainer tubes (BD, Franklin Lakes, NJ) with liquid K3 EDTA. PBMCs from the participants were isolated from 10 mL EDTA-anticoagulated blood samples by density gradient separation using Lympholyte-H (Cedar-lane Laboratories, Ltd., Ontario, Canada).
miRNA extraction and reverse transcription
Total RNA, including miRNAs, was extracted from PBMCs and purified using the miRNeasy mini kit (Qia-gen, Hilden, Germany) following the manufacturer’s in-structions. The RNA concentration was quantified using a
NanoDrop spectrophotometer (Thermo, Fisher Sci-en-tific). The integrity and quality of RNA was evaluated by Agilent 2100 Bioanalyzer (Agilent Technologies). An aliq-uot of 0.25 μg of total RNA was converted to cDNA using the miScript RT kit (Qiagen).
Microarray analysis
A total of nine RNA samples from three healthy do-nors, three CHB patients, and three ACLF patients were further detected by microarray at Guangzhou Ribo, Co., Ltd., using RiboArray miDETECT Human Array 1 x 12K, which contains 2042 human miRNA sequences from the miRBase19.0 database. Labeling and hybridization were performed according to the manufacturer’s protocols. Sig-nals on the slides were scanned using an Agilent G2565BA microarray scanner (Agilent Technologies, Palo Alto, CA). For each sample, triplicates were analyzed at each group for a given detectable miRNA signal. The ratio of the two sets of detected signals (log 2 transformed, balanced) and the P-values of the t-test and ANOVA were calculated. The differentially detected signals with P < 0.05 were ana-lyzed using gene hierarchical clustering of the log 2 value of each different time group and then were displayed in a heatmap. Clustering was performed using Cluster 3.0 cre-ated by Michiel de Hoon, Seiya Imoto, and Satoru Miya-no, University of Tokyo, Human Genome Center (Euclidean distance, links using the average) and viewed in heatmap using Java TreeView 1.0.13 software.
qRT-PCR analysis
qRT-PCR was performed using a miScript SYBR Green PCR kit (Qiagen) according to the manufacturer’s direc-tions on an Mx3000p RT-PCR platform (Stratagene). A universal reverse primer was provided by the manufacturer, and each forward primer was specific to the mature miRNA listed in the Sanger miRBase. The expression of miRNAs was normalized using the U6 small RNA as the endogenous control. The relative amounts of PCR product were deter-mined using the comparative Ct method (2-ΔΔCT).
Data processing
Statistical analysis
Data are expressed as mean ± SD. Differences were compared by one-way ANOVA. A value of P < 0.05 was considered statistically significant. All experiments were performed at least three times.
RESULTS
miRNAs differentialy expressed in PBMCs from patients with CHB/ ACLF
To identify the miRNA spectra, we used a high-throughput miRNA array to compare the miRNA
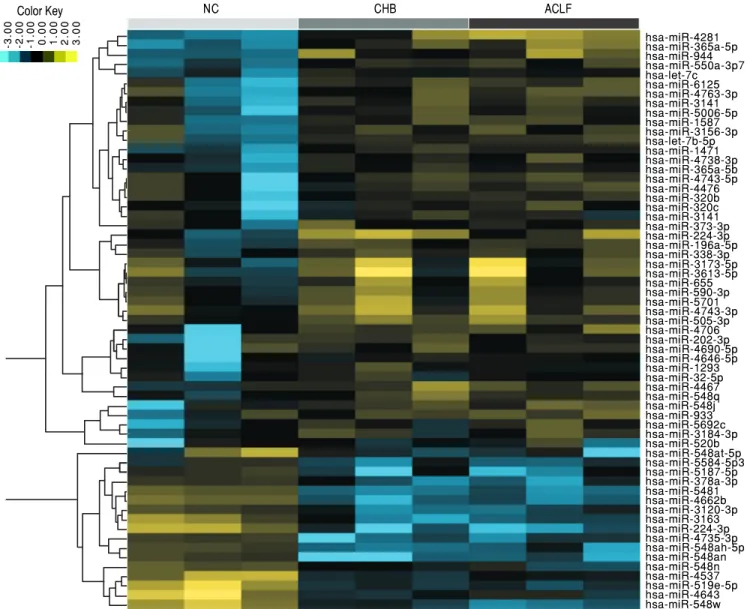
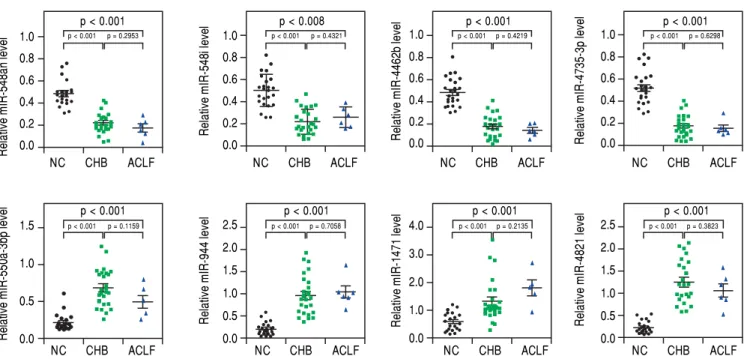
pro-files of the HC, CHB and ACLF groups. Among the aberrantly expressed microRNAs, 107 microRNAs (45 up-regulated and 62 down-regulated) were identified with a fold change ≥ 1.5. Hierarchical clustering was performed on these miRNAs, and a heatmap was pre-sented to visualize the results (Figure 1). To further validate these results, eight miRNAs (miR-548an, miR-548i, miR-4462b, miR-4735-3p, miR-550a-3p, miR-944, miR-1471 and miR-4281) with the most sig-nificant fold change were subjected to qRT-PCR anal-ysis, which showed consistent results with the miRNA array analysis (Figure 2). The demographic and clinical features of patients and healthy individuals are detailed in table 1.
Figure 1. Figure 1. Figure 1. Figure 1.
Figure 1. Hierarchical cluster analysis of the 107 selected miRNAs from health controls, patients with chronic hepatitis B and acute-on-chronic liver failure (ACLF). The heatmap represents color-coded relative expression values in which yellow values indicate over-expression and blue values indicate under-expres-sion. NC: healthy donor. CHB: chronic hepatitis B. ACLF: HBV-related acute-on-chronic liver failure.
hsa-miR-4281 hsa-miR-365a-5p hsa-miR-944 hsa-miR-550a-3p7 hsa-let-7c hsa-miR-6125 hsa-miR-4763-3p hsa-miR-3141 hsa-miR-5006-5p hsa-miR-1587 hsa-miR-3156-3p hsa-let-7b-5p hsa-miR-1471 hsa-miR-4738-3p hsa-miR-365a-5b hsa-miR-4743-5p hsa-miR-4476 hsa-miR-320b hsa-miR-320c hsa-miR-3141 hsa-miR-373-3p hsa-miR-224-3p hsa-miR-196a-5p hsa-miR-338-3p hsa-miR-3173-5p hsa-miR-3613-5p hsa-miR-655 hsa-miR-590-3p hsa-miR-5701 hsa-miR-4743-3p hsa-miR-505-3p hsa-miR-4706 hsa-miR-202-3p hsa-miR-4690-5p hsa-miR-4646-5p hsa-miR-1293 hsa-miR-32-5p hsa-miR-4467 hsa-miR-548q hsa-miR-548j hsa-miR-933 hsa-miR-5692c hsa-miR-3184-3p hsa-miR-520b hsa-miR-548at-5p hsa-miR-5584-5p3 hsa-miR-5187-5p hsa-miR-378a-3p hsa-miR-5481 hsa-miR-4662b hsa-miR-3120-3p hsa-miR-3163 hsa-miR-224-3p hsa-miR-4735-3p hsa-miR-548ah-5p hsa-miR-548an hsa-miR-548n hsa-miR-4537 hsa-miR-519e-5p hsa-miR-4643 hsa-miR-548w
-3
.0
0
-2
.0
0
-1
.0
0
0.0
0
1.0
0
2.0
0
3.0
0
Bioinformatics analysis
To understand the potential roles of these differentialy expressed miRNAs, TargetScan (http://www.targetscan. org/vert_71/) was engaged to predict their target genes. The obtained target genes were further annotated by The Database for Annotation, Visualization and Integrated Dis-covery (https://david.ncifcrf.gov/list.jsp).
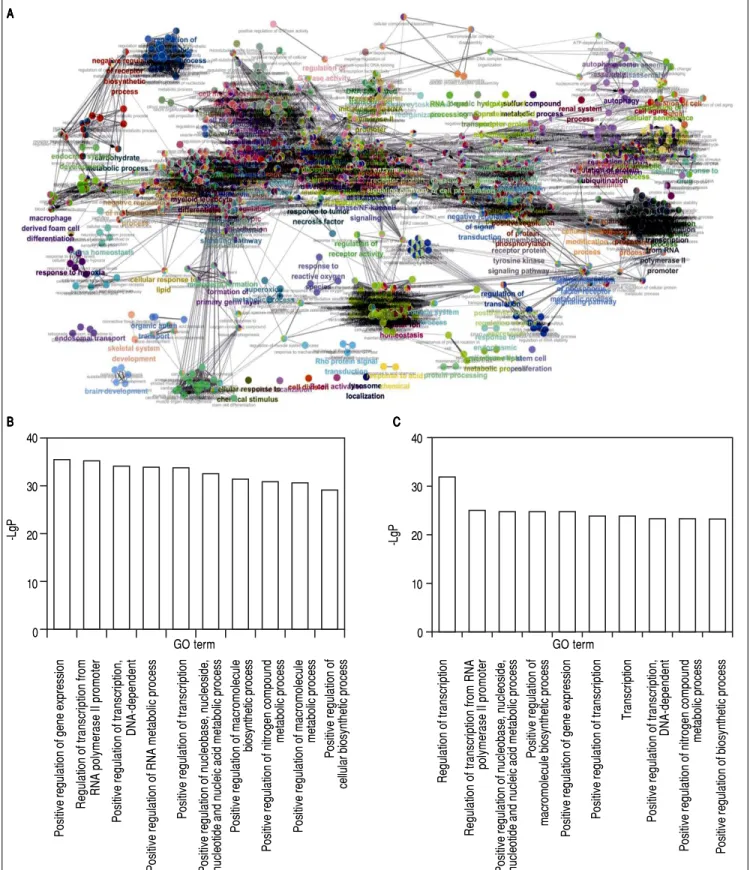
According to the GO enrichment analyses, 908 GOs were modulated by the down-regulated genes, whereas 771 GOs were modulated by the up-regulated genes. An integrative GO analysis of these target genes were showed in figure 3A. The top 10 GO categories involved in genes targeted by the down-regulated miRNAs including positive regulation of gene expression, regulation of transcription from RNA polymerase II promoter, positive regulation of DNA-de-pendent transcription etc. (Figure 3B). while the top 10 GO categories involved in genes targeted by the up-regulated
miRNAs including regulation of transcription, regulation of transcription from RNA polymerase II promoter, positive regulation of gene expression, etc. (Figure 3C).
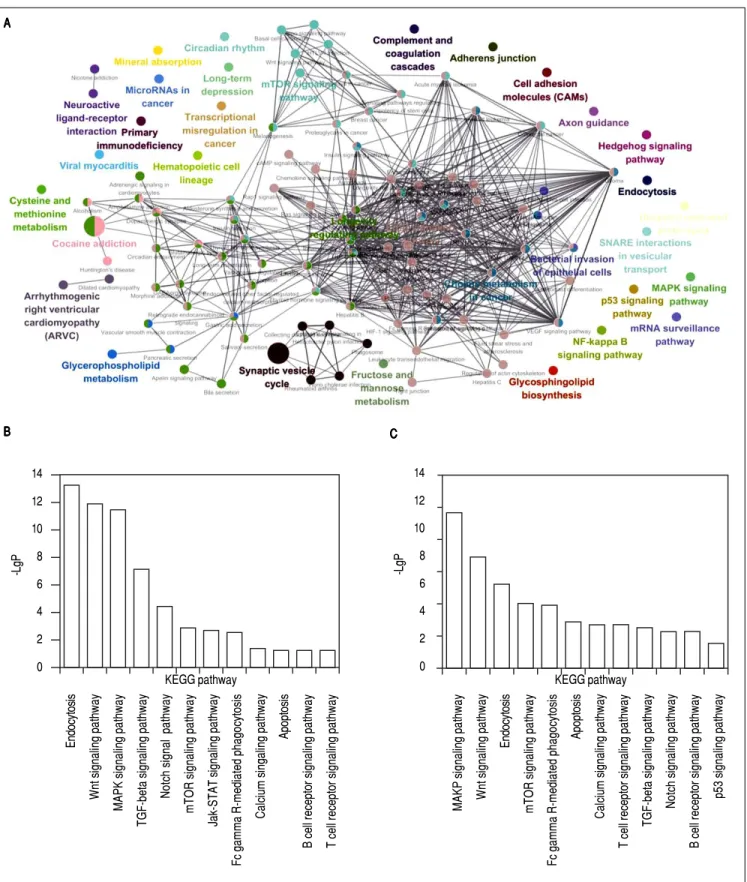
KEGG pathway analyses showed that the target genes of up-regulated and down-regulated miRNAs were implicat-ed in 60 and 65 pathways respectively. An integrative KEGG pathway analysis of these target genes were showed in figure 4A. The top 12 pathways involved in genes targeted by the down-regulated miRNAs are showed in figure 4B, while the top 12 pathways involved in genes targeted by the down-regulated miRNAs are presented in figure 4C.
Establishment of
miRNA-gene/gene-pathway networks
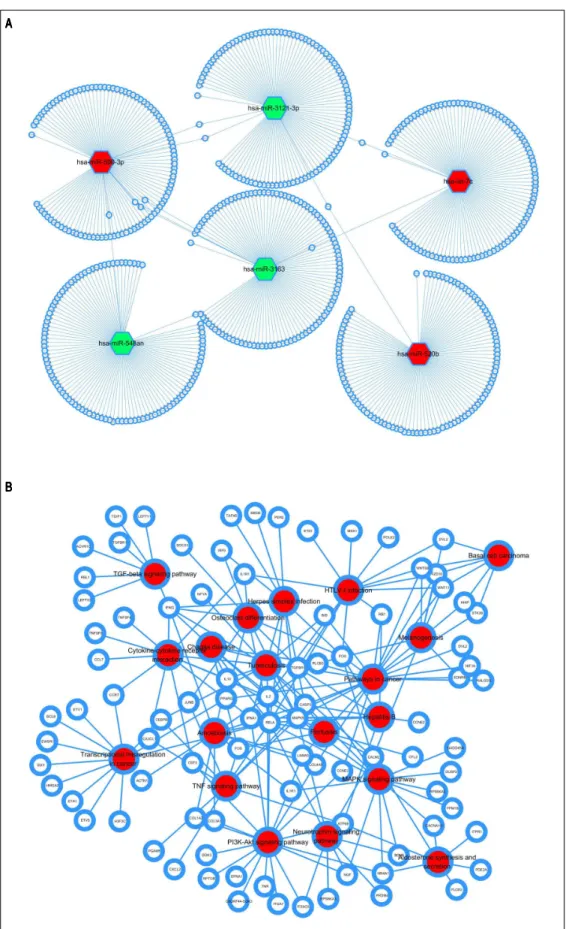
Based on target prediction, the network between the top 100 targets of the top 3 up-and down-regulated miRNAs was visualize in figure 5A. Pathway enrichment Table1. Clinical characteristics of the study subjects.
Clinical parametersHC (n = 32)CHB (n = 28)ACLF (n = 6)
Gender(m/f) 17/15 21/7 3/3
Age (yr) 33.9 ± 11.4 36.1 ± 9.5 48.3 ± 12.4
ALT(IU/L) 22.8 ± 6.0 41.5 ± 5.5 41.7 ± 11.3
AST(IU/L) 20.5 ± 4.6 50.5 ± 21.0 93.7 ± 16.0
ALB(IU/L) 44.6 ± 3.2 42.2 ± 12.2 35.8 ± 3.8
TB(ìmol/L) 7.8 ± 2.2 12.6 ± 4.3 331.2 ± 70.0
HBV-DNA(log10 IU/mL)NA5.5±1.94.2± 1.1 Figure 2.
Figure 2.Figure 2.
Figure 2.Figure 2. qRT-PCR analysis of the relative expression levels of eight microRNAs as indicated. p < 0.05 was considered statistically significant. NC: healthy donor. CHB: chronic hepatitis B. ACLF: HBV-related acute-on-chronic liver failure.
NC CHB ACLF 1.0
0.8 0.6 0.4 0.2 0.0
Relative mIR-548an level
p < 0.001 p < 0.001
p = 0.2953
NC CHB ACLF 1.0
0.8 0.6 0.4 0.2 0.0
Relative mIR-548i level
p < 0.001 p < 0.008
p = 0.4321
NC CHB ACLF 1.0
0.8 0.6 0.4 0.2 0.0
Relative mIR-4462b level
p < 0.001 p < 0.001
p = 0.4219
NC CHB ACLF 1.0
0.8 0.6 0.4 0.2 0.0
Relative mIR-4735-3p level
p < 0.001 p < 0.001
p = 0.6298
NC CHB ACLF 1.5
1.0
0.5
0.0
Relative mIR-550a-3bp level
p < 0.001 p < 0.001
p = 0.1159
NC CHB ACLF 2.5
2.0 1.5 1.0 0.5 0.0
Relative mIR-944 level
p < 0.001 p < 0.001
p = 0.7058
NC CHB ACLF 4.0
3.0
2.0
1.0
0.0
Relative mIR-1471 level
p < 0.001 p < 0.001
p = 0.2135
NC CHB ACLF 2.5
2.0 1.5 1.0 0.5 0.0
Relative mIR-4821 level
p < 0.001 p < 0.001
Figure 3. Figure 3. Figure 3. Figure 3.
Figure 3. GO analysis for predicted target genes. A.A.A.A.A. An integrative GO term analysis of the target genes, each node represents a GO term, each color rep-resents a functional group, terms are connected based on shared genes, the node size reprep-resents the term enrichment significance. B.B.B.B.B. The top 10 GO terms of genes targeted by the down-regulated miRNAs. C.C.C.C.C. The top 10 GO terms of genes targeted by the up-regulated miRNAs.
-Lg P 40 30 20 10 0 m r e t O G m r e t O G -Lg P 40 30 20 10 0 AAAAA
BBBBB CCCCC
Figure 4. Figure 4.Figure 4.
Figure 4.Figure 4. KEGG pathway analysis for predicted target genes. A.A.A.A. An integrative KEGG pathway analysis of the target genes, each node represents a KEGGA. pathway, each color represents a functional group, pathways are connected based on shared genes, the node size represents the pathway enrichment signifi-cance. B.B.B.B.B. The top 12 pathways targeted by the down-regulated miRNAs. C.C.C.C.C. The top 12 pathways targeted by the up-regulated miRNAs.
-Lg
P
14
12
10
8
6
4
2
0
Endocytosi
s
Wnt
s
igna
ling
pathwa
y
MAPK
signaling
pathwa
y
TGF-beta
signaling
pathwa
y
Notch
s
igna
l
pathwa
y
mTOR
signaling
pathwa
y
Jak-STAT
signaling
pathwa
y
Fc
gamma
R-mediated
phagocytosi
s
Calcium
singaling
pathwa
y
Apoptosi
s
B
cell
receptor
signaling
pathwa
y
T
ce
ll receptor
s
igna
ling
pathwa
y
MAKP
signaling
pathwa
y
Wnt
s
igna
ling
pathwa
y
Endocytosi
s
mTOR
signaling
pathwa
y
Fc
gamma
R-mediated
phagocytosi
s
Apoptosi
s
Calcium
signaling
pathwa
y
T
ce
ll receptor
s
igna
ling
pathwa
y
TGF-beta
signaling
pathwa
y
Notch
signaling
pathwa
y
B
cell
receptor
signaling
pathwa
y
p53
s
igna
ling
pathwa
y
y a w h t a p G G E K y
a w h t a p G G E K
-Lg
P
14
12
10
8
6
4
2
0 AAAAA
Figure 5. Figure 5. Figure 5. Figure 5.
Figure 5. Network of miRNA-gene/gene-pathway. A.A.A.A. miRNA-A. target gene network. B.B.B.B.B. Target gene-pathway network. White circle node with blue border represents target genes. Oxygen nodes represent miRNAs (green node indicate down-regulated, red node indicate up-regulated) and oval nodes represent mRNAs. Red node represents target genes involved pathways.
AAAAA
analysis of the target genes using DAVID database was dis-played in figure 5B. According to analysis, CCNE2, FOS, CASP3, IFNA1, RELA, TGFBR1, ATF6B, MAPK9 and RB1 were implicated in hepatitis B.
DISCUSSION
An increasing number of studies have revealed the roles of miRNAs in virus infection, including HBV infection. The interaction between host immune response and viral replication determines the clinical outcome of HBV infec-tion. Given that PBMC is an integral part of immune sys-tem, we investigated the miRNA expression profile in PBMCs to explore the potential role of miRNA in the pathogenesis of CHB.
In the current study, we analyzed the miRNA expres-sion profiles in PBMCs of normal volunteers and patients with CHB/ACLF. Among thousands of aberrant expressed miRNAs, 45 up-regulated and 62 down-regulated miR-NAs were found with fold expression change ≥ 1.5 in pa-tients with CHB/ACHBLF compared with healthy donors. The results suggested that these miRNAs may be related to the immune response of host and progression of HBV infection.
Significance test of target genes by Gene Ontology re-vealed that gene expression, transcription, metabolic proc-ess and biosynthetic procproc-ess are primary biological processes regulated by differentially expressed miRNAs; KEGG annotation demonstrated that these miRNAs main-ly target pathways like MAPK signaling pathway, Endocy-tosis, Wnt signaling pathway, TGF-beta signaling pathway, Nocth signaling pathway and mTOR signaling pathway, etc. These signaling pathways have been implicated in the pathogenesis or the development of CHB. For example, it has been proven that HBV, through X protein, can utilize MAPK signaling pathway to deregulate cell cycle and pro-mote cell survival, even hepatocarcinogenesis.16-18
Be-sides, it has also been reported that HBV surface antigen can selectively inhibits IL-12 production in monocytes/ macrophages by interfering the JNK-MAPK signaling pathway and thus evades immunity and lead to HBV per-sistence.19 In immortalized human primary hepatocytes,
clathrin-dependent endocytosis has been identified as a way of HBV entry.20 Wnt signaling plays critical roles in
diverse human biology, including embryogenesis, organo-genesis, and maintaining tissue homeostasis.21 In liver, it
regulates various cellular processes, including prolifera-tion, differentiaprolifera-tion, survival and others.21
By pathway analysis, CCNE2, FOS, CASP3, IFNA1, RELA, TGFBR1, ATF6B, MAPK9 and RB1 are involved in hepatitis B. FOS, CASP3, IFNA1, RELA, TGFBR1, MAPK9 and RB1 have been reported play roles in HBV infection or CHB progression.22-28 However, the function
of CCNE2 and ATF6B in HBV infection remains poorly understood. CCNE2 encodes cyclin E2, which plays a role in cell cycle G1/S transition and has been implicated in mouse hepatocyte proliferation.29 ATF6B is a
transcrip-tion factor in the unfolded protein response during endo-plasmic reticulum stress.30,31 Study has revealed that ATF6
beta is a host cellular target of the Toxoplasma gondii viru-lence factor.32
In summary, we identified that 107 miRNAs were dif-ferentially expressed in PBMCs from patients with CHB/ ACLF. Bioinformatics analysis revealed that the target genes of these miRNAs were implicated in multiple bio-logical processes and signaling pathways, especially gene expression regulation. The current study provides alterna-tive insights into the pathogenesis of HBV-related liver disease, and the potential mechanisms deserve further val-idation.
ABBREVIATIONS
• ACLF: acute-on-chronic liver failure. • CHB: chronic hepatitis B.
• DAVID: The Database for Annotation, Visualization and Integrated Discovery.
• GO: gene ontology. • HBV: hepatitis B virus. • IFN: interferon.
• KEGG: Kyoto Encyclopedia of Genes and Genomes. • miRNA: microRNA.
• PBMC: peripheral blood mononuclear cell.
GRANTS SUPPORT
Natural Science Foundation of China (No.81101240, 81371821, 81770565).
CONFLICTS OF INTEREST
There were no financial disclosures from any authors.
REFERENCES
1.European Association for the Study of the L. EASL 2017 Clinical Practice Guidelines on the management of hepatitis B virus infection. J Hepatol 2017; 67: 370-98.
2.Serigado JM, Izzy M, Kalia H. Novel therapies and potential therapeutic targets in the management of chronic hepatitis B.
Eur J Gastroenterol Hepatol 2017; 29: 987-93.
3.Selbach M, Schwanhausser B, Thierfelder N, Fang Z, Khanin R, Rajewsky N. Widespread changes in protein synthesis in-duced by microRNAs. Nature 2008; 455: 58-63.
4.Bartel DP. MicroRNAs: target recognition and regulatory functions.Cell 2009; 136: 215-33.
5.Ambros V. The functions of animal microRNAs. Nature
6.Murakami Y, Yasuda T, Saigo K, Urashima T, Toyoda H, Okanoue T, Shimotohno K. Comprehensive analysis of mi-croRNA expression patterns in hepatocellular carcinoma and non-tumorous tissues. Oncogene 2006; 25: 2537-45. 7.Kloosterman WP, Plasterk RH. The diverse functions of
mi-croRNAs in animal development and disease. Dev Cell 2006; 11: 441-50.
8.Lu J, Getz G, Miska EA, Alvarez-Saavedra E, Lamb J, Peck D, Sweet-Cordero A, et al. MicroRNA expression profiles classify human cancers. Nature 2005; 435: 834-8.
9.Zhou J, Yu L, Gao X, Hu J, Wang J, Dai Z, Wang JF, et al. Plasma microRNA panel to diagnose hepatitis B virus-related hepatocellular carcinoma. J Clin Oncol 2011; 29: 4781-8. 10.Borel F, Konstantinova P, Jansen PL. Diagnostic and
thera-peutic potential of miRNA signatures in patients with hepato-cellular carcinoma. J Hepatol 2012; 56: 1371-83.
11.Yan X, Zhu Z, Xu S, Yang LN, Liao XH, Zheng M, Yang D, et al. MicroRNA-140-5p inhibits hepatocellular carcinoma by di-rectly targeting the unique isomerase Pin1 to block multiple cancer-driving pathways. Sci Rep 2017; 7: 45915.
12.Ji F, Yang B, Peng X, Ding H, You H, Tien P. Circulating mi-croRNAs in hepatitis B virus-infected patients. J Viral Hepat
2011; 18: e242-51.
13.Tang Y, Luo X, Cui H, Ni X, Yuan M, Guo Y, Huang X, et al. MicroRNA-146A contributes to abnormal activation of the type I interferon pathway in human lupus by targeting the key signaling proteins. Arthritis Rheum 2009; 60: 1065-75. 14.Li N, Li Q, Qian Z, Zhang Y, Chen M, Shi G. Impaired TLR3/
IFN-beta signaling in monocyte-derived dendritic cells from patients with acute-on-chronic hepatitis B liver failure: rele-vance to the severity of liver damage. Biochem Biophys Res Commun 2009; 390: 630-5.
15.Bindea G, Mlecnik B, Hackl H, Charoentong P, Tosolini M, Kir-ilovsky A, Fridman WH, et al. ClueGO: a Cytoscape plug-in to decipher functionally grouped gene ontology and pathway annotation networks. Bioinformatics 2009; 25: 1091-3. 16Panteva M, Korkaya H, Jameel S. Hepatitis viruses and the
MAPK pathway: is this a survival strategy? Virus Res 2003; 92: 131-40.
17Chin R, Earnest-Silveira L, Koeberlein B, Franz S, Zentgraf H, Dong X, Gowans E, et al. Modulation of MAPK pathways and cell cycle by replicating hepatitis B virus: factors con-tributing to hepatocarcinogenesis. J Hepatol 2007; 47: 325-37.
18.Han M, Yan W, Guo W, Xi D, Zhou Y, Li W, Gao S, et al. Hep-atitis B virus-induced hFGL2 transcription is dependent on c-Ets-2 and MAPK signal pathway. J Biol Chem 2008; 283: 32715-29.
19.Wang S, Chen Z, Hu C, Qian F, Cheng Y, Wu M, Shi B, et al. Hepatitis B virus surface antigen selectively inhibits TLR2 ligand-induced IL-12 production in monocytes/macrophag-es by interfering with JNK activation. J Immunol 2013; 190: 5142-51.
20.Huang HC, Chen CC, Chang WC, Tao MH, Huang C. Entry of hepatitis B virus into immortalized human primary
hepato-cytes by clathrin-dependent endocytosis. J Virol 2012; 86: 9443-53.
21.Thompson MD, Monga SP. WNT/beta-catenin signaling in liv-er health and disease. Hepatology 2007; 45: 1298-305. 22.Edamoto Y, Hara A, Biernat W, Terracciano L, Cathomas G,
Riehle HM, Matsuda M, et al. Alterations of RB1, p53 and Wnt pathways in hepatocellular carcinomas associated with hepatitis C, hepatitis B and alcoholic liver cirrhosis. Int J Cancer 2003; 106: 334-41.
23.Han MS, Barrett T, Brehm MA, Davis RJ. Inflammation Mediat-ed by JNK in Myeloid Cells Promotes the Development of Hepatitis and Hepatocellular Carcinoma. Cell Rep 2016; 15: 19-26.
24.Yuan F, Zhou W, Zou C, Zhang Z, Hu H, Dai Z, Zhang Y. Ex-pression of Oct4 in HCC and modulation to wnt/beta-catenin and TGF-beta signal pathways. Mol Cell Biochem 2010; 343: 155-62.
25.Xia L, Tian D, Huang W, Zhu H, Wang J, Zhang Y, Hu H, et al. Upregulation of IL-23 expression in patients with chronic hepatitis B is mediated by the HBx/ERK/NF-kappaB pathway.
J Immunol 2012; 188: 753-64.
26.Yu K, Li Q, Cheng Q, Huang C, Zheng J, Chen S, Ling Q, et al. MicroRNA-548j inhibits type I interferon production by tar-geting ZBTB11 in patients with chronic hepatitis B. Biochem Biophys Res Commun 2017; 488: 628-33.
27.Gottlob K, Fulco M, Levrero M, Graessmann A. The hepatitis B virus HBx protein inhibits caspase 3 activity. J Biol Chem
1998; 273: 33347-53.
28.Kekule AS, Lauer U, Weiss L, Luber B, Hofschneider PH. Hepatitis B virus transactivator HBx uses a tumour promoter signalling pathway. Nature 1993; 361: 742-5.
29.Zhou J, Ju WQ, Yuan XP, Zhu XF, Wang DP, He XS. miR-26a regulates mouse hepatocyte proliferation via directly target-ing the 3’ untranslated region of CCND2 and CCNE2. Hepato-biliary Pancreat Dis Int 2016; 15: 65-72.
30.Thuerauf DJ, Morrison L, Glembotski CC. Opposing roles for ATF6alpha and ATF6beta in endoplasmic reticulum stress response gene induction. J Biol Chem 2004; 279: 21078-84. 31.Thuerauf DJ, Marcinko M, Belmont PJ, Glembotski CC.
Ef-fects of the isoform-specific characteristics of ATF6 alpha and ATF6 beta on endoplasmic reticulum stress response gene expression and cell viability. J Biol Chem 2007; 282: 22865-78.
32. Yamamoto M, Ma JS, Mueller C, Kamiyama N, Saiga H, Kubo E, Kimura T, et al. ATF6beta is a host cellular target of the Toxoplasma gondii virulence factor ROP18. J Exp Med 2011; 208: 1533-46.
Correspondence and reprint request: Ning Li, M.D., Ph.D.
Department of Infectious Diseases, Huashan Hospital, Fudan University, 12 Middle Urumqi Road, Shanghai 200040, China.