P
www.permanyer.com ORIGINAL ARTICLE Rev Invest Clin. 2015;67:25-32
Retinal Thickness After
Focal Photocoagulation
For Diabetic Macular Edema
With and Without Temporal
Perifoveal Thickening
Virgilio Lima Gómez
1, Dulce Milagros Razo Blanco-Hernández
2*, Yatzul Zuhaila García Rubio
3and Paulina Anaid Sánchez Montoya
31Service of Ophthalmology; 2Research Division, Hospital Juárez de México, México D.F., Mexico; 3 Universidad Justo Sierra, México D.F., Mexico
Corresponding author:
*Dulce Milagros Razo Blanco-Hernández Research Division
Hospital Juárez de México
Av. IPN 5160 Col. Magdalena de las Salinas Delegación Gustavo A. Madero
C.P. 07760, México, D.F.
E-mail: [email protected] Received for publication: 13-12-2013 Accepted for publication: 09-10-2014
ABSTRACT
Background: Visual improvement after focal photocoagulation in diabetic macular edema is more common in eyes without
temporal perifoveal thickening. This feature is related to a lower macular volume before treatment; the higher proportion of visual improvement could be associated with a shorter need of volume reduction. Objective: To compare macular volume before
and after focal photocoagulation in eyes with diabetic macular edema, with and without temporal perifoveal thickening. Methods:
Non-experimental, retrospective, longitudinal, comparative study in diabetics with macular edema treated with focal photocoagu-lation. Macular volume measured with optical coherence tomography, and best corrected visual acuity were compared between eyes with (group 1) and without temporal perifoveal thickening (group 2, independent samples Student’s t test). The comparison was also performed after stratifying the groups by baseline visual acuity. Results: One hundred and twenty eyes, 65 eyes from
group 1 (54.2%) and 55 from group 2 (45.8%). Mean volume before and after treatment and mean absolute and percentage changes were lower in group 2 (p < 0.001) regardless of visual acuity. Macular volume decreased significantly in eyes of group 1; only eyes in group 2 with visual acuity < 0.5 before treatment increased their visual function (p < 0.001). Conclusions: Eyes
without temporal perifoveal thickening had visual improvement, although their volume did not change statistically. The significant volume reduction in eyes with temporal perifoveal thickening was not associated to visual improvement. The anatomical change was not enough to explain the functional improvement. (REV INVEST CLIN. 2015;67:25-32)
Corresponding author: Dulce Milagros Razo Blanco-Hernández, [email protected]
Key words: Diabetic macular edema. Diabetic retinopathy. Macular volume. Perifoveal temporal sector.
No part of this publication may be reproduced or photocopying without the prior written permission
of the publisher
.
INTRODUCTION
Diabetic retinopathy is the most common microvas-cular complication1, in which hyperglycemia causes
structural and functional changes that damage the retinal capillaries2. Proliferative retinopathy and
clini-cally significant macular edema are vision-threatening types of diabetic retinopathy3.
Clinically significant macular edema (CSME) is the lead-ing cause of visual impairment in patients who have any degree of diabetic retinopathy. It affects up to 7.1% of the diabetic Latino population, predominant-ly of Mexican descent, in the United States4. In
Mex-ico, the largest study reported a prevalence of 5.8% among diabetic patients5.
Clinically significant macular edema is characterized by a thickening of the macula, which disjoin the pho-toreceptors and may lead to loss of three lines of vision6. Thickening is due to vascular leakage, which
may stem from a localized lesion in the capillaries (focal edema) or from abnormally permeable capillar-ies adjacent to an area of occluded capillarcapillar-ies (diffuse edema). Retinal fluorescein angiography is used to determine the origin and the extent of the leakage7.
The standard treatment for CSME with focal leakage is photocoagulation, which is applied to the thickened areas, where vascular leaks occur, in order to stabilize visual acuity6. Recent studies have shown that a high
percentage of patients have experienced improvement in functional vision following the procedure8,9.
Optical coherence tomography (OCT) is an imaging tool used to quantify retinal thickness. Its 6 mm fast macular thickness map scan uses six radial lines that pass through the center of the macula to measure retinal thickness at 768 points and determine center point thickness (CPT, in microns) and macular volume (in mm3). The map divides the macula into nine fields:
one at the center measuring 1 mm in diameter and four within each of two concentric circles with diam-eters of 3 and 6 mm10.
One of the features associated with visual improvement after photocoagulation is the absence of thickening in the temporal perifoveal region of the macula before treatment11. It has been reported that macular volume
before photocoagulation is lower in eyes without any
thickening in the temporal perifovea than in eyes with thickening12. The higher rate of visual improvement
in eyes without thickening in the temporal perifoveal region may be because they require less reduction in volume. This feature may improve prognosis, but it has not been evaluated.
A study was conducted to compare changes in macular volume after focal photocoagulation in patients with and without thickening in the temporal perifoveal region of the macula before initiation of treatment.
MATERIAL AND METHODS
An observational, comparative, retrospective, longitudi-nal open study was conducted in type 2 diabetes patients with CSME from Mexico City and its metropolitan area. The sample was made up of patients treated at the Hos-pital Juárez in Mexico between January 1, 2005 and Oc-tober 31, 2012. The study was approved by the Research and Research Ethics Committees of the hospital where it was conducted; all patients authorized their participa-tion in the study by signing the informed consent form.
Patients of both genders with ages between 40 and 80 years who were enrolled had type 2 diabetes, some degree of diabetic retinopathy, and focal CSME treated with photocoagulation. Patients underwent fast macu-lar thickness map scans and visual acuity (VA) measure-ment on the day of treatmeasure-ment and three weeks later.
Eyes with opaque media that limited VA (cataract, pre-retinal hemorrhage), thickened posterior vitreous cortex, ischemia on fluorescein angiography, condi-tions in which vision is reduced after treatment (sub-retinal neovascularization, (sub-retinal detachment, optic neuritis, vascular occlusions), errors in the fast macu-lar thickness map measurements or insufficient infor-mation in the medical history were excluded.
Clinically significant macular edema was diagnosed by a single investigator, on the basis of criteria defined by the Early Treatment Diabetic Retinopathy Study (ETDRS): (i) thickening of the retina at or within 500
µm of the center of the macula, (ii) hard exudates at
or within 500 µm of the center of the macula, if
as-sociated with thickening of the adjacent retina, and (iii) a zone or zones of retinal thickening 1 disc area or larger, any part of which is within 1 disc diameter
No part of this publication may be reproduced or photocopying without the prior written permission
of the publisher
.
of the center of the macula6. In accordance with
ET-DRS guidelines, a single investigator performed focal photocoagulation.
Fast macular mapping was performed after mydriasis by a single investigator on a Stratus OCT device (Version 4.01, Carl Zeiss Meditec, Inc., Dublin, CA, USA) using the following procedure: evaluation of spherical equivalent, identification of the retinal area with an acoustic signal, Z-offset and polarization were optimized and a strategy for dark eye was used tracking used. All maps were made using the flash setting between 9:00 and 11:00 a.m. in order to reduce variability due to time-of-day effects13. To confirm that they were properly centered,
it was ensured that the thinnest area was within the central circle and that the center thickness standard de-viation to center thickness ratio was less than 10%14.
Any deviations from the OCT scan line with respect to the actual boundaries of the retina14 and a signal
strength < 4 were considered to be measurement errors.
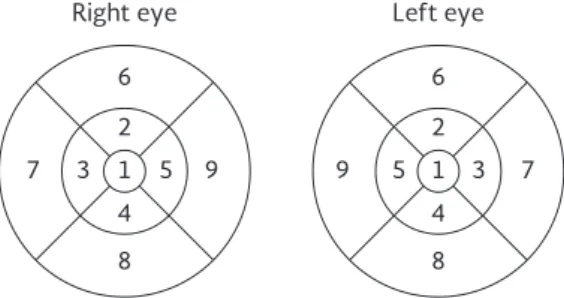
The sample was divided into two groups: Group 1, eyes with thickening in the temporal perifovea before photocoagulation and Group 2, eyes without. Thick-ening in the temporal perifovea was defined as retinal thickness in field 7 of the fast macular thickness map (Fig. 1) that exceeded the mean thickness in eyes without retinopathy (259.4 µm) for that quadrant by
more than two standard deviations15.
The variables studied were changes in macular volume and VA after photocoagulation. The former was de-fined as the difference in volume before and after three weeks of treatment measured in terms of mm3
(absolute change), as a percentage of baseline volume (percent change) and as a percentage of the potential change expected after the procedure. Potential change
was defined as the difference between pre-treatment volume and the mean volume in diabetics without reti-nopathy in the reference population16 (6.29 mm3)15.
Change in VA was defined as the arithmetic difference in refraction and best corrected VA measurements made before and after photocoagulation, in decimal notation; a positive value was considered to be an indicator of visual improvement. The CPT was con-sidered as a secondary variable.
Student’s t test for independent samples was used to compare mean macular volume before and after treat-ment, potential mean, absolute and percent changes, mean percentage of potential change, and mean change in VA between the groups. Student’s paired t-test was used to compare mean macular volume and mean VA before and after treatment in each group.
A second evaluation was made after the groups were stratified according to baseline VA (< 0.5 [< 20/40] or ≥ 0.5 [≥ 20/40]). Changes in the macular volume of eyes with and without visual improvement were compared (Student’s t test for independent samples) and the correlation between absolute changes in macular volume and VA was determined. P < 0.05 was considered significant; the data were captured and analyzed using Minitab® v16 software.
RESULTS
A total of 120 eyes from 89 patients were evaluated. Their ages ranged from 41 to 83 years (mean 59.5 years; standard deviation [SD] ± 8.9); 68 patients (56.7%) were female. Duration of diabetes ranged from one to 35 years, (mean 16.6 years; SD ± 7.0); 63 eyes belonged to patients with systemic arterial hypertension (52.5%).
Pre-treatment VA ranged from 0.02 to 1.00 (mean 0.52, SD ±0.27); in 57 eyes VA was < 0.5 (47.5%). The grade of diabetic retinopathy was non-prolifera-tive mild in 12 eyes (10%), non-proliferanon-prolifera-tive moderate in 65 (54.2%), non-proliferative severe in 11 (9.2%); proliferative in 32 (26.6%). In 65 eyes (54.2%) the type of edema present was focal.
Prior to treatment, the mean CPT was 181.4 ± 35.9 µm
and mean macular volume was 7.82 ± 0.58 mm3. Figure 1. Location of fields 7 on fast macular thickness map
(temporal perifoveal region).
Right eye Left eye
5 9 1 3
4 2 6
8
7 9 5 3
4 2 6
8 7 1
No part of this publication may be reproduced or photocopying without the prior written permission
of the publisher
.
After treatment, mean CPT was 184.1 ± 40.9 µm
(p = 0.2), mean macular volume was 7.70 ± 0.52 mm3
(p < 0.001) and VA was 0.54 ± 0.28 (p = 0.2).
Thickness in field 7 ranged from 214 to 416 µm (mean
274.1; SD ± 40.8); 65 eyes (54.2%) were assigned to group 1 and 55 (45.8%) were assigned to group 2.
Forty-nine eyes showed improvement in vision (40.8%; 95% CI: 32.0-49.6). This proportion did not differ significantly between group 1 (35.4%) and group 2 (47.3%; p = 0.1).
No significant difference was found in the means of the potential, absolute, and percentage changes in volume between eyes with and those without visual improvement (Table 1).
In eyes with VA < 0.5 before the procedure, the mean change in this variable (0.09 ± 0.17; p > 0.05) was higher than in the eyes with better vision (–0.04; SD ± 0.18; p = 0.0001).
Group 1
Thirty-four eyes presented with VA < 0.5 (52.3%); 23 eyes (35.4%) had proliferative diabetic retinopathy. Prior to treatment, mean VA was 0.49 ± 0.25, mean CPT was 193.3 ± 37.9 µm, and mean macular volume
was 8.17 ± 0.47 mm3. Mean potential change in the
macular volume was 1.28 ± 0.47 mm3.
After treatment, mean VA was 0.49 ± 0.27 (p = 0.9), mean CPT was 193.7 ± 45.6 µm (p = 0.9), and mean macular volume was 7.95 ± 0.45 mm3 (p < 0.001).
The mean absolute change in volume was –0.22 ± 0.36 mm3, mean percentage change in volume was
–2.6 ± 4.3%, and mean percentage of potential change was –15.2 ± 28.2%.
Group 2
Twenty-three eyes presented with VA < 0.5 (41.8%); nine eyes (16.4%) had proliferative diabetic retinopa-thy. Prior to treatment, mean VA was 0.456 ± 0.28, mean CPT was 167.4 ± 27.8 µm, and mean macular
volume was 7.43 ± 0.42 mm3. Mean potential change
in the macular volume was 0.53 ± 0.42 mm3.
After treatment, mean VA was 0.61 ± 0.28 (p = 0.1), mean CPT was 172.6 ± 31.5 µm (p = 0.6), and mean
macular volume was 7.41 ± 0.44 mm3 (p = 0.6). The
mean absolute change in volume was –0.014 ± 0.23 mm3, mean percentage change in volume was –0.16
± 3.12%, and mean percentage of potential change was –2.9 ± 134.6%.
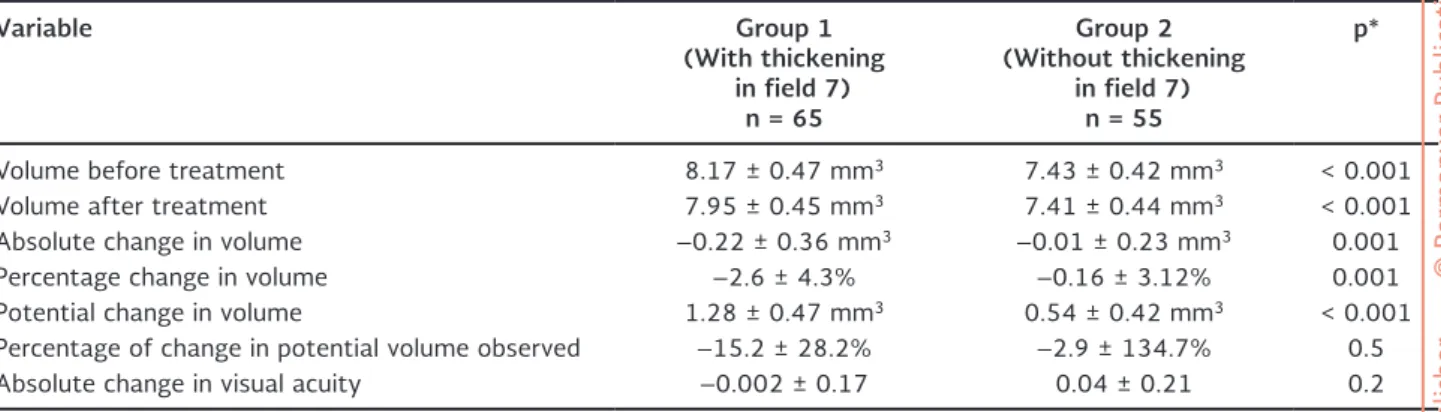
Mean volumes before and after treatment, as well as the means of the potential, absolute, and percentage changes, were significantly greater in group 1 than in those of group 2. The percentage of potential change was greater in group 1, but the difference was not significant (Table 2).
Among eyes with VA < 0.5 (< 20/40) before photo-coagulation (n = 57), 18 in group 2 showed visual im-provement (n = 23, 78.3%) as did 15 in group 1 (n = 34, 44.1%; p = 0.01; relative risk: 1.77; 95% CI: 1.15-2.74). Among eyes with VA ≥ 0.5 (≥ 20/40) before photoco-agulation (n = 65), eight eyes in group 1 (n = 31, 25.8%) and eight in group 2 (n = 32, 25.0%) showed visual improvement (p = 0.5).
As the groups were stratified on the basis of VA prior to treatment, a significant decrease in macular volume was found in the eyes in group 1, but not in those in group 2 (Fig. 2). In group 2, only eyes with VA < 0.5 (< 20/40) before treatment showed significant visual improvement while the rest showed no significant
Table 1. Comparison of changes in macular volume between eyes with and eyes without visual improvement
Variable Eyes with visual
improvement n = 49
Eyes without visual improvement
n = 71
p*
Absolute change (mm3) –0.18 ± 0.34 –0.09 ± 0.32 0.1
Percentage change (%) –2.14 ± 4.16 –1.07 ± 3.86 0.1 Potential change (mm3) 0.98 ± 0.54 0.91 ± 0.61 0.4
*Student’s t test for independent samples.
No part of this publication may be reproduced or photocopying without the prior written permission
of the publisher
.
Table 2. Comparison of visual acuity and macular volume, and changes in them between the groups
Variable Group 1
(With thickening in field 7)
n = 65
Group 2 (Without thickening
in field 7) n = 55
p*
Volume before treatment 8.17 ± 0.47 mm3 7.43 ± 0.42 mm3 < 0.001
Volume after treatment 7.95 ± 0.45 mm3 7.41 ± 0.44 mm3 < 0.001
Absolute change in volume –0.22 ± 0.36 mm3 –0.01 ± 0.23 mm3 0.001
Percentage change in volume –2.6 ± 4.3% –0.16 ± 3.12% 0.001 Potential change in volume 1.28 ± 0.47 mm3 0.54 ± 0.42 mm3 < 0.001
Percentage of change in potential volume observed –15.2 ± 28.2% –2.9 ± 134.7% 0.5 Absolute change in visual acuity –0.002 ± 0.17 0.04 ± 0.21 0.2
*Student’s t test for independent samples.
Figure 2. Change in macular volume by group. Stratification according to visual acuity prior to treatment.
Cubic millimeters
8.60
8.40
8.20
8.00
7.80
7.60
7.40
7.20
7.00
1 < 0.5 after 1 < 0.5
before 1 ≥ 0.5before 1 ≥ 0.5after 2 < 0.5before 2 < 0.5after 2 ≥ 0.5before 2 ≥ 0.5after
Group, best corrected visual acuity before treatment
Upper CL Mean Lower CL
change (Fig. 3). Eyes in group 2 with VA < 0.5 (< 20/40) showed a significant increase in CPT (Table 3).
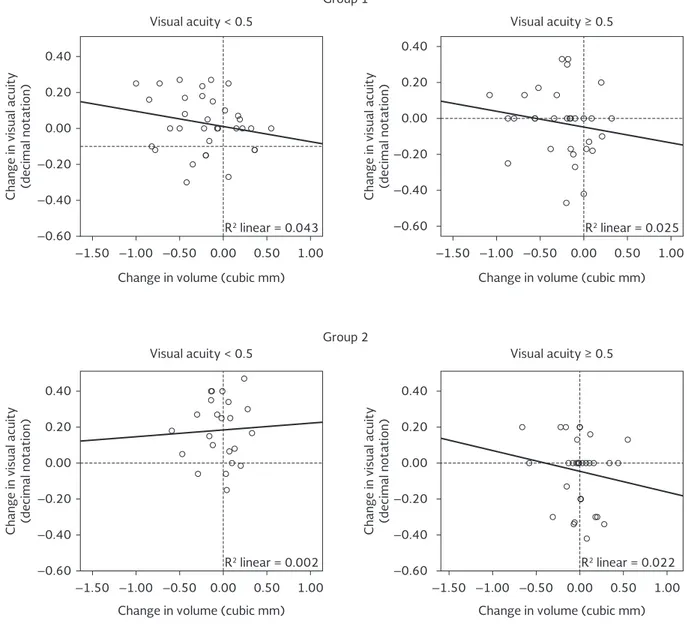
The correlation between change in volume and change in VA was low in every group (Fig. 4, Table 4).
DISCUSSION
The decrease in macular volume following photoco-agulation was lower in eyes without thickening in the temporal perifovea than in those with thickening. The percentage of potential change in volume that was attained and the mean change in VA did not vary between the groups.
Razo Blanco-Hernández, et al. reported that macular volume was greater in eyes with thickening in the temporal perifovea12, and the lower rate of
improve-ment in vision in them may be because they require a greater reduction in volume in order to attain nor-mal retinal thickness. As the probability of an im-provement in vision is greater in eyes with VA < 0.5 (< 20/40) has already been documented6, the sample
was stratified in order to minimize the impact of this factor on the response to treatment.
The mean change in volume did not vary between eyes that showed visual improvement and eyes that did not. Changes in volume did not vary as the groups were stratified on the basis of VA: it was decreased
No part of this publication may be reproduced or photocopying without the prior written permission
of the publisher
.
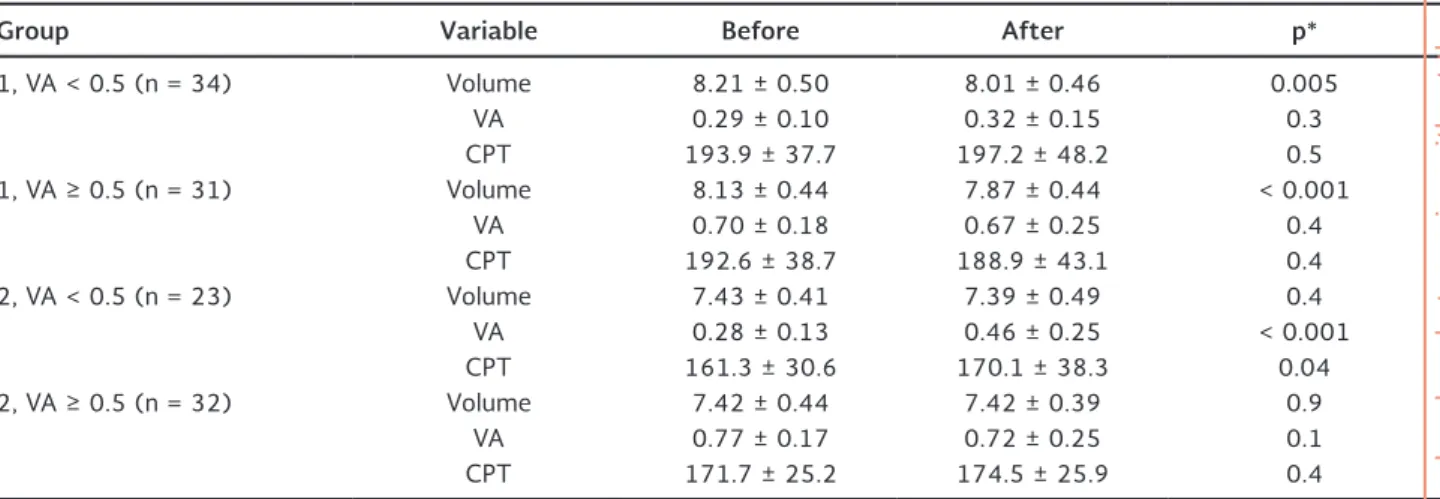
Table 3. Comparison of macular volume, best corrected visual acuity, and center point thickness prior to and after treatment; groups were stratified according to baseline visual acuity
Group Variable Before After p*
1, VA < 0.5 (n = 34) Volume 8.21 ± 0.50 8.01 ± 0.46 0.005 VA 0.29 ± 0.10 0.32 ± 0.15 0.3 CPT 193.9 ± 37.7 197.2 ± 48.2 0.5 1, VA ≥ 0.5 (n = 31) Volume 8.13 ± 0.44 7.87 ± 0.44 < 0.001
VA 0.70 ± 0.18 0.67 ± 0.25 0.4 CPT 192.6 ± 38.7 188.9 ± 43.1 0.4 2, VA < 0.5 (n = 23) Volume 7.43 ± 0.41 7.39 ± 0.49 0.4
VA 0.28 ± 0.13 0.46 ± 0.25 < 0.001 CPT 161.3 ± 30.6 170.1 ± 38.3 0.04 2, VA ≥ 0.5 (n = 32) Volume 7.42 ± 0.44 7.42 ± 0.39 0.9
VA 0.77 ± 0.17 0.72 ± 0.25 0.1 CPT 171.7 ± 25.2 174.5 ± 25.9 0.4
*Student’s paired t test.
VA: visual acuity; CPT: center point thickness.
Figure 3. Change in visual acuity by group. Stratification according to visual acuity prior to treatment.
De
ci
m
al
no
ta
ti
on
0.90
0.70 0.80
0.60
0.50
0.40
0.30
0.20
0.10
0.00
1 < 0.5 after 1 < 0.5
before 1 ≥ 0.5before 1 ≥ 0.5after 2 < 0.5before 2 < 0.5after 2 ≥ 0.5before 2 ≥ 0.5after
Group, best corrected visual acuity at baseline
Upper CL Mean Lower CL
significantly in group 1, but not did not change in group 2. Stratification showed an increase in mean VA when it was < 0.5 (< 20/40) before treatment, which was only significant in eyes in group 2.
Studies in CSME have evaluated the correlation between change in CPT and change in VA, which DRCR.net has used to report “paradoxical” responses after photo-coagulation, such as an increase in VA in eyes with an increase in CPT and vice versa17. Center point
thickness is the area that allows the highest resolution,
but it has been determined that macular volume shows lower interobserver variability, which makes its measurement more reproducible18. It also been
reported that change in macular volume is more use-ful to assess thickening that does not involve the center, such as the temporal perifovea this study has evaluated.
The correlation between change in macular volume and change in VA was low in both groups and their subgroups. In group 1, this outcome did not mean
No part of this publication may be reproduced or photocopying without the prior written permission
of the publisher
.
Table 4. Correlation between changes in macular volume and best corrected visual acuity by group, with stratification of baseline visual acuity
Group Pearson p r2
1, < 0.5 (n = 34) –0.21 0.23 0.043 1, ≥ 0.5 (n = 31) –0.16 0.39 0.025 2, < 0.5 (n = 23) 0.05 0.82 0.002 2, ≥ 0.5 (n = 32) –0.15 0.42 0.022
Group 1
Visual acuity ≥ 0.5 Visual acuity < 0.5
Visual acuity ≥ 0.5 Visual acuity < 0.5
Group 2
Change in volume (cubic mm) Change in volume (cubic mm)
Change in volume (cubic mm) Change in volume (cubic mm)
R2 linear = 0.025
R2 linear = 0.043
R2 linear = 0.002 R2 linear = 0.022
Change in visual acuity (decimal notation) Change in visual acuity (decimal notation)
Change in visual acuity (decimal notation) Change in visual acuity (decimal notation)
–1.50 –1.00 –0.50 0.00 0.50 1.00 –1.50 –1.00 –0.50 0.00 0.50 1.00
–1.50 –1.00 –0.50 0.00 0.50 1.00
–1.50 –1.00 1.00
0.40
–0.40
–0.60 0.20
–0.20 0.00
0.40
–0.40
–0.60 0.20
–0.20 0.00 0.40
–0.40
–0.60 0.20
–0.20 0.00
0.40
–0.40
–0.60 0.20
–0.20 0.00
–0.50 0.00 0.50
Figure 4. Scatter plots of changes in macular volume and visual acuity stratified according to visual acuity at baseline.
In group 2, CPT and VA increased significantly and macular volume did not change. It is striking that in neither group did the mean percentage change of macular volume reach 3%, a difference that Krzystolik, et al. attributed to real changes and not to variability in the measurements21. The difference in reduction in
macular volume between the groups was not enough to explain the change in VA, especially in eyes with VA ≥ 0.5 (≥ 20/20) before photocoagulation.
In a study on diffuse macular edema, Vemala, et al. identified the superior and nasal parafovea and temporal perifovea as the retinal regions with the least reduction in retinal thickness after photocoagulation19. Although
treatment failure since the mean reduction in volume (–0.22 ± 0.36 mm3) was not far from the median
values of eyes with adequate response to photoco-agulation (0.13 mm3) reported by Browning20.
No part of this publication may be reproduced or photocopying without the prior written permission
of the publisher
.
in this study eyes with focal edema were treated, the response to treatment was lower when there was thick-ening in the temporal perifoveal region, even after stratifying by VA before treatment.
The lower response to treatment in eyes with thicken-ing in the temporal perifoveal may indicate retinal neuronal dysfunction in addition to the misalignment of photoreceptors that reduces the resolution in eyes with CSME. Two capillary plexuses converge in that region and thickening may be indicative of a more severe microvascular disease, even in the absence of capillary closure on fluorescein angiography.
Hudson, et al. observed reduced capillary blood flow in the temporal region of the macula in patients with dia-betic macular edema, which was associated with areas of angiographic leakage22. Furthermore, research using
electroretinography has found that electrical activity in the nasal area of the macula is lower than in the tempo-ral region. Although it was suggested that the nasal area is more vulnerable, in eyes where there is thickening only in that region, it may indicate that there is residual function of the temporal sector, which is significantly greater23. The increased electrical activity may be
as-sociated with visual improvement in eyes without thick-ening in the temporal perifovea, which this study found in eyes with VA < 0.5 (< 20/40) before treatment.
Anatomical changes alone were not sufficient to explain the amount of visual improvement in the two groups, so it would be necessary to measure the sen-sitivity or electrical activity of the macula (through perimetry or electroretinography testing) in order to identify whether the absence of thickening in the tem-poral perifovea is indicative of a better functional status that may be associated with a better response to pho-tocoagulation in eyes with diabetic macular edema.
REFERENCES
1. Kollias AN, Ulbig MW. Diabetic retinopathy: Early diagnosis and effective treatment. Dtsch Arztebl Int. 2010;107:75-83. 2. Josifova T, Schneider U, Henrich PB, Schrader W. Eye disorders
in diabetes: potential drug targets. Infect Disord Drug Targets. 2008;8:70-5.
3. Yau JW, Rogers SL, Kawasaki R, et al. Global prevalence and major risk factors of diabetic retinopathy. Diabetes Care. 2012; 35:556-64.
4. Varma R, Choudhury F, Klein R, Chung J, Torres M, Azen SP. Four-year incidence and progression of diabetic retinopathy and macular edema: the Los Angeles Latino Eye Study. Am J Oph-thalmol. 2010;149:752-61.
5. Asociación Mexicana de Retina, Sociedad Mexicana de Oftal-mología, Asociación Panamericana de Oftalmología. Resultados del día Panamericano de detección de retinopatía diabética (3 de julio de 1999, día “D”). Rev Mex Oftalmol. 2005;79:88-92. 6. American Academy of Ophthalmology Retinal Panel. Preferred
Practice Patterns Guidelines. Diabetic retinopathy. San Francisco, CA: American Academy of Ophthalmology; 2008 (4th printing 2012).
7. Danis RP, Scott IU, Qin H, et al. Association of fluorescein an-giographic features with visual acuity and with optical coher-ence tomographic and stereoscopic color fundus photographic features of diabetic macular edema in a randomized clinical trial. Retina. 2010;30:1627-37.
8. Shrestha A, Khadka D, Karmacharya A, et al. Is laser photoco-agulation still effective in diabetic macular edema? Assessment with optical coherence tomography in Nepal. Int J Ophtalmol. 2012;5:217-21.
9. Zaidi ZA, Jacob MK. Effect of macular photocoagulation on vi-sual acuity of Omani patients with clinically significant macular edema. Oman J Ophthalmol. 2009;2:62-6.
10. Polito A, Del Borrello M, Isola M, Zemella N, Bandello F. Repeat-ability and reproducibility of fast macular thickness mapping with Stratus optical coherence tomography. Arch Ophthalmol. 2005;123:1330-7.
11. Lima-Gómez V, Razo Blanco-Hernández DM. Características aso-ciadas con la mejoría visual después de la fotocoagulación en edema macular diabético. Cir Cir. 2012;80:311-9.
12. Razo Blanco-Hernández DM, Romero-Vargas DM, Bermúdez-Zapata DA, Lima-Gómez V. Modificación del volumen macular por engrosamiento del área temporal, en edema macular diabé-tico focal. Rev Hosp Jua Mex. 2011;78:146-51.
13. Polito A, Del Borrello M, Polini G, Furlan F, Isola M, Bandello F. Diurnal variation in clinically significant diabetic macular edema measured by the Stratus OCT. Retina. 2006;26:14-20. 14. Sadda SR, Wu Z, Walsh AC, et al. Errors in retinal thickness
measurements obtained by optical coherence tomography. Oph-thalmology. 2006;113:285-93.
15. Lima-Gómez V, Osornio-Castro NA. Comparación del grosor retiniano en diabéticos sin retinopatía, con y sin fondo coroideo. Rev Mex Oftalmol. 2006;80:301-5.
16. Browning DJ, Glassman AR, Aiello LP, et al. Optical coherence tomography measurements and analysis methods in optical co-herence tomography studies of diabetic macular edema. Oph-thalmology. 2008;115:1366-71.
17. Browning DJ, Glassman AR, Aiello LP, et al. Relationship between optical coherence tomography-measured central retinal thick-ness and visual acuity in diabetic macular edema. Ophthalmol-ogy. 2007;114:525-36.
18. Browning DJ. Interobserver variability in optical coherence to-mography for macular edema. Am J Ophthalmol. 2004;137: 1116-17.
19. Vemala R, Koshy S, Sivaprasad S. Qualitative and quantitative OCT response of diffuse diabetic macular oedema to macular laser photocoagulation. Eye. 2011;25:901-8.
20. Browning DJ. Interpreting thickness changes in the diabetic macula: the problem of short-term variation in optical coher-ence tomography–measured macular thickening (an american ophthalmological society thesis). Trans Am Ophthalmol Soc. 2010;108:62-76.
21. Krzystolik MG, Strauber SF, Aiello LP, Beck RW, Berger BB, Bressler NM. Reproducibility of macular thickness and volume using Zeiss optical coherence tomography in patients with diabetic macular edema. Ophthalmology. 2007;114:1520-5.
22. Hudson C, Flanagan JG, Turner GS, Chen HC, Rawji MH, McLeod D. Exaggerated relative nasal-temporal asymmetry of macular capillary blood flow in patients with clinically significant dia-betic macular oedema. Br J Ophthalmol. 2005;89:142-6. 23. Holm K, Lövestam AM. In diabetic eyes, multifocal ERG reflects
differences in function between the nasal part and the temporal part of the macula. Graefes Arch Clin Exp Ophthalmol. 2012; 250:1143-8.
No part of this publication may be reproduced or photocopying without the prior written permission
of the publisher
.