An integrated improvement framework for sharing
assessment lessons learned
Diego M. Rubio, Natalia Andriano, Álvaro Ruiz de Mendarozqueta, Carlos Bartó {diego.rubio, natalia.andriano, aruizdemendarozqueta}@motorola.com
Grupo de Investigación en Ingeniería y Calidad de Software Departamento de Ing. en Sistemas de Información
Universidad Tecnológica Nacional Maestro M. López esq. Cruz Roja Argentina (X5016ZAA) Ciudad Universitaria, Córdoba, Argentina.
Abstract. Nowadays, an increasing number of companies are using process improvement models as a mean to improve the quality of their processes and therefore the quality of their products and services. Although various improvement frameworks exist that provide organizations with aids in their respective process improvement programs, there is a lack of synergy between organizations using similar frameworks. In this paper we propose an improvement framework that uses the University as an independent collector to integrate the results of improvement efforts and provide analyzed information and resulting artifacts to relevant stakeholders. Since many organizations are currently using multiple models for process improvement, the framework proposed was designed to support multi model information. It also provides an expanded set of data by incorporating the results from all process improvement assessments regardless of the assessment method used. In particular, informal assessments which are usually not included on analyses, proved to be a useful way of obtaining information related to the learning experience that companies undergo in their process improvement journey
Initial results of its usage are presented, including the analysis of 40 assessments. Finally, common errors and risk-prone areas are highlighted and the products and services being developed on those key areas are presented (e.g. e-learning material, implementation guidelines, etc)
Key words. Process improvement, SW-CMM, CMMI, assessments, IDEAL.
1.
Introduction
Nowadays, an increasing number of companies are using process improvement models as a mean to improve the quality of their processes and therefore the quality of their products and services (1). With this purpose, many process improvement frameworks have been proposed and are widely used in the software industry that supports such models implementation. In particular, the SEI (2) has published the IDEAL model (3) as the infrastructure to guide organizations in planning and implementing an effective model based software process improvement program. Although these improvement frameworks provide organizations with aids in their respective process improvement program, there is a lack of synergy between organizations using the same (or similar) improvement frameworks.
In today´s context, where the information sharing mechanisms have bridged the gap and enabled leveraging experiences across organizations in many aspects(4)(5), there is a need to provide a framework not only to help organizations in their own process improvement programs but to enable sharing between organizational experiences. This framework will serve to the purpose of helping software industry and universities to leverage experiences and ultimately improve the overall state of the art.
In this paper an improvement framework is proposed to address such needs. The framework was developed with the following objectives:
To provide the basis that will enable companies and universities to learn based on other (and self) experiences.
To expand over industry wide available information by the integration and analysis of results from process improvement assessments and audits regardless of the reference model and the assessment method used.
In order to present the above mentioned information this paper is organized as follows:
Section 2 introduces the proposed framework.
Section 3 analyses the main components of the proposed framework in detail.
Section 4 presents the methods and tools used in the initial implementation done in UTN-FRC (6).
Section 5 describes the initial implementation results. Section 6 presents the conclusions of the work done. Section 7 describes the current and future work related to the framework and the research group working on it.
2.
Proposed process improvement framework overview
The CMMI ® model (7), ISO9001:2000 (8) among other commonly used quality models and standards have proven effective to help Software organizations in improving their business results (9)(10). When using these quality models, there is a critical step to process improvement that every organization has to take, namely the audit, appraisal and/or assessment1. In this
step, the organization has a comprehensive evaluation of the implementation of the reference model and a clear feedback from external experts including strengths and weaknesses of their implementation (11). In particular, the IDEAL framework for process improvement has explicitly mentioned this step where such evaluations are made and results are used for continuous improvement.
In this context where organizations invest significant amount of resources (12)(13) to improve their performance based on a clear understanding of their current weaknesses and strengths, it is particularly critical to provide a framework where organizations can also reuse the knowledge generated by others to avoid and mitigate redundant errors to occur.
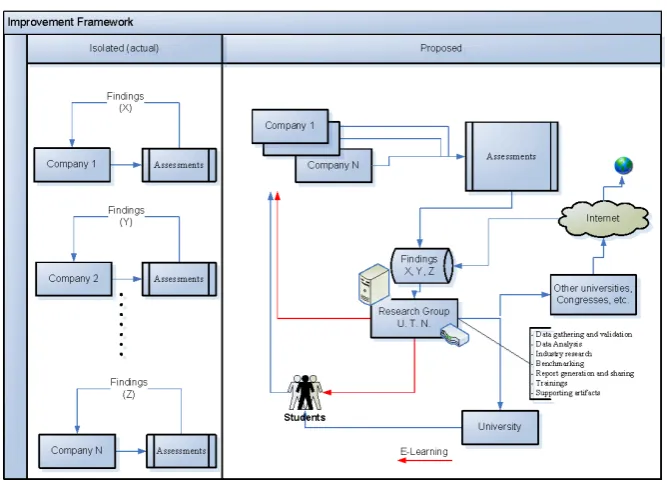
As depicted in the left-hand side of Figure 1, traditional approaches to process improvement have isolated the learning experience within organizations without taking full advantage of the common mistakes and implementation gaps.
[image:2.595.125.459.442.682.2]
Figure 1: Side by side improvement framework comparison.
An alternative approach is presented on the right-hand side of figure 1 which enables organizations, based on “learn by doing” methodologies (14), to leverage from other organizations experience as well as to benchmark its current practices against industrial available data.
In particular, the proposed approach uses the University as the independent organization that, acting as an improvement hub, consolidates, validates and analyzes the available industry data in order to generate corresponding trainings and implementation material to ensure best practices are shared across organizations and common errors are addressed.
Also, the improvement framework suggests the usage of external data (i.e. industrial best practices and research information) to crosscheck available state-of-the-art implementations to ensure best practices and known problem resolutions are built into the proposed trainings and solutions given to the organizations and University.
3.
Process improvement framework components
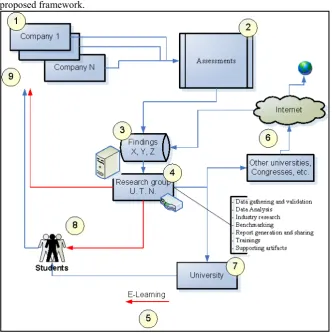
[image:3.595.142.475.276.610.2]As depicted in the following picture, there are 9 major components in the proposed framework.
Figure 2: Major framework components 3.1. Companies/industry:
3.2. Assessments
As the key common step where models or standards implementation is assessed by a knowledgeable team, this component provides the basis to the finding-based work to be done in the following steps. During this step, information is gathered in terms of findings encountered by the assessment teams to be later consolidated into the proposed database. Although this framework is intended to be used to leverage model based improvement initiatives, there is no limitation on the reference model and/or standard as long as the assessment itself provides the organization with a set of findings related to that reference model. It should be noted that, although the assessment is highly demanding in terms of resources for the assessed organization (11), this framework builds upon the results provided by these activities and does not add any extra requirement to the organization.
3.3. Findings database
In order to store all the information gathered during the assessments, a database was designed to enable the research group to perform all needed statistical analyses and reports.
In this initial version of the database, it was decided to map all collected information to the CMMI (15) reference model regardless of the one used for assessment purposes. Detail description of how the models mapping was made is presented in section 4 of this paper.
General assessment and demographic data was collected and stored (e.g. organization size, organization location, roles involved, etc) as well as detailed result information (e.g. findings, improvement opportunities, strengths, observations, recommendations, impacted area, etc).
Finally, it should be noted the database structure is planned to be changed to incorporate other reference models/standards in future implementations.
3.4. Research group at the University
As mentioned before, this framework uses the University as an independent organization that, acting as an improvement hub, consolidates, validates and analyzes the available industry data. The current framework implementation is based on a research group within the University that shall have (or develop) the needed skills to perform the required analyses with the data provided by organizations (e.g. model mapping, quantitative statistical analyzes, qualitative categorization, etc).
The main role of the University within this framework, is to provide an objective environment were data can be anonymously analyzed and feedback can be provided to organizations and students. Also, a cost effective environment is provided since the University benefits from the analyses of the provided data by the acquisition of new knowledge that can be later incorporated into its engineering curricula.
Among the activities that need to be developed by such a group are: - Data gathering and validation
- Data Analysis - Industry research
- Benchmarking (both internal and against industry available data) - Report generation and sharing
- Trainings (creation and delivery)
- Supporting artifacts (creation and delivery)
3.5. E-Learning
selected to design e-learning modules based on the findings and analyses performed in previous steps.
3.6. Additional sources of information
In order to perform some of the above mentioned activities, there is a need to have access to best-in-class practices and updated information on the state of the art in relevant areas of knowledge.
As a consequence, a highly important component of this framework is the linkage with those other sources of information. In particular, other universities programs (e.g. Carnegie Mellon University), recent symposiums and congresses, and international organizations (e.g. IEEE (17), ISO (18)) should be permanently screened in search for updates relevant to the work to be done by the group.
Also, as a result of the work developed by the group it is important to make relevant results available to those sources in order to leverage the overall knowledge on the selected areas and encourage the active sharing of relevant information.
3.7. University and Students
The output generated by the aforementioned steps would provide the University (reference number 7 in Figure 2) with updated information in order to improve the curricula and training material of related subjects. It will also enable University staff (including teachers and interns) to directly benefit by being involved in the analyses done and the creation of the related material. Finally, the availability of e-learning options will expand training alternatives to those students seeking for deeper knowledge in some of the areas of experience (reference number 8 in Figure 2).
4.
Methods and tools
4.1. Variables operational definition
The assessments included in this paper were performed between 2003 and 2007. Therefore, the raw data is based on two models SW-CMM 1.1(19) and CMMI v1.1 (15). For analysis purposes all SW-CMM results were converted and normalized into CMMI naming conventions and equivalent process areas. In order to be consistent with this normalization we took as a main guide the SEI published mapping between those references models (20). Once the information was converted, it was thoroughly analyzed in order to correctly match the related practice, goal and PA for each finding.
Assessments were categorized according to their nature. For this purpose 3 categories were used: SCAMPI (11), CBA IPI (21) and informal (i.e. all assessments not using one of the before mentioned methods were included in this category, including internal and external assessments done by organizations but not reported as formal assessments).
Based on the information provided by each assessment record, a risk assessment was performed in order to include a risk number for each goal within each assessment2 using the below mentioned categories:
High risk - 9: meaning that it is unlikely to reach the requirements of the goal with the evidence provided if the assessment were a formal one (e.g. Class A SCAMPI)
Medium - 3: meaning that the information provided was not conclusive and, in consequence, the assessment team criteria would have influence on the final rating
Low - 1: meaning that is likely to fulfill the intended requirements. All results gathered – findings, strengths, improvements opportunities, risks associated to specific PAs, observations and recommendations – were entered into the database described in section 3.3.
The result set was coded using two types of variables:
Quantitative: like number of finding per PA, number of strengths identified per PA and number of improvement opportunities per PA. Qualitative: like risks, assessment level (ordinal) and assessments reference model (nominal).
4.2. Methods
In order to consolidate the available data into the finding database, a manual transcription was done from the assessment records. After this activity was completed, data was validated in subsequent steps. First, a peer review session was done over a sample subset of assessments with the purpose of ensuring that there were no errors introduced by the data transcription process. Second, initial data validation was done, including but not limited to:
Correct type (i.e., numeric, alphanumeric) Correct format and scale
Within specified ranges and/or categories Complete (i.e. non missing values)
Lastly, descriptive statistics were generated for those quantitative variables stored in the database and graphical summaries were reviewed. Also, histograms and sector graphics were generated for quantitative variables.
In order to discriminate error-prone areas, a scatter plot chart was used, using
the average number of finding per assessment in the “y” scale and the average risk exposure on the “x” scale.
When comparisons were needed, the most applicable method was selected based on the underlying data distribution. In particular, the Mann-Whitney non parametric Test (22) was used to compare assessment types as presented in section 5 of this paper.
Finally, in order to generate the associated e-learning modules, the “learn by
doing” methodology proposed by Roger Shank was used (14). As a result, e-learning modules were implemented in a web based environment by the generation of a state machine using C#.net technology.
5.
Results
This section describes initial framework implementation results. Although this paper is not intended to present the entire set of results obtained by the application of the framework3, preliminary implementation results are presented
as well as initial discussion over other related works.
5.1 Assessments information
Up to date, 40 assessments were completed and incorporated into the database. Those assessments were distributed among 14 participating companies which sizes varied from 17 to 250 employees. In all cases, SW-CMM v1.1 or CMMI v.1.1 were the reference models used for assessments (refer to section 4 for a description of how findings related to those models were integrated).
As a result, 461 findings were recorded along with 530 strengths, 66 improvement opportunities, 54 observations and 186 recommendations.
Table 1 provides a summary of the above mentioned data together with some related information.
ASSESSMENTS
Number of assessments 40
CBA IPI 6
SCAMPI 9
Informal 25
Reference model SW-CMM: 21 CMMI: 19
Level 2: 17 3: 11 4: 2 5: 11
ORGANIZATIONS
Number of organizations 14
Minimum size 17
Maximum size 250
RESULTS
Findings 461
Top 3 PP: 74 CM:55 PPQA:52
Average by PA 20
Average per assessment 11.5
Strengths 530
Improvement opportunities 66
Observations 54
[image:7.595.156.459.68.326.2]Recommendations 186
Table 1: Data Summary
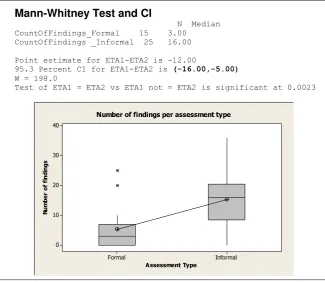
As described before, one of the objectives of the proposed approach was to expand over industry wide available information. This expansion was achieved by a two folded approach as can be derived from the data presented in Table 1. On one hand, the database includes information from assessments using diverse reference models (i.e. CMM and CMMI in the current version). On the other hand, both formal and informal assessments were included in the database. This was done under the assumption that informal assessments would provide useful information on the learning experience that companies undergo in their process improvement journey. As depicted in Figure 3, a comparison over the sample data was done that exposed a statistically significant difference between the number of findings reported in formal and informal assessments.
Mann-Whitney Test and CI
N Median CountOfFindings_Formal 15 3.00 CountOfFindings _Informal 25 16.00
Point estimate for ETA1-ETA2 is -12.00
95.3 Percent CI for ETA1-ETA2 is (-16.00,-5.00)
W = 198.0
Test of ETA1 = ETA2 vs ETA1 not = ETA2 is significant at 0.0023
Figure 3: Comparison of findings per assessment type
Informal Formal
40
30
20
10
0
Assessment Type
N
u
m
b
e
r
o
f
fi
n
d
in
g
s
[image:7.595.144.470.477.759.2]As shown, the number of findings reported during informal assessments is significantly greater than the number of findings reported in formal assessments. It should be noted that although other organizations like the SEI are maintaining assessments results databases and reports (1), the information provided by informal assessments is neither collected nor analyzed. As a consequence, the current framework provides an expanded set of data to fully leverage from all process improvement assessment.
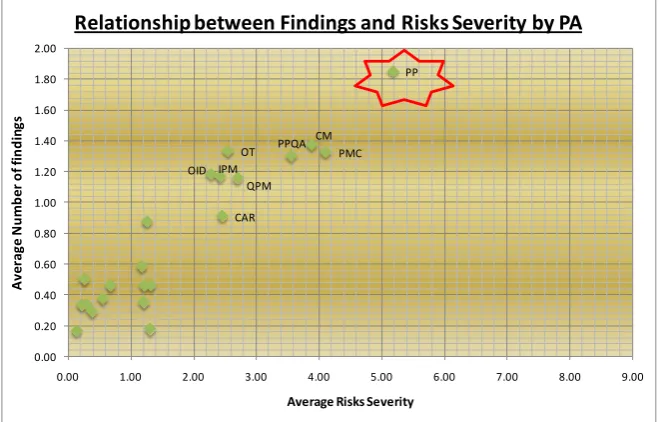
5.2 Error-prone areas analysis
[image:8.595.126.456.273.484.2]In order to select the core error-prone areas that would lead to the development of the training and implementation material, a comparative analysis was performed to assess the relationship between risks severity and the average number of findings per assessment. In Figure 4, it is depicted this analysis at a PA level. As shown, Project Planning (PP) was found to be the most critical process area, according to average number of findings per assessment and their associated risk severity.
Figure 4: Relationship between Findings and Risks Severity by PA
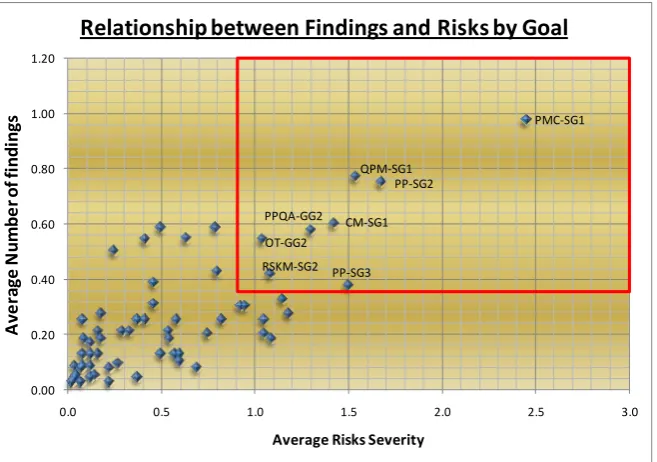
In order to drill down and to have a better understanding of which goals were the most difficult to implement, the same analysis was done but this time detailed at goal level. As depicted in Figure 5, at the upper-right side of the figure, the following goals were the ones with the greater average number of findings per assessment and the most significant risk towards achieving the intended goal:
Project Monitoring and Control (PMC)
o Specific Goal 1 (SG 1 – Monitor Project against Plan) Project Planning (PP)
o Specific Goal 2 (SG2 – Develop a Project Plan)
o Specific Goal 3 (SG3 – Obtain Commitment to the plan) Quantitative Project Management (QPM)
o Specific Goal 1 (SG1 – Quantitatively Manage the Project) Configuration Management:
o Specific Goal 1(SG1 – Establish Baseline), Process and Product Quality Assurance (PPQA)
o Generic Goal 2 – (GG2 - Institutionalize a Managed Process) Organizational Training (OT)
o Generic Goal 2 – (GG2 - Institutionalize a Managed Process) Risk Management
o Specific Goal 2 – (SP2 - Identify and Analyze Risks) CAR
CM
IPM OID
OT PMC
PP
PPQA
QPM
0.00 0.20 0.40 0.60 0.80 1.00 1.20 1.40 1.60 1.80 2.00
0.00 1.00 2.00 3.00 4.00 5.00 6.00 7.00 8.00 9.00
A
v
e
ra
g
e
N
u
mb
e
r
o
f
fi
n
d
in
g
s
Average Risks Severity
Figure 5: Relationship between Findings and Risks Severity by PA
In particular, although it was not the highest scored goal, PP-SG3 was selected to pilot the learning material and the associated assets. The main reason to select this goal was that it presented a well defined encapsulated topic and a clear scope in which to focus4. Also, in order to provide the contextual knowledge to the
University audience (i.e. those that, as opposed to companies implementing such reference models, did not have the basic knowledge), a CMMI introductory course was developed5.
6.
Conclusions
Nowadays, an increasing number of companies are using process improvement models as a means to improve the quality of their processes and therefore the quality of their products and services. When using these quality models, there is a critical step to process improvement that every organization has to take, namely assessment.
In this paper, a framework is presented that uses the university as an independent organization that will enable companies to leverage on the investment made on process improvement activities by increasingly share the knowledge acquired.
Since many organizations are currently using multiple models for process improvements (23)(24), the current framework is proposed to integrate the results obtained from those experiences. As well, the current proposal provides an expanded set of data by incorporating the results from all process improvement assessments regardless of the assessment method used.
Initial results of framework implementation are presented. 40 assessments have been submitted and analyzed up to date. Common error-prone areas have already been detected. Training and implementation material were developed to support the implementation of those areas industry wide and to increase the awareness of such practices among the intended audience (including both University and local companies). Although the actual impact of the products provided need to be statistically validated, initial results are encouraging. As a
4 Although practice level analyses are not presented in this paper, PP specific practice 3.3 which is contained within this specific goal was the highest scored practices.
5 Since this introductory course was also intended to be incorporated as a regular subject at the university, it was not developed as an e-learning solution but using the University training definitions.
CM-SG1 OT-GG2
PMC-SG1
PPQA-GG2
PP-SG2
PP-SG3 QPM-SG1
RSKM-SG2
0.00 0.20 0.40 0.60 0.80 1.00 1.20
0.0 0.5 1.0 1.5 2.0 2.5 3.0
A
ve
ra
ge
N
u
m
b
e
r
o
f
fi
n
d
in
gs
Average Risks Severity
consequence, on-going activities are been planned at the University to continue this work and to increase the experience from its use.
7.
Current and further work
Currently, work is being done in order to improve the analysis of the available data (i.e. deep dives into specific topics) and to generate a full technical report of relevant information in order to be benchmark with other sources of information (e.g. SEI). As part of this work, interviews with subject matter experts on specific areas were held to provide further qualitative data related to those critical areas.
As information related to other reference models/standards is been collected (e.g. ISO9001:2000) the database schema and mapping are been updated to support such information storage and analysis.
Also, e-learning modules are being generated to address the top error prone areas along with detailed implementation guidelines with common solutions to address such areas.
Finally, future work is suggested in order to perform similar analyses over the other components of the assessment results collected (i.e. strengths, improvement opportunities, etc).
8.
Acknowledgements
The work presented in this paper was developed as part of a research currently on-going within the Quality and Engineering research center at the “Universidad Tecnológica Nacional Córdoba”. As such, many people participate on the associated research other than the authors. In particular, we would like to acknowledge Juan Carlos Cuevas, Juan Pablo Bruno, Gonzalo García Favre, Claudio Gonzalez, María Paula Izaurralde, Luciano Marzo and Pablo Viola for their outstanding contributions to the current work.
9.
Bibliography
1. CMMI Appraisal Program. Software Engineering Institute (SEI). Process Maturity Profile CMMI® SCAMPISM Class A Appraisal Results 2007 Year-End Update. Pittsburgh, Pennsylvania, USA : Carnegie Mellon University,
Page 20. March 2008.
http://www.sei.cmu.edu/appraisal-program/profile/pdf/CMMI/2008MarCMMI.pdf.
2. Software Engineering Institute (SEI). [Online] Carnegie Mellon University, 2008. http://www.sei.cmu.edu/.
3. Jennifer Gremba and Chuch Myers. The Ideal(SM) Model: A practical Guide for process improvement. Pittsburgh, Pennsylvania, USA : Software Engineering Institute (SEI), Bridge, issue three, 1997.
4. Laycock, Martyn. Collaborating to compete: achieving effective knowledge sharing in organizations. The Learning Organization : Emerald Group Publishing Limited, 2005. DOI:10.1108/09696470510626739.
5. Miller, Jerry. The Internet's Impact On Business Relationships. Information Week. [Online] Sears, Roebuck and Co, September 17, 2001. http://www.informationweek.com/news/management/showArticle.jhtml?articleID =6506627.
6. Universidad Tecnológica Nacional-Facultad Regional Córdoba. [Online] http://www.frc.utn.edu.ar/.
7. CMMI Product Team. CMMI for Development, version 1.2. Pittsburgh, Pennsylvania, USA : Software Engineering Institute (SEI), August 2006. CMU/SEI-2006-TR-008.
9. Rico, David F. ROI of Software Process Improvement (Foreword by Roger S. Pressman). s.l. : J. Ross Publishing, Inc., January 2004. ISBN: 1-932159-24-X.
10. Software Tech News. Performance Outcomes from Process Improvement. s.l. : The Data and Analysis Center for Software (DACS), March 2007.
11. SCAMPI Upgrade Team. Standard CMMI® Appraisal Method for Process Improvement (SCAMPISM ) A, Version 1.2: Method Definition Document. Pittsburgh, Pennsylvania, USA : Software Engineering Institute, August 2006. HANDBOOK CMU/SEI-2006-HB-002.
12. Thomas McGibbon; Daniel Ferens; Robert L. Vienneau. A Business Case for Software Process Improvement (2007 Update). s.l. : Measuring Return on Investment from Software Engineering and Management, 2007. DACS Report Number 347616.
13. Curtis, W. Building a Cost-Benefit Case for Software Process Improvement. Boston, MA : Notes from Tutorial given at the Seventh Software Engineering Process Group Conference, May 1995.
14. Roger C. Schank. Designing World-Class E-Learning: How IBM, GE, Harvard Business School and Columbia University Are Succeding at e-Learning. s.l. : McGraw-Hill, 2002. ISBN:0-07-137772-7.
15. CMMI Product Team. Capability Maturity Model Integration Version 1.1 (CMMI-SE/SW/IPPD/SS, V1.1). Pittsburgh, Pennsylvania, USA : Software Engineering Institute (SEI), 2002.
16. Saul Carliner, Patti Shank. The E-Learning Handbook: A Comprehensive Guide to Online Learning (Hardcover). s.l. : Pfeiffer, April 2008. ISBN-10: 0787978310.
17. Institute of Electrical and Electronics Engineers, Inc. IEEE. [Online] IEEE, 2008. http://www.ieee.org/web/aboutus/home/index.html.
18. International Organization for Standardization. ISO. [Online] ISO, 2008. http://www.iso.org/iso/about.htm.
19. Mark Paulk et all. Capability Maturity Model for Software, Version 1.1. Pittsburgh, Pennsylvania, USA : Software Engineering Institute Carnegie Mellon University, February 1993. CMU/SEI-93-TR-24 ESC-TR-93-177.
20. Software Technology Support Center. Mappings of CMMI-SE/SW Version 1.1 and SW-CMM Version 1.1. s.l. : http://www.sei.cmu.edu/cmmi/adoption/pdf/stsc-mappings.pdf, January 2002.
21. Donna K. Dunaway; Steve Masters. CMM®-Based Appraisal for Internal Process Improvement (CBA IPI) Version 1.2 Method Description. Pittsburgh, USA : Software Engineering Process Management Program, SEI, November 2001. CMU/SEI-2001-TR-033, ESC-TR-2001-033.
22. Jacobson, James E. The Wilcoxon Two-Sample Statistic: Tables and Bibliography. s.l. : Journal of the American Statistical Association, Vol. 58, No. 304, pp. 1086-1103, Dec., 1963.
23. Jeannine M.Siviy; M. Lynn Penn; Robert Stoddard. Achieving Success via Multi-Model Process Improvement. Pittsburgh, Pennsylvania, USA : SEPG 2007. Carnegie Mellon University, 2007.