Universidad Nacional de La Plata
Universidad Torcuato Di Tella
Universidad de San Andres
Capítulo Argentino de la Red LACEA/BID/Banco Mundial sobre Desigualdad y
Pobreza
Universidad Nacional de La Plata
Facultad de Ciencias Económicas
La Plata, 26 y 27 de Junio de 2003
Household Behavior in the Presence of Economic Crisis: Evidence
from Argentina, 2002
Evidence from Argentina, 2002
Ariel Fiszbein
World Bank
Paula Giovagnoli
World Bank
Norman Thurston
Brigham Young University
March 2003
Abstract
At the end of 2001, Argentina suffered one of its worst economic crises in memory. When presented with lower
incomes, reduced employment, and other economic shocks, households have responded by adjusting their consumer
behavior and adopting a number of coping strategies. In this paper, we use evidence from a household survey
completed at the time of the Argentine crisis to examine whether the use of coping strategies is directly linked to the
1. Introduction
Argentina is currently in the midst of a deep and unparalleled economic, social, and political crisis. After three
years of continuing recession, the economic and financial crisis deepened during 2001. Various attempts were made
throughout 2001 to spur growth as a prelude to improved public finances and the debt profile but to no avail.
Market perceptions of risk of default increased, especially in mid-2001. Efforts to protect the banking system from
wide-spread withdrawal of deposits resulted in strangling of liquidity and economic activity and generated popular
discontent. This finally culminated in the resignation of then President de La Rua, a quick succession of appointed
presidents, a formal announcement of default on public sector borrowings, and in early 2002, the abandonment of
the Convertibility Plan.
In its fifth year of recession, the economy in 2002 declined by about 11 percent, bringing the decline in GDP to over
20 percent since its 1998 peak. With the peso depreciating sharply since its float and undefined monetary policy,
Argentina is experiencing significant inflation for the first time since 1991. Between the decline in economic
activity and the currency’s depreciation, per capita GDP declined sharply, to about US$2,850 in 2002 (down from
US$8,210 at its peak in 1998).
The social impact of the crisis has been devastating. During the first half of 2002, the share of populationconsidered
poor grew by roughly 15 percentage points while the number of extreme poor nearly doubled. Currently, more than
half of the population live below the poverty line, and close to one-fourth of the population is considered extremely
poor or indigent. Between October 2001 and May 2002, household incomes fell in nominal terms by an average of 8
percent, or roughly one-third in real terms. About half of all households experienced some reduction in nominal
incomes, a fact that applied to a substantial portion of the middle class. During the first half of 2002, unemployment
increased by 3 percentage points to 21 percent, and formal sector employment fell by an additional 5percentage
points. There was also a deterioration in the quality of jobs and an increased reliance on secondary wage earners.
Most new jobs were temporary and lacked standard benefits associated with formal sector employment.
This paper analyzes the various coping mechanisms and strategies adopted by Argentine families during these hard
times and extends a more detailed analysis of the welfare effects of the economic crisis included in Fiszbein et al.
2. Data
This paper uses data from survey1 covering 2,800 households. This is a survey collected in urban areas and small
localities with less than 2,000 habitants. It is nationally representative and was specially conducted to assess the
effects of the economic crisis on households’ welfare and identify the coping mechanisms and strategies adopted by
Argentine families during these hard times. The field work was done during the months of June and July of 2002.
The first part of the questionnaire asked for information on all household members and included questions on
demographic characteristics, employment, income, migration status, education level and health coverage. The
second part of the questionnaire focused on the household as a unit inquiring about the use of savings, changes in
consumption patterns, and participation in social programs and community activities. The questions were answered
by the head of household (or the best informed individual in the household).2
2.1 Household-specific identifying factors
We are interested in identifying factors that influence household decisions to engage in various coping strategies.
We focus on how two particular economic shocks – income loss and employment loss– can be linked to the
likelihood of households adopting particular coping strategies. We also examine how family type, household
structure, and household characteristics affect these decisions.
Household incomes. In the survey, monthly reported average income per-capita from all sources amounted to AR$214 or the equivalent of approximately US$60. The survey team also asked each individual whether its current
income had changed in nominal terms relative to October 2001. Almost 40% of the households reported a reduction
in nominal incomes, while about 8% of the households reported increases in incomes.
1
The survey was conducted by IBOPE.
2
If the head of household did not know the answer to a particular question (e.g. changes in consumption patterns)
Employment.While the survey suggests that the overall activity rate was roughly constant between October 2001
and the time of the survey, there were significant changes in labor market status for specific households. (For more
details see: Fiszbein et. al, 2002.) For the purposes of this study, we will use an indicator for whether a member of
the household became unemployed during the period in question. In the survey approximately 5.5% of households
suffered a loss of employment by at least one member.
Household Structure. In socioeconomic studies, it is widely accepted that certain behaviors differ based on
household structure. In our case, we use the typology proposed by Torrado (1998) for the case of Argentina. The
“two-parent nuclear household” represents 54% of the household within the survey. It is commonly believed that
the crisis has led many traditional households to incorporate other members, such as married children, parents of the
married couple, grandchildren, etc. as a means of taking advantage of economies of scale. Households with a head
of household and spouse present that have non-nuclear members are referred to as “two-parent non-nuclear”
households.3 In the survey 14% of households are of this type. Finally, single-parent households (where the head of
household has no spouse present) represent 8% . The remaining 24% of the households are non conjugal.
Family Characteristics. We are also interested in how the size of the household may affect economic behavior. We
follow the guidelines of the Instituto Nacional de Estadisticas y Censos de Argentina (INDEC)4 in establishing a
comparable index of family size. These guidelines suggest weighting family members by their age and gender to
create an “adult equivalent index.” Details of this construction are available upon request.
Additionally, we consider other characteristics of the household such as the number of children. The average
number of children for those households with children is 1.9. We also considered the age and the education levels of
the head of household, measured as the number of years of education completed.
3
For parsimony, in the text we refer to two-parent non-nuclear households as simply “non-nuclear households.”
4
Wealth. Following Filmer and Pritchett (1994) we created a wealth index based on 29 asset ownership
characteristics using factor analysis. For the empirical analysis we compare the behavior of households in the
lowest third of the wealth distribution with that of households in the highest third of the distribution. This way, we
are fairly confident that we are measuring differences between the “poorest” and the “wealthiest” households.
2.2 Coping Strategies
There is a growing empirical literature that examines household reactions to economic shocks in Latin America.
Recent papers include Neri and Thomas (2000) looking at employment shocks in Brazil; Cunningham and Maloney
(2000) looking at the case of Mexico and Gaviria (2001) studying seven Latin American countries, including
Colombia, Ecuador, Guatemala, Honduras, Nicaragua, Paraguay, and Venezuela. Unlike those papers which use
longitudinal data, we use cross-sectional, retrospective data for the same purpose.
The survey inquired about the strategies most frequently used by households in reaction to the worsening economic
conditions experienced over the previous eight months .5 In this section, we provide a general description of the
several types of strategies employed by households. We have grouped them into three categories: adaptive
household strategies,active household strategies, and social network strategies6.
Adaptive household strategies are those where households responded to the crisis by changing consumption patterns
including the use of various types of services. Active household strategies involve the incremental use of physical,
financial and human assets available to the household, including adding new workers, working more hours, selling
5
A more detailed description of each coping strategy is given in the appendix.
6
We present results on different coping strategies with the idea that each one is interesting in its own right.
Furthermore, we expect that since each behavior will have a different income elasticity, it is likely that aggregating
or combining groups will mask important differences in behaviors that may be of interest to particular readers. The
risk is that some of the less common strategies will not have statistically significant relationships, but the analysis
assets, using savings, borrowing, and migration. Social network strategies, include strategies that rely on assistance
from friends, family, NGOs or government.
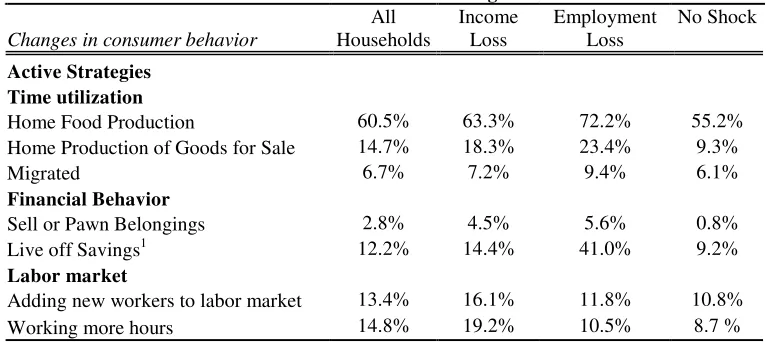
Adaptive household strategies. Table 1 summarizes the prevalence of adaptive household strategies in the survey.
The most striking feature of this table is that the overall economic crisis has affected the behavior of most
households, even those that did not experience one of the economic shocks studied here. Most families have reacted
to the economic crisis through a combination of consuming less and substituting for less expensive goods both for
essential and non-essential items. In each case, households affected directly by economic shocks are more likely to
participate in adaptive coping strategies. It is somewhat surprising that reduction of food consumption is reported
by such a large percentage of households, especially households with more children (see Table 1). However, the
data in this table reflects behavioral changes in the aggregate and do not parse out the income effect from the
substitution effect. We note that during the crisis, relative prices were changing, and food became relatively more
expensive.7 In the more detailed analyses that follows, we isolate the effect of income losses from the substitution
effect by looking specifically at whether income-related economic shocks are linked directly to these changes in
behavior.
Another interesting observation from this table is that 37% of households did not buy the medicines that they
needed. It is also noteworthy that households that were directly affected by the crisis show higher rates of reduced
access to medical care. (For more details see Uribe and Schwab, 2002.) A particularly troubling aspect of this
strategy is that households with three or more children were the most likely to have employed this strategy.
While these results are striking, there are probably many confounding factors. For example, household type is
almost certainly correlated with household income – households with more children are more likely to be low
income. In the more detailed analyses that follows, we use controls to isolate the effect of family structure from
income, wealth, and other variables.
7
The CPI increased by 30% during the first six months of the current year. The increase in the prices of food items
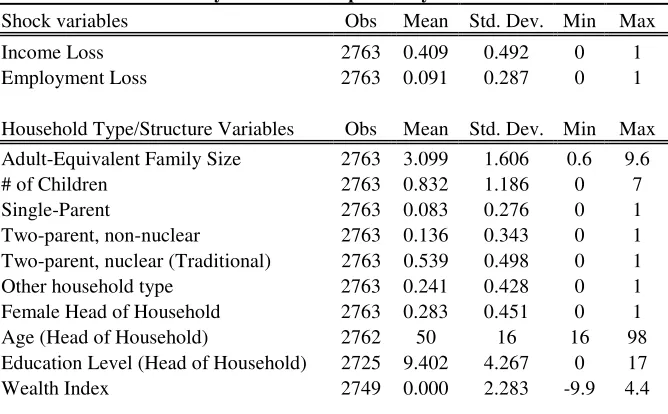
Active household strategies. Table 2 summarizes the prevalence of changes in active household strategies in the survey. The use of these strategiesin most cases is smaller than adaptive strategies. However, this may be
somewhat deceiving. Looking at the relative prevalence before and after suggests that there were significant
changes. For example, 2.8% of households report selling or pawning belongings at present, but only 0.6% report
participating in this activity as of October, 2001. (For more details see: Fiszbein et. al, 2002.) Hence, during the
economic crisis this behavior has become about four times as common. Similar patterns hold for other active
strategies.
Overall we see that households impacted by economic shocks are generally more likely to have employed active
strategies. Although most active strategies are not particularly common in the non-affected population (with the
exception of home food production), the extent of these changes is not entirely unexpected.
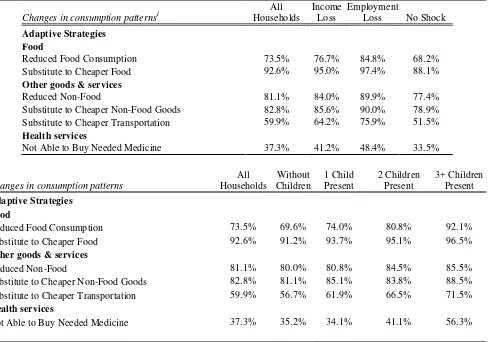
With respect to family structure, we also observe an interesting phenomenon. Both “home food production” and
“home production of goods for sale” have begun to be used more by larger households (more adult equivalent
members). See Figure 1.
While it is the case that many of the active strategies are not particularly common among the unaffected population,
the data shows some evidence that household-specific shocks are associated with higher utilization of active
strategies. In particular, employment loss results in a dramatic increase in all active strategies when compared to
households with no economic shocks. For example, among households that have savings, there is a dramatic
difference in living off savings between those that faced no economic shocks (9%) and those that had a loss in
employment (41%). The effects of other shocks are similar but less dramatic.
In the case of active strategies, it is almost certainly the case that household wealth will affect household behavior.
In particular, we note that for households in the lowest third of wealth, beginning to sell or pawn belongings is twice
three times as likely (33.7% vs. 11.1%). Certainly allowing behavior to vary by household wealth will be an
important consideration for active strategies.
Social network strategies. A third type of behavior under crisis that we will study is the prevalence of social
networking strategies. Table 3 summarizes the prevalence of changes in these strategies in the survey. As expected, a significant number of households have begun to rely on social networking as a means of consumption. As was the
case with adaptive and active strategies, households that have been affected directly by an economic shock are more
likely to have employed social network strategies as a method of coping with the economic crisis.
It is likely that the structure of the household will affect the propensity of families to begin to utilize social network
strategies. In table 3 we see that single parent households are more likely to have begun using social network
strategies than other household types, except communal activities which are more prevalent among non-nuclear
households.
3. The Econometric Model and Empirical Results
In this section of the paper, we estimate the effects of the economic crisis on household behavior in a variety of
settings. We analyze the effect of household-specific economic shocks on the probability of increased utilization of
the coping strategies described in the previous section. We also examine the relationship of these behaviors to
household type and wealth status.
3.1 The Econometric Model
Since all of the dependent variables of interest are binary in nature, the econometric model is a simple limited
dependent variables model, where the various measures of economic shock affect the probability that a given
household changes its consumer behavior in a particular way. There are many options for estimating the effect of X
In our case, the set of y variables examined includes all 17 of the coping strategies described in Section 2 and in the
Annex. X contains a detailed set of economic shock variables along with important household-level control
variables.
Ideally, one might wish to estimate a conditional logit model. However, this would require information on the
participation in every strategy pre- and post, and presupposes that there would be sufficient numbers of households
that had both increases and decreases in income. Given the data at hand this is not an option at present. Another
concern has to do with endogeneity. After reviewing the nature of the economic crisis, we are confident that the
explanatory variables of interest represent household reports of the impact of shocks stemming from the exogenous
economic crisis.
3.2 The empirical results
In this section we present results from the logit models estimated for each coping strategy. We emphasize that all of
the dependent variables are measured as changes in coping strategies, and not as levels of coping strategies. For
example, one of the social network strategies deals with the reliance on friends or family for support. In
constructing the measure of this variable, we use whether the household began to rely on friends or family for
support after the economic crisis. Thus the effect of the shocks is measured as a change in the probability that a
household changed its behavior.
We first estimated a logit regression for each of the seventeen coping strategies with independent variables including
household-specific economic shocks, household type and characteristics, and other controls. (Summary statistics for
the independent variables of interest are presented in Table 4.8) Then we re-estimated these equations with
interaction terms between wealth categories and the income and employment shock variables. In tables 5-6 we
8
The regressions also include controls for urban location, family income, and indicators for whether the family was
report results from the first set of regressions,9 and tables 7-9 show the results that emerge from the expanded
regressions. In each case, we report the estimated coefficients and odds-ratios from the logit estimations. The
marginal effects at the mean of the variable are also reported, as well as the mean of the dependent variables.
In order to make this presentation clear, we have divided the results into three subsections. First, we report our
findings on how household-specific economic shocks have affected coping strategy behavior. Second, we report
findings on whether changes in utilization of coping strategies are related to family type. In particular, we are
interested in how household characteristics, such as size, presence of children, family structure, female head of
household, and the education of the head of household can be linked to differences in economic coping behaviors.
Finally, we report findings on how economic behaviors depend on household wealth.10
Household Strategies and Economic Shocks
While we recognize that the economic crisis has affected nearly everyone in some way or another, we are
particularly interested in how households that are especially impacted have reacted to the economic crisis. In this
section, we analyze the relationship between two household-specific economic shocks (income loss and employment
loss) and how they are correlated with households’ decisions to engage in various coping strategies. A related
question is whether these shocks have had the same effect for the wealthy and the poor. Those results are reported
in a later subsection.
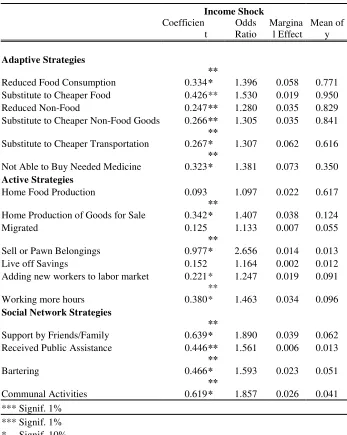
Income Shocks. As expected, in every case the effect of a reduction in household income has a positive effect on the probability of adoption of coping strategies. Among the adaptive strategies, there is substantial evidence that
households with income losses are more likely to have engaged in a broad set of coping strategies, including
9
Caveat lector - the results are not presented in the usual format. The actual estimation involved 17 logit equation
where the dependent variables are the coping strategies. Each equation includes the three economic shocks as well
as a set of control variables listed in the appendix .
10
Only specifically interesting coefficients and results are reported. The full set of regression results is available
reduction in consumption of both essential and non-essential goods, as well as a shift towards less expensive forms
of both essential and non-essential goods.
The effects of an income shock on utilization of active strategies are generally observed to be smaller than for
adaptive strategies, and fewer are statistically significant. One exception is the large effect on households beginning
to sell or pawn belongings as seen in the odds ratios. We also note that these households were also more likely to
have engaged in increased work effort (home production of goods for sale and working more hours) which is what
traditional economic models of labor supply would predict. While looking at the marginal effects gives an idea of
the size of the absolute effects, we should expect larger impacts at the margin for those activities that are less
common in the population at large. A case in point is the impact of an income shock on the decision to engage in
home production of goods for sale. While the marginal effect of the shock is only about 4%, this represents a
significant impact on a strategy that is only used by 12% of the population. So, by comparison, the group that is
affected by an income shock is much more likely to begin to engage in home production than those who were not
affected.
Similarly, the effects for the social network strategies have small marginal effects, but in a relative sense,
households that suffered a loss in income are much more likely to begin to employ social network strategies.
Specifically, the odds of supporting by friends and families is almost 90% greater, holding all variables constant.
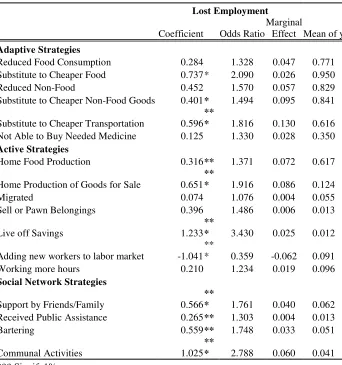
Employment Shocks. Another set of solid results comes from our examination of the impact of one or more household members losing employment. These results are presented in Table 6. Similar to the income effect (and
not surprisingly so), in most cases households with employment shocks were more likely to have engaged in coping
strategies. While the effects on adaptive strategies are generally larger than those observed for the income shocks,
these results are not as statistically significant. Taken as a whole, the results on adaptive strategies suggest again a
diverse pattern of coping strategies for those with employment losses.
with employment loss are more likely to engage in home production of both consumption goods and goods for sale.
They are also more likely to being to live off of savings which is also consistent with the usual life-cycle models of
consumer behavior.
With respect to social network strategies, just as with the income shocks, employment shocks are associated with
significant and large increases in the probability that households began to employ these coping strategies. The
results show that it is particularly important in the case of participating on community activities, in which the odds is
2.78 times greater.
Finally, we point out that these employment-related results are in addition to any income effect that would arise if
households that suffered employment loss also suffered income losses. The effects are cumulative, so a household
that suffered both an employment loss and an income loss would be predicted to be 8% (4% income effect + 4%
employment effect) more likely to increase reliance on friends and family than one who had neither of these shocks.
Considering these two effects conjointly suggests an even greater impact of the economic crisis than one would
observe by considering them separately.
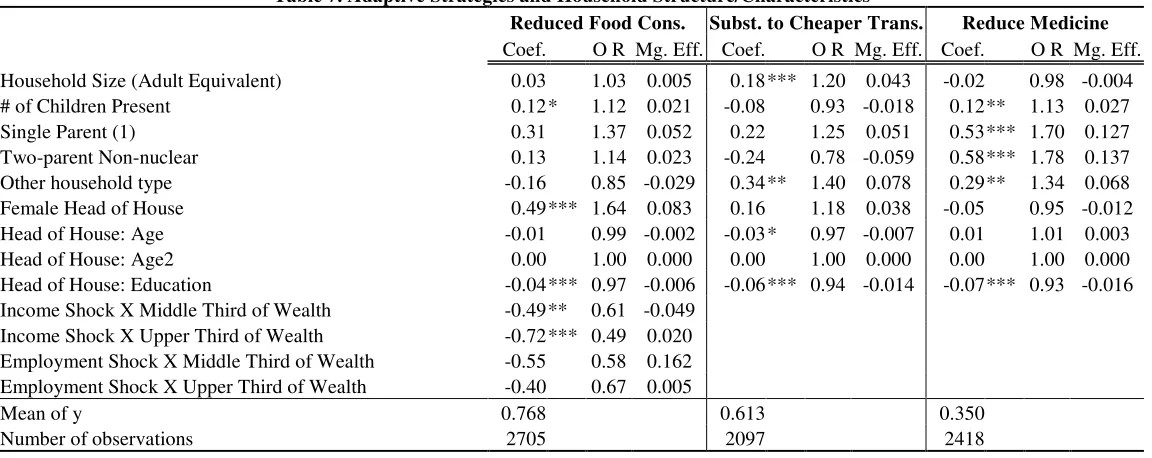
Household Structure and Characteristics
In Tables 7 to 9 we present results on the impact of household structure or family type on some of the most
interesting coping strategies. Household size, per se, does not appear to have a significant effect. Larger households
are observed to be more likely to have substituted towards cheaper transportation, but, on the other hand, household
size seems to have little (and not significant) impact on the reduction in food consumption or medications.
However, the probability of reducing food consumption depends positively on the number of children in the
household. In fact, for each additional young child, the odds of having reduced food consumption increase by 12%.
Note that this result holds when all else remains equal, including income and wealth. We must recognize, though,
that we cannot tell how food is distributed within the household and thus whether children indeed suffer
Additionally, there is a positive and highly significant effect observed for the variable family type on reduced
purchases of medicines when needed. Specifically, for single parent households, or where the family nucleus is
extended and there is no direct blood relationship among the members of the household, the probabilities of
reducing consumption of medications that are in fact being needed, are higher than in the case of complete nuclear
households. This is possibly linked to the lower probability of finding extended families in which all of its members
have medical insurance, limiting access to medications.
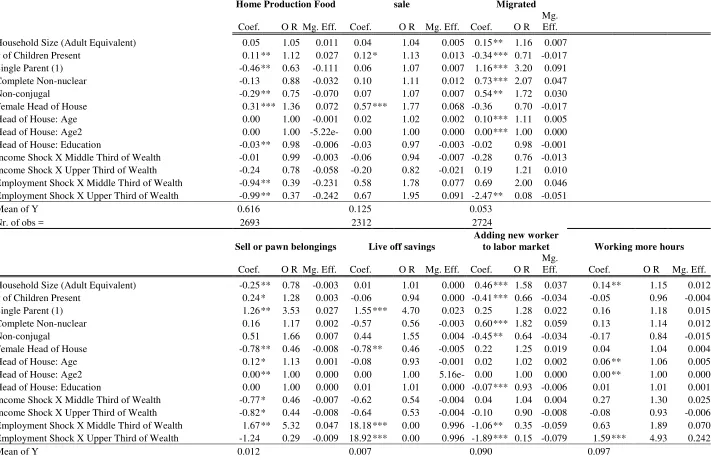
As we observe in tables 7 to 9, the group of variables that characterize family structure do not have a significant
effect on the rest of the strategies. However, it is noteworthy to add that, as expected, the probability of having at
least one member in the household that has migrated due to the crisis is significantly lower in complete nuclear
households. This effect is higher in the case of extended households.
Households led by female heads have highly significant effects in beginning to use strategies related to home
production, whether it is aimed at substituting for manufactured goods or in order to sell their own production. In
this last case, the probabilities are 77% higher than for households headed by men. Households led by men often
recur to other kinds of coping mechanisms. Holding all else equal, these households have higher probabilities of
turning to their savings or of selling their assets. At the same time, these are households in which the probability of a
reduction in consumption patterns is 64% less likely than in female led ones.
The age of the head of household does not appear to be a very influential variable. However, there is a positive and
significant relationship on beginning to sell or pawn belongings and bartering. This might be due to the fact that
households with older heads have probably accumulated more physical assets over time and are therefore more
prone to sell or pawn some of these.
Isolating all other effects, higher years of education for the head of the household negatively and significantly affect
many cases essential goods) seeking alternative strategies for survival such as increasing the number of hours
worked.11
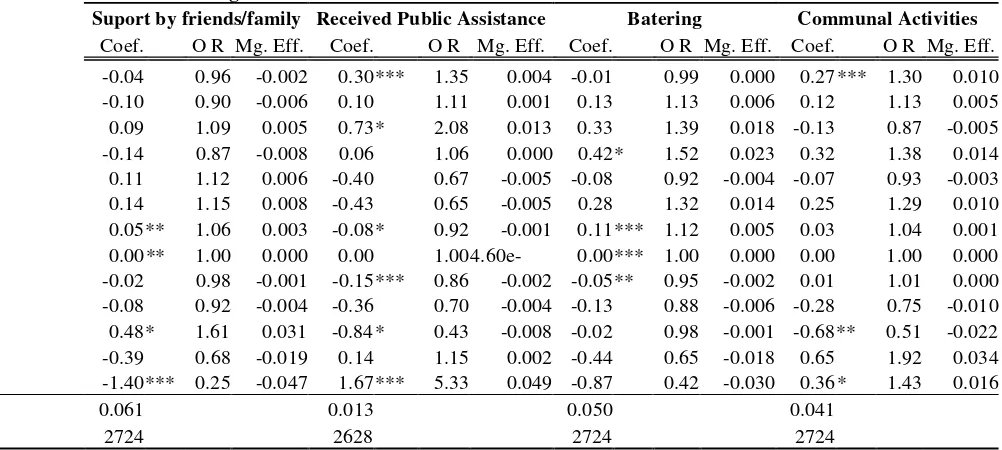
Finally, we observe some interesting facts in terms of the variables that appear to have effects on the likelihood of
receiving assistance from the government. Single-parent households are more likely than traditional households to
begin receiving public assistance. Also, the odds of receiving assistance are increased 35% for each additional
equivalent adult in the household, holding the rest of the variables constant. The number of children present has a
positive effect, although it is not significant, while the age of the head of household negatively affects the
probability of receiving government assistance. These results are closely related to the distinctive characteristics of
one of the main social program (Plan Jefes y Jefas de Hogar) provided by the government during this period of
crisis. Lastly, we observe that for each additional year of education of the head of household, the probability of
receiving assistance is 14% lower, and this effect is significant.
Coping Behaviors and Household Wealth
An important question is whether the impact of household-specific shocks varies by socioeconomic status. To
address this question, we have included cross-product terms with our constructed wealth index in the regression
specification. In order to make interpretation easier, and because we are concerned about potential measurement
errors, we divide the sample into thirds based on the wealth index. In the following comparisons, we look at the
difference in the effect of income and employment shocks on coping strategies for those from the lowest third when
compared to those from the highest third. These results are included with the household structure results in Tables
7-9.
First, we discuss differences in the effect of an income shock on coping strategies. Our results suggest that there are
only limited differences in adaptive or active household coping behaviors between the wealthiest third and the
poorest third. Two significant differences are that the effect of a loss in income is much less likely to have resulted
in a reduction in food consumption or for beginning to sell or pawn belongings for the wealthiest third than for the
11
poorest third. However, with respect to social network strategies, there are more important differences. Households
in the highest third of the wealth distribution are observed to be more likely to rely on support of friends and family
and less likely to have received public assistance or participate in communal activities. These results are consistent
with the hypothesis that wealthier families also have greater access to resources through family and friends,
suggesting a smaller need for reduction in consumption or reliance on broader social strategies.
With respect to employment loss, a slightly different pattern is observed. Similarly to the case of an income shock,
when compared to the poorest third of households, those in the highest third of the wealth distribution that suffered
an employment loss are less likely to sell or pawn belongings. On the contrary, the main difference is that while
they are more likely to receive support from friends and family when they experiment a shock of employment, they
are less likely to use this strategy when they have a income shock. Their labor market behavior also differs from
those in the lowest third. The richest third are less likely to have added a new worker to the labor market and they are more likely to increase work hours as a coping strategy. This may be due to the fact that they were more likely
to have all adults working, thereby preventing an increase in labor force participation, and requiring an increase in
work effort by those who are employed as the easiest margin of adjustment. In fact, the difference on the effect of
working more hours is a substantial one, with an odds ratio of almost 5, suggesting that this behavior is five times
more likely for those in the top third of wealth than for those in the bottom third.
7. Conclusions
In this paper, we have looked at three main issues: (i) how specific economic shocks have affected household
behaviors by focusing on the coping strategies adopted by Argentine families after the ‘post-convertibility’
economic crisis; (ii) how coping behaviors are influenced by standard household characteristics (e.g. size,
composition, etc.); and (iii) how behaviors differ between richer and poorer households.
We have used data from a recent survey of Argentine households specially conducted to assess the effects of the
economic crisis on household welfare. The analysis is unique in its ability to estimate the relative responses to
consider a variety of measures of household behavior. We have categorized 17 observed household behaviors into
three broad categories – adaptive strategies, active strategies, and social network strategies.
Specifically, we find that a reduction in household income is associated with significantly higher rates of use of
adaptive and social network strategies, especially reduction in consumption of elastically-demanded goods, but also
a reduction in the consumption of food. Smaller impacts are observed for active strategies.
As expected, the effects on households of employment loss are generally larger than those of a generic income loss.
In particular, strategies that are more attractive when time costs are lower (such as home production and slower
modes of transportation) are more responsive to employment loss. There are also large and significant effects on
active and social network strategies.
The analysis suggests that households with a larger number of children, single-parent households and female headed
households are significantly more likely to reduce consumption and go without needed medicine. Households with
single parent are significantly more likely than traditional households to have gone without needed medication.
Additionally, if the head of house is a female, it is more likely to reduce food than a male house-headed, but we are
not able to identify intra-family effects. Larger households and single parent households are more likely to receive
public assistance, other things equal.
Our results suggest that there are limited differences in adaptive or active household coping behavior between
different wealth groups. Not surprisingly, we find that the probability that income losses will result in reduced food
consumption or the sale of assets is positively correlated with wealth. Perhaps more notable is the significantly
Bibliography
1. Cunningham, W. and W. Maloney, "Measuring Vulnerability: Who suffered in the 1995 Mexican Crisis?"
(Washington, DC: World Bank, 2000).
2. Filmer , D. and L. Pritchett , “Estimating wealth effects without expenditure data - or tears. With an application to
educational enrollments in states of India.”. (Policy Research Working Paper: World Bank, 1998)
3. Fiszbein, A., P. Giovagnoli, and I. Aduriz , “Argentina’s crisis and its impact on household welfare”. (Office for
Argentina, Chile, Paraguay and Uruguay. Working Paper 01/02: World Bank, 2002).
4. Gaviria, A. , “Household Responses to adverse income shocks in Latin America”. (Fedesarrollo – Bogotá,
Colombia, 2001).
5. Instituto Nacional de Estadística y Censos - INDEC, “Incidencia de la pobreza y la indigencia en los aglomerados
urbanos” (Incidence of poverty and indigence in urban conglomerates). Anexo Metodológico. Informe de Prensa:
Buenos Aires, 2001).
6. Lokshin M. and R. Yemtsov, “Household strategies for coping with poverty and social exclusion in post crisis
Russia”. (Policy Research Working Paper : World Bank, 2001).
7. Neri, M. and M. Thomas, “Household Reponses to Labor Market Shocks in Brazil: 1982-1999,” (Washington,
D.C: World Bank, 2000).
8. Scott Long, J. Regression models for categorical and limited dependent variables. (Advanced Quantitative
Techniques in the Social Sciences Series 7. SAGE publications, 1996).
10. Torrado, S., “Familia y Diferenciación Social. Cuestiones de Método”. (Family and social difference. Method
Issues). (Argentina: Universidad de Buenos Aires, Eudeba, 1998).
11. Uribe, J.P and Nicole Schwab, “The Argentine Health Sector in the Context of the Crisis”. (Office for Argentina,
48.0
60.8
55.6
64.9 65.5 68.6
9.1 11.6 14.3
16.9
13.3
22.2
0.0 10.0 20.0 30.0 40.0 50.0 60.0 70.0 80.0
Le s s tha n 1.06
1.06 - 1.5 1.5 - 2.6 2.6 - 3.5 3.5 - 4.5 m o re tha n 4.5
[image:20.595.167.406.165.272.2]Adaptive Strategies
Reduced Food Consumption Reduced the quantity of food consumed
Substitute to Cheaper Food Substituted toward consumption of cheaper food Reduced Non-Food Reduced purchase of non-food goods
Substitute to Cheaper Non-Food Goods Substituted toward purchase of cheaper non-food goods Not Able to Buy Needed Medicine1 Household members were not able to buy needed medicine Substitute to Cheaper transportation Switched to cheaper transportation (from private car to public
transportation or from public transportation to bicycle/walking)
Active Strategies
Home Food Production Increased home production of consumption goods Home Production of Goods for Sale Begin to make items at home for sale
Migrated A member of the household has emigrated or permanently relocated to another city, province, or country except due to marriage, illness, or becoming independent.
Sell or Pawn Belongings2 Begin to sell, pawn, or mortgage belongings (clothing, foods, jewelry, animals, tools, etc.)
Live off Savings2 Begin to maintain home by drawing down savings Adding new workers to labor market At least one household member joined the labor force Working more hours At least one household member began to work more hours
Social Network Strategies
Support by Friends/Family2 Begin to receive support from people outside the home Received Public Assistance2 Begin to maintain home by “social help plans” (government,
churches, not-for-profit institutions)
Bartering2 Begin to participate in some form of bartering
Communal Activities2 Begin to participate in any form of communal activity: school meal programs, neighborhood or communal meal programs, communal purchase, “American” fairs, communal workshops for income, neighborhood work groups, fund-raising, communal child-care, movements to increase government programs, or communal construction (walkways, schools, etc.)
Notes: 1. Households were asked whether members were able to buy needed medicine from October 2001 to June-July 2002
2. For these activities, households were asked whether they participated or relied on them prior to October,
Changes in consumption patterns Households Loss Loss No Shock
Adaptive Strategies Food
Reduced Food Consumption 73.5% 76.7% 84.8% 68.2% Substitute to Cheaper Food 92.6% 95.0% 97.4% 88.1%
Other goods & services
Reduced Non-Food 81.1% 84.0% 89.9% 77.4% Substitute to Cheaper Non-Food Goods 82.8% 85.6% 90.0% 78.9% Substitute to Cheaper Transportation 59.9% 64.2% 75.9% 51.5%
Health services
Not Able to Buy Needed Medicine 37.3% 41.2% 48.4% 33.5%
Changes in consumption patterns
All Households
Without Children
1 Child Present
2 Children Present
3+ Children Present
Adaptive Strategies Food
Reduced Food Consumption 73.5% 69.6% 74.0% 80.8% 92.1% Substitute to Cheaper Food 92.6% 91.2% 93.7% 95.1% 96.5%
Other goods & services
Reduced Non-Food 81.1% 80.0% 80.8% 84.5% 85.5% Substitute to Cheaper Non-Food Goods 82.8% 81.1% 85.1% 83.8% 88.5% Substitute to Cheaper Transportation 59.9% 56.7% 61.9% 66.5% 71.5%
Health services
Not Able to Buy Needed Medicine 37.3% 35.2% 34.1% 41.1% 56.3%
1
[image:22.595.60.549.134.476.2]Changes in consumer behavior Households Loss Loss
Active Strategies Time utilization
Home Food Production 60.5% 63.3% 72.2% 55.2% Home Production of Goods for Sale 14.7% 18.3% 23.4% 9.3%
Migrated 6.7% 7.2% 9.4% 6.1%
Financial Behavior
Sell or Pawn Belongings 2.8% 4.5% 5.6% 0.8% Live off Savings1 12.2% 14.4% 41.0% 9.2%
Labor market
Adding new workers to labor market 13.4% 16.1% 11.8% 10.8% Working more hours 14.8% 19.2% 10.5% 8.7 %
1
[image:23.595.105.488.132.303.2]Changes in social behavior
All Households
Income Shock
Employment Loss
No Shocks Support by Friends/Family 7.8% 10.6% 18.9% 5.0% Received Public Assistance 4.3% 5.8% 7.7% 3.4%
Bartering 8.5% 11.7% 15.1% 4.4%
Communal Activities 6.3% 9.5% 16.1% 3.1%
By Household Structure
Changes in social behavior All Types
Two-parent nuclear
Two-parent
Non-nuclear Single Parent Other Support by Friends/Family 7.8% 7.6% 6.1% 11.0% 7.9% Received Public Assistance 4.3% 4.3% 7.6% 9.5% 1.5%
Bartering 8.5% 8.3% 12.0% 16.5% 5.0%
[image:24.595.61.533.244.343.2]Income Loss 2763 0.409 0.492 0 1 Employment Loss 2763 0.091 0.287 0 1
[image:25.595.130.464.132.339.2]Income Shock Coefficien t Odds Ratio Margina l Effect Mean of y Adaptive Strategies
Reduced Food Consumption 0.334
**
* 1.396 0.058 0.771 Substitute to Cheaper Food 0.426** 1.530 0.019 0.950 Reduced Non-Food 0.247** 1.280 0.035 0.829 Substitute to Cheaper Non-Food Goods 0.266** 1.305 0.035 0.841 Substitute to Cheaper Transportation 0.267
**
* 1.307 0.062 0.616 Not Able to Buy Needed Medicine 0.323
**
* 1.381 0.073 0.350
Active Strategies
Home Food Production 0.093 1.097 0.022 0.617
Home Production of Goods for Sale 0.342
**
* 1.407 0.038 0.124 Migrated 0.125 1.133 0.007 0.055
Sell or Pawn Belongings 0.977
**
* 2.656 0.014 0.013 Live off Savings 0.152 1.164 0.002 0.012 Adding new workers to labor market 0.221* 1.247 0.019 0.091
Working more hours 0.380 **
* 1.463 0.034 0.096
Social Network Strategies
Support by Friends/Family 0.639
**
* 1.890 0.039 0.062 Received Public Assistance 0.446** 1.561 0.006 0.013
Bartering 0.466
**
* 1.593 0.023 0.051 Communal Activities 0.619
**
* 1.857 0.026 0.041 *** Signif. 1%
[image:26.595.123.470.129.564.2]Lost Employment
Coefficient Odds Ratio
Marginal
Effect Mean of y
Adaptive Strategies
Reduced Food Consumption 0.284 1.328 0.047 0.771 Substitute to Cheaper Food 0.737* 2.090 0.026 0.950 Reduced Non-Food 0.452 1.570 0.057 0.829 Substitute to Cheaper Non-Food Goods 0.401* 1.494 0.095 0.841 Substitute to Cheaper Transportation 0.596
**
* 1.816 0.130 0.616 Not Able to Buy Needed Medicine 0.125 1.330 0.028 0.350
Active Strategies
Home Food Production 0.316** 1.371 0.072 0.617 Home Production of Goods for Sale 0.651
**
* 1.916 0.086 0.124 Migrated 0.074 1.076 0.004 0.055 Sell or Pawn Belongings 0.396 1.486 0.006 0.013
Live off Savings 1.233
**
* 3.430 0.025 0.012 Adding new workers to labor market -1.041
**
* 0.359 -0.062 0.091 Working more hours 0.210 1.234 0.019 0.096
Social Network Strategies
Support by Friends/Family 0.566
**
* 1.761 0.040 0.062 Received Public Assistance 0.265** 1.303 0.004 0.013 Bartering 0.559** 1.748 0.033 0.051 Communal Activities 1.025
**
* 2.788 0.060 0.041 *** Signif. 1%
[image:27.595.127.469.129.494.2]Coef. O R Mg. Eff. Coef. O R Mg. Eff. Coef. O R Mg. Eff. Household Size (Adult Equivalent) 0.03 1.03 0.005 0.18*** 1.20 0.043 -0.02 0.98 -0.004 # of Children Present 0.12* 1.12 0.021 -0.08 0.93 -0.018 0.12** 1.13 0.027 Single Parent (1) 0.31 1.37 0.052 0.22 1.25 0.051 0.53*** 1.70 0.127 Two-parent Non-nuclear 0.13 1.14 0.023 -0.24 0.78 -0.059 0.58*** 1.78 0.137 Other household type -0.16 0.85 -0.029 0.34** 1.40 0.078 0.29** 1.34 0.068 Female Head of House 0.49*** 1.64 0.083 0.16 1.18 0.038 -0.05 0.95 -0.012 Head of House: Age -0.01 0.99 -0.002 -0.03* 0.97 -0.007 0.01 1.01 0.003 Head of House: Age2 0.00 1.00 0.000 0.00 1.00 0.000 0.00 1.00 0.000 Head of House: Education -0.04*** 0.97 -0.006 -0.06*** 0.94 -0.014 -0.07*** 0.93 -0.016 Income Shock X Middle Third of Wealth -0.49** 0.61 -0.049
Income Shock X Upper Third of Wealth -0.72*** 0.49 0.020 Employment Shock X Middle Third of Wealth -0.55 0.58 0.162 Employment Shock X Upper Third of Wealth -0.40 0.67 0.005
Mean of y 0.768 0.613 0.350
Number of observations 2705 2097 2418
1 The reference household has the following characteristics: Two-parent nuclear household with a male head of house of average education and age with no economic shocks.
[image:28.792.110.686.94.323.2]Home Production Food sale Migrated
Coef. O R Mg. Eff. Coef. O R Mg. Eff. Coef. O R Mg.
Eff. Household Size (Adult Equivalent) 0.05 1.05 0.011 0.04 1.04 0.005 0.15** 1.16 0.007
# of Children Present 0.11** 1.12 0.027 0.12* 1.13 0.013 -0.34*** 0.71 -0.017 Single Parent (1) -0.46** 0.63 -0.111 0.06 1.07 0.007 1.16*** 3.20 0.091 Complete Non-nuclear -0.13 0.88 -0.032 0.10 1.11 0.012 0.73*** 2.07 0.047 Non-conjugal -0.29** 0.75 -0.070 0.07 1.07 0.007 0.54** 1.72 0.030 Female Head of House 0.31*** 1.36 0.072 0.57*** 1.77 0.068 -0.36 0.70 -0.017 Head of House: Age 0.00 1.00 -0.001 0.02 1.02 0.002 0.10*** 1.11 0.005 Head of House: Age2 0.00 1.00 -5.22e- 0.00 1.00 0.000 0.00*** 1.00 0.000 Head of House: Education -0.03** 0.98 -0.006 -0.03 0.97 -0.003 -0.02 0.98 -0.001 Income Shock X Middle Third of Wealth -0.01 0.99 -0.003 -0.06 0.94 -0.007 -0.28 0.76 -0.013 Income Shock X Upper Third of Wealth -0.24 0.78 -0.058 -0.20 0.82 -0.021 0.19 1.21 0.010 Employment Shock X Middle Third of Wealth -0.94** 0.39 -0.231 0.58 1.78 0.077 0.69 2.00 0.046
Employment Shock X Upper Third of Wealth -0.99** 0.37 -0.242 0.67 1.95 0.091 -2.47** 0.08 -0.051
Mean of Y 0.616 0.125 0.053
Nr. of obs = 2693 2312 2724
Sell or pawn belongings Live off savings
Adding new worker
to labor market Working more hours
Coef. O R Mg. Eff. Coef. O R Mg. Eff. Coef. O R Mg.
[image:29.792.43.754.100.562.2]Table 9: Social Network Strategies and Household Structure/Characteristics
Suport by friends/family Received Public Assistance Batering Communal Activities
Coef. O R Mg. Eff. Coef. O R Mg. Eff. Coef. O R Mg. Eff. Coef. O R Mg. Eff. Household Size (Adult Equivalent) -0.04 0.96 -0.002 0.30*** 1.35 0.004 -0.01 0.99 0.000 0.27*** 1.30 0.010 # of Children Present -0.10 0.90 -0.006 0.10 1.11 0.001 0.13 1.13 0.006 0.12 1.13 0.005 Single Parent (1) 0.09 1.09 0.005 0.73* 2.08 0.013 0.33 1.39 0.018 -0.13 0.87 -0.005 Two-parent Non-nuclear -0.14 0.87 -0.008 0.06 1.06 0.000 0.42* 1.52 0.023 0.32 1.38 0.014 Other household type 0.11 1.12 0.006 -0.40 0.67 -0.005 -0.08 0.92 -0.004 -0.07 0.93 -0.003 Female Head of House 0.14 1.15 0.008 -0.43 0.65 -0.005 0.28 1.32 0.014 0.25 1.29 0.010 Head of House: Age 0.05** 1.06 0.003 -0.08* 0.92 -0.001 0.11*** 1.12 0.005 0.03 1.04 0.001 Head of House: Age2 0.00** 1.00 0.000 0.00 1.004.60e- 0.00*** 1.00 0.000 0.00 1.00 0.000 Head of House: Education -0.02 0.98 -0.001 -0.15*** 0.86 -0.002 -0.05** 0.95 -0.002 0.01 1.01 0.000 Income Shock X Middle Third of Wealth -0.08 0.92 -0.004 -0.36 0.70 -0.004 -0.13 0.88 -0.006 -0.28 0.75 -0.010 Income Shock X Upper Third of Wealth 0.48* 1.61 0.031 -0.84* 0.43 -0.008 -0.02 0.98 -0.001 -0.68** 0.51 -0.022 Employment Shock X Middle Third of Wealth -0.39 0.68 -0.019 0.14 1.15 0.002 -0.44 0.65 -0.018 0.65 1.92 0.034 Employment Shock X Upper Third of Wealth -1.40*** 0.25 -0.047 1.67*** 5.33 0.049 -0.87 0.42 -0.030 0.36* 1.43 0.016
Mean of y 0.061 0.013 0.050 0.041
Number of obs = 2724 2628 2724 2724