Meta-analysis of the effect of oral selenium supplementation
on milk selenium concentration in cattle
A. Ceballos,*
1J. Sánchez,† H. Stryhn,* J. B. Montgomery,* H. W. Barkema,‡ and J. J. Wichtel*
*Department of Health Management, Atlantic Veterinary College, University of Prince Edward Island, Charlottetown, Prince Edward Island C1A 4P3, Canada
†Canadian Food and Inspection Agency, Charlottetown, Prince Edward Island C1E 1E3, Canada
‡Department of Production Animal Health, Faculty of Veterinary Medicine, University of Calgary, Calgary, Alberta, T2N 4N1, Canada
ABSTRACT
Soils in many regions of the world have a low Se
con-tent. Consequently, forages and crops grown on these
soils may provide inadequate dietary Se for humans
and grazing animals. Selenium supplementation has
been used to enhance Se status and milk Se
concentra-tion, but results conflict. Milk Se concentration appears
to be a useful indicator of animal and herd Se status,
and reflects the responsiveness to supplementation. A
systematic review and meta-analysis were carried out
to summarize all available scientific evidence for the
effect of oral Se supplementation on milk Se
concen-tration in cattle. The literature search was based on
electronic and nonelectronic databases. Fixed- and
random-effects models of meta-analysis were used, and
a meta-regression was carried out to evaluate
heteroge-neity among studies. Random-effects meta-analysis was
performed on 42 studies published between 1977 and
2007. Oral Se supplementation resulted in an average
increase in milk Se content of 0.16 (95% confidence
interval: 0.117, 0.207) μmol/L, with a significant
het-erogeneity among studies. Weak publication bias was
evident, but it did not change the average effect. The
continent where the study was performed, Se source,
Se dose, and the interaction between source and dose
explained 71% of the between-study variance. On
aver-age, American cows supplemented with Se yeast (e.g.,
6 mg/h per day) had greater milk Se concentrations
(approximately 0.37 μmol/L) 75 d after the beginning
of supplementation when compared with those
supple-mented with inorganic forms of Se. This information
provides a basis for tailoring daily animal requirements
and for enhancing the Se intake of consumers of dairy
products.
Key words: cattle, milk, selenium, meta-analysis
INTRODUCTION
Selenium is a naturally occurring solid substance
typi-cally defined as nonmetallic that occurs worldwide but
is distributed unevenly in soils (Oldfield, 2002). Many
regions of the world have soils with low Se content;
con-sequently, feedstuffs grown on these soils may provide
inadequate dietary Se for humans and grazing animals.
Selenium nutritional requirements for beef and dairy
cattle have been set at 0.1 and 0.3 mg/kg on a DM
basis, respectively (NRC, 2000, 2001). Although Se is
not an essential nutrient for plant growth, agricultural
practices, such as application of inorganic fertilizers,
may contribute to further reducing the content of Se
in soils and plants (Hartikainen, 2005). The
consump-tion of animal products derived from animals grazing
in low-Se areas can influence the Se status of entire
human communities, putting humans at risk of overt
deficiency (World Health Organization/Food and
Agri-culture Organization of the United Nations, 2004). This
risk has been recognized by some countries, for instance
Finland, where Se application to grain crops grown for
human consumption is required by law (Hartikainen
and Ekholm, 2001).
Milk derived from cattle on pasture contributes to a
person’s daily intake of Se, because daily consumption
of 100 g of milk will provide at least 10% of the daily Se
requirement for adults (Knowles et al., 2004). Moreover,
it is recommended that milk-based formulas used for
in-fants provide at least 10 μg of Se/d to complement the
maternal supply (World Health Organization/Food and
Agriculture Organization of the United Nations, 2004),
but nonfortified cow’s milk-based formulas will often
not provide this amount (Carver, 2003). Consequently,
tailoring dairy products to meet specific requirements
of a population, such as enhanced Se intake, is an
at-tractive concept for the promotion of human health
(Knowles et al., 1999, 2004).
Feeding systems to increase milk Se content have
been developed (Knowles et al., 1999; Grace et al.,
2001; Guyot et al., 2007). Early studies in the 1970s
indicated that a relatively small proportion of Se was
doi:10.3168/jds.2008-1545
© American Dairy Science Association, 2009.
Received July 11, 2008. Accepted September 3, 2008.
transferred into milk after feeding inorganic forms of Se
such as sodium selenite. Supplementation with sodium
selenite increased milk Se content when cows were fed
rations low in naturally occurring Se, but there was less
impact when cows were fed rations greater in naturally
occurring Se (Conrad and Moxon, 1979). In fact, many
experiments have shown that Se supplementation
re-sults in an increase in the Se content of milk, but it does
not appear to increase linearly as Se intake increases
(Conrad and Moxon, 1979). These authors concluded
that Se from natural sources might be transferred more
readily to milk, probably because of its greater
bio-availability. In addition, it was noted that an increase
in Se intake would not produce important increases
in milk Se content when cows were fed Se-adequate
rations (Aspila, 1991). Further studies have reported
different effects of Se supplementation on milk Se
con-centration, depending on previous and current dietary
Se content, source, and route of administration (Aspila,
1991; Malbe et al., 1995; Knowles et al., 1999), but
not all attempts to increase milk Se concentration have
been successful (Stowe et al., 1988; Gierus et al., 2003).
Trials in cattle have shown variable results after using
different sources, doses, and routes of administration of
Se, describing either nonsignificant effects (Ammerman
et al., 1980) or milk Se concentrations increased by as
much as 7-fold (Guyot et al., 2007).
The incorporation of Se into the various fractions of
milk may vary depending on the source and route of
administration of the supplement. Although this may
have practical implications for the dairy-processing
industry, it has not been adequately examined to date.
In addition, many supplementation experiments have
been conducted for only short durations, not long
enough for milk to reach a steady-state Se
concentra-tion after a change of intake. Consequently, there is a
need to summarize the response to different sources of
supplementary Se and its transfer into milk, to assist
in the design of effective supplementation programs to
produce dairy products of the best quality for human
consumption, and to address the growing market for
enriched foods that meet particular health and lifestyle
demands. Clear guidelines concerning how Se
supple-ments should be administered to cattle, in particular,
to produce Se-fortified milk for human consumption
have not been available.
Narrative reviews have indicated a beneficial effect of
Se supplementation on milk Se concentration (Conrad
and Moxon, 1980; Weiss, 2005). Traditional narrative
reviews have been widely used in veterinary literature
to collate existing evidence on a particular intervention,
but the majority of these do not use either a systematic
or a statistical method to identify, assess, and
syn-thesize the information they are gathering. Narrative
reviews are subjective and based on the preconceived
opinions of the reviewer, and are therefore prone to bias
(Sargeant et al., 2006). On the other hand, systematic
reviews appraise critically, summarize, and attempt to
reconcile all published evidence concerning a
particu-lar intervention (Jadad et al., 1997). They minimize
systematic and random errors, and may or may not
in-clude a quantitative statistical analysis (meta-analysis)
of the results of 2 or more studies to produce an average
estimate of the treatment effect (Jadad et al., 1998;
Sargeant et al., 2006). The objective of this study was
to summarize, through a systematic review and
meta-analysis, all available scientific evidence related to the
effect of oral Se supplementation on milk Se
concentra-tion in cattle.
MATERIALS AND METHODS
Literature Search
Manuscripts were excluded if the title or abstract
indicated that the study pertained to species different
from cattle, or pertained to supplementation trials
en-rolling animals other than first-calving heifers or
mul-tiparous cows, or if the milk Se concentration was not
evaluated. Additionally, studies were excluded if cows
were supplemented with Se sources other than sodium
selenite, sodium selenate, or Se yeast, because those
forms are the most widely used for oral
supplementa-tion in cattle (Weiss, 2005).
Outcome Evaluated and Data Extraction
The mean difference in milk Se concentration
be-tween Se-supplemented and unsupplemented cows was
the outcome of interest. The milk Se concentration
increased sharply within the first 28 d of
supplementa-tion and decreased rapidly when supplementasupplementa-tion was
discontinued. Because very few studies extended the
supplementation beyond 170 d, only milk Se
concentra-tion data between 28 and 170 d were considered for the
meta-analysis.
All results were transformed to micromoles per liter
if the paper cited the results using different units. For
unit standardization, 78.96 g/mol was used for Se
mo-lecular weight (Barthelmy, 2005) and, on average, 1,030
g/L was used for milk density (Goff, 2008). Clinical
trials were included regardless of whether they were
conducted in a randomized fashion.
The precision of the estimate was based on its
re-ported standard error (SE) or on an SE calculated
from standard deviations (SD) of the treatment and
control groups. In studies involving repeated measures
on the same cows, estimates of milk Se concentration
at different time points were computed, and the
vari-ance was adjusted by an inflation factor given by the
formula (Dohoo et al., 2003):
σ
yσ
yρ
m
m
2 2
1
1
=
⎡
⎣⎢
+
(
−
)
⎤
⎦⎥
,
where
σ
y2
is the variance at each time point,
m
is the
number of time points,
ρ
is the intraclass correlation
coefficient within cows, and
⎡
1
+
(
−
1
)
⎣⎢
m
ρ
⎤
⎦⎥
corresponds
to the variance inflation factor. To adjust for clustering
within cows, different intraclass correlation coefficient
values (i.e., 0.90, 0.75, and 0.25) were assumed.
The same value for the SE or SD was used in both
groups when the paper reported a common value for
the study groups. Computation of a common SD was
made by reconstructing the statistical analysis, if the
information needed was available. For example, if the
paper reported only the mean for milk Se concentration
and a
P
-value, possibly in the form
P
< 0.05, the SD
was reconstructed under the assumption of a normal
distribution analysis as follows:
SD
x
x
t
n
n
dfE
=
(
2−
1)
(
)
+
2 1
1
1
/
α,,
where
x
2−
x
1represents the difference between means;
t
(
α,dfE)
is the percentile from the reference distribution;
and
n
is the sample size of each group. When an exact
calculation of SD was not possible, a SD was imputed
as the pooled SD (SD
p) from all the other available
studies included in the meta-analysis (Furukawa et al.,
2006).
In one manuscript, the mean milk Se concentration
and its SE were reported on a log scale (Hidiroglou et
al., 1987a). Assuming that log-transformed values
fol-lowed a normal distribution with the SD derived from
the SE and sample size, values on the log scale were
recalculated by simulation, and then back transformed
to calculate the arithmetic mean and its SE.
Additional considerations in the data-extraction
process were as follows. If a study contributed more
than one set of observations because data were
re-ported separately by parity, by study year, or by Se
source or Se dose, data for each set of observations were
recorded separately. Other information was recorded,
if available, from the selected studies (Table 1). Two
independent investigators extracted the information by
using a structured data-collection form, and the first
author resolved the discrepancies after re-reviewing the
paper.
Meta-Analysis
The effect of Se supplementation on milk Se
concen-tration in cattle was evaluated by carrying out
fixed-effects and random-fixed-effects meta-analyses. The results
reported in this paper correspond to the random-effects
meta-analysis, given the observed heterogeneity of the
results across the studies. The
Q
and
I
2statistics were
used to evaluate whether heterogeneity was present in
this study (Deeks et al., 2001; Higgins et al., 2003). The
random-effects meta-analysis was estimated according
to
T
i= + +
θ
u
iε
i, and
where
T
iis the effect of the
i
th study;
θ
is the true
ef-fect,
u
iis the random effect of study
i
; and
ε
iis the
re-sidual error. The variance of
T
iwas computed as the
sum of the between-study variance
( )
τ
2and the
within study variance
( )
υ
i(Sutton et al., 2000). The
random-effects meta-analysis was carried out via the
method-of-moments estimation (DerSimonian and
Laird, 1986). The result of the meta-analysis was
pre-sented graphically by using a forest plot. Moreover, the
prediction interval for the treatment effect of a new
trial was calculated and presented as part of the forest
plot (Harris et al., 2008). This interval is a prediction
of the range within which the milk Se concentration
will lie in a new trial evaluating the effect of oral Se
supplementation.
Publication Bias
Studies showing no effect, not written in English,
or containing results unfavorable to the study
spon-sor might be less likely to be published or included in
the analysis than those reporting significant, favorable
results. This is known as publication bias (Sterne et
al., 2001). Statistical (Begg’s and Egger’s tests) and
graphical methods (funnel plot) were used to evaluate
possible publication bias. Additionally, the
“trim-and-fill” method was used to estimate and correct for an
eventual publication bias. Studies having a large SE or
low statistical effects (i.e., “small studies”) were
omit-ted (trimming) until a funnel plot became symmetrical.
Further the “true” center of the plot was reestimated,
and the omitted studies were then replaced with their
“missing” counterpart studies around the center (Duval
and Tweedie, 2000; Sterne et al., 2001). This method
evaluates how much the average estimate of treatment
effect changes if studies are missing because of
publica-tion bias (Duval and Tweedie, 2000).
Meta-Regression
The meta-regression analysis is a regression-type
analysis in which each study is weighted by its precision.
It is an extension of the random-effects meta-analysis
Table 1. Additional information extracted from selected studies to evaluate the effect of oral Se supplementation on milk Se concentration in
cattle
Variable Description Quality of the study
Publication type Peer-reviewed journal, book chapter, abstract, proceedings, thesis, unpublished, other Sample size How sample size was determined
Inclusion criteria Whether criteria for selecting herds or animals were defined Random allocation Whether a random allocation of experimental units was used Experimental units
characteristics
Whether the herd or animal characteristics were defined
Details on previous Se status Whether Se status was defined before the experiment Intervention protocol Whether the intervention was adequately defined
Protocol feasible to adopt Whether the protocol was feasible to adopt under nonexperimental conditions Control group Whether a control group was included in the trial
Hierarchical structure Whether a hierarchical data structure was accounted for in the analysis Statistical analysis Whether the analysis was appropriate for the experimental design
Design of the study
Experimental design Randomized clinical trial, block design, randomized block design, incomplete block design, Latin square, observational study, other
Study population Experimental unit, commercial unit, both Production system Housed, pasture-based, other
Parity Primiparous cows, multiparous cows, both Type of production Beef cattle, dairy cattle, dual purpose Treated groups Number of treated groups
Duration of the study Months
Number of visits Number of visits to collect milk samples
Se analysis Graphite furnace atomic absorption spectroscopy, hydride generation atomic absorption spectroscopy, inductively coupled plasma or atomic emission spectroscopy, chromatography, neutron activation analysis, other
Source Sodium selenite or selenate, Se yeast Dose Dose of Se in milligrams per day Stage Stage of lactation when the study started Frequency Frequency of Se administration (once, continued) Days Number of days after treatment to sample collection
to estimate the extent to which one or more
covari-ates explain heterogeneity in the treatment effects. The
meta-regression of the factors related to the quality and
design of the study (Table 1) on the factor of interest
was performed by using the method-of-moments
esti-mation (Sutton et al., 2000). This method of estiesti-mation
was preferred for consistency with the other analyses.
Other methods of estimation resulted in changes in the
between-study variance but had only a minor impact
on the regression coefficients.
Unconditional analyses of trial precision, continent
where the study was performed, study population,
par-ity, type of production, source of Se and dose of Se, days,
stage of lactation, and frequency of administration were
evaluated, and unconditionally significant (
P
< 0.15)
associated variables were then retained to build a
mul-tivariable regression model. Further, the mulmul-tivariable
model was manually reduced by backward selection of
the significant variables (
P
< 0.05). Each covariate was
evaluated to determine, for each predictor, how much
of the between-study variance was accounted for.
Cumulative Meta-Analysis
Cumulative meta-analysis is the product of
perform-ing a new meta-analysis every time a new trial is added
to a series of trials. Repeated poolings, instead of a
single pooling estimation, are performed as each study
is added (Lau et al., 1995). Cumulative meta-analysis
was used as an exploratory tool to identify
retrospec-tively whenever the Se supplementation effect first
reached statistical significance. Moreover, cumulative
meta-analysis was used to correlate the accruing
evi-dence with recommendations made by experts (Egger
et al., 2001) and to identify eventual temporal patterns
in the trial results (Lau et al., 1995).
Influential Studies
Studies influencing the summary estimate were
iden-tified, generating an influence plot. An influence graph
was generated as an SE bar chart, in which summary
estimates were computed after sequentially omitting
one study at a time (Deeks et al., 2001). Those
stud-ies having an undue influence on the estimation of the
average effect of treatment were identified.
All analyses were carried out with Stata Statistical
Software release 10.0, using the commands metan,
me-tabias, metafunnel, metareg, metacum, and metaninf
(StataCorp., College Station, TX). No adjustment for
clustering within author was made because of the low
number of studies performed by the same author.
RESULTS
Literature Search
The search identified 139 potential references
con-taining the keyword combination in either their titles
or their abstracts. A total of 23 references could not
be recovered (1 narrative review, 4 duplicates of other
studies, 3 written in English, and 15 written in a
lan-guage beyond the scope of the selected lanlan-guages).
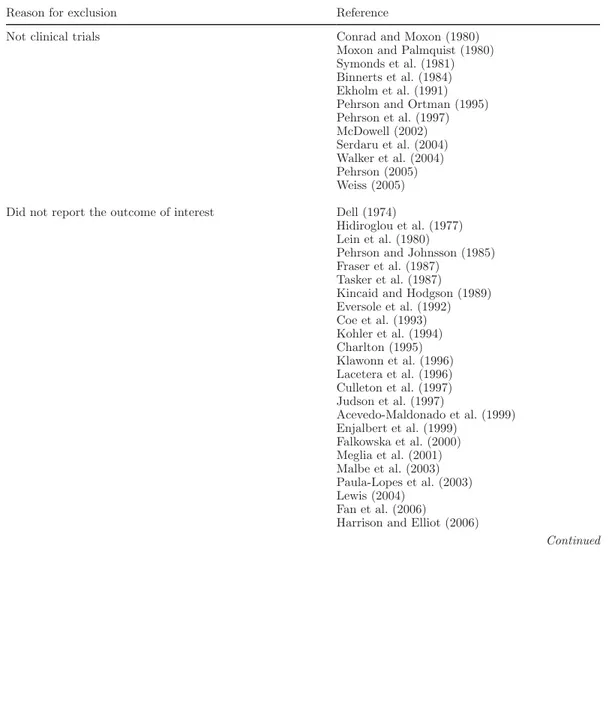
From the remaining 116 references, 77 were excluded
from the analysis (see Appendix). In 3 manuscripts, the
outcome of interest was described, but no data were
re-corded because supranutritional doses of Se were used.
These reports were written in English, and their results
are shown in Table 2. Three manuscripts reported the
results of 5 studies in which milk Se concentration was
evaluated at time points other than between 28 and 170
d from treatment, and these were excluded from the
meta-analysis (Table 3).
Consequently, 33 manuscripts containing the results
of 42 studies provided data that fulfilled all criteria and
were used to perform the meta-analyses. Twenty-eight
manuscripts were published in peer-reviewed journals,
3 were published as abstracts, one appeared as part
of conference proceedings, and one was published as
a book chapter. Thirty-one reports were written in
English, 1 was in Portuguese, and 1 was in German.
These references were categorized according to the
continent where they were performed: 15 were carried
out in America (Canada, United States, and Brazil),
13 in Europe, and 5 in Oceania (Australia and New
Zealand).
Seven studies in 5 manuscripts did not report the SD
(Ammerman et al., 1980; Aspila, 1991; Syrjala Qvist
and Aspila, 1993; Malbe et al., 1995; Hemken et al.,
1998); thereupon, their SD were imputed from all the
other available studies and were included in the
meta-analysis (Furukawa et al., 2006). Of the 33 references,
25 reported a positive effect of Se supplementation,
4 did not show a significant effect, and 4 did not
re-port the significance of the effect. All 4 manuscripts,
however, reported a numerically positive effect of Se
supplementation on milk Se concentration (Table 4).
Meta-Analysis
heterogeneity (
I
2) was estimated at 99.7%,
correspond-ing to a very strong between-study variation.
The average effect did not change when a
meta-anal-ysis was performed after removing those studies that
did not report the SD (Table 5). Additionally, adjusting
the overall variance by the variance inflation factor to
summarize the milk Se concentration measured at
dif-ferent time points did not produce any change in the
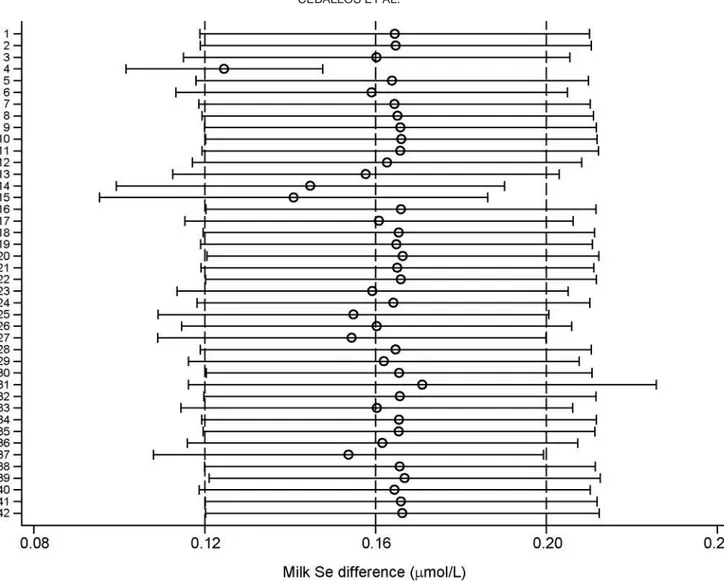
average effect or on its 95% CI (Table 5). The results
from each trial, the average effect of treatment, its 95%
CI, and the prediction interval are shown in Figure 1.
Publication Bias
The statistical approaches used for the evaluation of
publication bias showed differing results. Begg’s test
revealed a significant bias (
P
< 0.001), whereas the
Eg-ger’s test did not suggest a significant bias (
P
= 0.28).
The asymmetrical appearance (i.e., a gap in the lower
left quadrant) in Figure 2 suggested that publication
bias might be present. However, the average estimate,
using the random-effects trim-and-fill method, did not
result in any change in the effect of treatment obtained
in the random-effects meta-analysis, and no missing
studies were imputed.
Meta-Regression Analyses
None of the variables related to study quality (Table
1) recorded in the database showed a significant
associa-tion with the outcome of interest. However, the effect of
Se supplementation on milk Se concentration was less
when cows were part of a randomized clinical trial (
P
=
0.15). The unconditional analyses showed no significant
association (data not shown) of the outcome variable
with those variables related to the study design (Table
1), such as study population, production system, type
of production, parity, frequency of Se administration,
or days from treatment to first sample collection. A
significant (
P
< 0.01) unconditional association with
the outcome of interest was found for the continent
where the study was carried out and the source of Se
(Table 6). The relationship of milk Se concentration to
dose of Se was nonlinear, which was indicated by the
significance of a quadratic term for dose (Table 6).
Significant predictors remained in the multivariable
model (Table 7). Two interactions were not presented
in the table. The interaction between continent and
source of Se was close to significant (
P
= 0.06), and
the interaction between source of Se and the quadratic
effect of dose was not significant (
P
= 0.48). Those
interactions were omitted from the model. There were 2
somewhat extreme residuals corresponding to 2 trials in
which Se yeast was used (Malbe et al., 1995; Guyot et
T
able 2.
Summary of 3 st
udies rep
orted in 3 references not included in the meta-analysis
Reference Coun try 1 n 2 P arit y 3 Stage 4 Source 5
Dose, mg/h per da
y
Da
ys
6
Milk Se, μmol/L
Mean difference 7 Significance 8 Reason
Heard et al. (2004)
A U 15 Mult. E Y east 25.00 9 1.77 1.65 S Un usual dose P
ehrson and Johnsson (1985)
9 SE 18 Mult. E Na-Sel. 30.00 NR NR NR NR Un usual dose
Stagsted et al. (2005)
DK 3 NR NR Y east 25.00 30 1.77 1.60 NR Un usual dose 1 Coun try co
des according to official short names in English as giv
en in ISO 3166-1 and ISO 3166-1-α-2 co
de elemen
ts.
2n = n
um
b
er of co
ws.
3 P
arit
y: Mult. = m
ultiparous; All = first calving and m
ultiparous; NR = not rep
orted.
4Stage of lactation when the st
udy started: D = dry p
erio
d; E = from calving to 100 DIM; L = more than 100 DIM.
5 Source of Se: Na-Sel. = so
dium selenite or selenate; y
east = Se y
east.
6Da
ys: lag time from supplemen
tation to first milk sample collection for Se analysis.
7 Mean difference: difference b
et
w
een means for milk Se concen
tration of supplemen
ted and unsupplemen
ted co
ws.
8Significance: NS = not significan
t; S =
P
< 0.05.
9 Selenium w
as administered (30 mg/h) 2 times during late pregnancy
al., 2007). Their removal had little impact on estimates;
consequently, those studies were retained in the model.
Milk Se concentration was predicted by using the
coefficients of the multivariable regression model and
was plotted against several doses of Se in the form of
sodium selenite or selenate and Se yeast (Figure 3).
For example, studies that administered Se yeast (6 mg/
head per day) and were carried out in America had,
on average, a milk Se concentration of 0.37 μmol/L
greater than the concentration in cows supplemented
with sodium selenite or selenate 75 d after the
begin-ning of supplementation.
A sensitivity analysis was carried out by omitting 2
Australian trials that had a high predicted milk Se
con-centration after supplementation with Se yeast (Figure
3). In those trials, Se yeast was given at a dose greater
than 10 mg/h per day (Heard et al., 2007). The analysis
resulted in a nonsignificant effect of dose of Se, but the
curves were similar to those shown in Figure 3.
A decrease in milk Se concentration was evident at
doses of less than 3 mg/h per day; however, the effect of
dose depended on Se source and changed according to
the continent. On average, sodium selenite or selenate
was supplemented at a dose of 3.2 ± 1.6 mg/h per day
and Se yeast was supplemented at 4.3 ± 1.4 mg/h per
day in American studies, whereas studies from Oceania
supplemented 4.5 ± 2.1 mg/h per day and 6.4 ± 4.5
mg/h per day of sodium selenate or selenite and Se
yeast, respectively.
Cumulative Meta-Analysis
The random-effects cumulative meta-analysis of the
studies of oral Se supplementation and its effect on
milk Se concentration published until 2007 is presented
in Figure 4. A repeated pooled estimate and its 95% CI
after a sequential combination of the studies is displayed
in order of ascending publication date. The first point
of interest is the significant effect of Se
supplementa-tion on milk Se concentrasupplementa-tion from the first trial
pub-lished in 1977. The studies showed the least response
to Se supplementation from 1977 (Perry et al., 1977)
to the early 1990s (Syrjala Qvist and Aspila, 1993). At
that time, 336 cows had been allocated to 11 studies
to compare the effect of sodium selenite or selenate
supplementation (3.2 ± 1.3 mg/h per day) against the
effect on unsupplemented cows.
The average effect started to change gradually
to-ward a greater milk Se difference after the inclusion of
Se yeast as a Se source in the early 1990s (Charmley
et al., 1993). The results of the subsequent 31 studies,
which enrolled 631 additional cows, increased the
aver-age effect of treatment, and its 95% CI became wider.
Moreover, the dose of Se was related to publication year
and Se source. After 1993, sodium selenite or selenate
was used, on average, at a dose of 3.6 ± 1.8 mg/h per
day compared with 5.0 ± 2.8 mg/h per day when Se
yeast was supplemented.
Influential Studies
A simple sensitivity assessment was performed by
repeating the meta-analysis but excluding individual
studies one at a time (Figure 5). No individual studies
had an undue influence on the pooled estimate.
How-ever, omitting study 4 (Bis Wencel, 2003) had the
larg-est effect on the pooled larg-estimate, and in this case, the
average treatment effect decreased from 0.16 μmol/L
(95% CI: 0.117, 0.207) to 0.13 μmol/L (95% CI: 0.102,
0.148).
DISCUSSION
A meta-analysis based on the results of the 42
stud-ies meeting all selected criteria estimated an average
Table 3. Summary of 5 studies reported in 3 references not having analysis of milk Se between 30 and 170 d from supplementation
Reference Country1 n2 Parity3 Stage4 Source5 Dose, mg/d Days6 Milk Se, μmol/L differenceMean 7 Significance8
Fisher et al. (1980) US 3 NR L Na-Sel. 6.00 13 0.34 0.00 NS Fisher et al. (1980) US 3 NR L Na-Sel. 12.00 13 0.42 0.06 NS Jenkins et al. (1974) CA 8 Mult. D Na-Sel. 0.80 182 0.27 0.13 NS Jenkins et al. (1974) CA 8 Mult. D Na-Sel. 0.80 210 0.22 0.17 NS Sustala et al. (2003) CZ 4 Mult. L Yeast 10.20 21 0.56 0.37 S
1Country codes according to official short names in English as given in ISO 3166-1 and ISO 3166-1-α-2 code elements. 2
n = number of cows.
3Parity: Mult. = multiparous; All = first calving and multiparous; NR = not reported. 4
Stage of lactation when the study started: D = dry period; E = from calving to 100 DIM; L = more than 100 DIM.
5Source of Se: Na-Sel. = sodium selenite or selenate; yeast = Se yeast. 6
Days: lag time from supplementation to first milk sample collection for Se analysis.
7Mean difference = difference between means for milk Se concentration of supplemented and unsupplemented cows. 8
increase in milk Se concentration of 0.16 μmol/L in
response to oral Se supplementation (Table 5).
How-ever, results varied considerably among studies:
con-tinent, source of Se, and dose of Se were significant
contributors to this variation (Table 6). Nonetheless,
other factors such as study design, production system,
previous Se status, type of production, supplementation
protocol, duration of supplementation, and Se analysis
methodology did not have a significant effect on the
treatment response.
Two factors that might have contributed to the
varia-tion in supplementavaria-tion response were stage of lactavaria-tion
and milk yield (Table 6). However, milk yield did not
reduce the between-study variance. Although the stage
of lactation was not significantly associated with the
outcome, it explained 43% of the between-study
vari-Table 4. Summary of the 42 studies reported in 33 references used in the meta-analysis
Reference Country1 n2 Parity3 Stage4 Source5
Dose, mg/h
per day Days6 Milk Se, μmol/L differenceMean 7 Significance8
Ammerman et al. (1980) US 3 Mult. D Na-Sel. 1.26 133 0.16 0.04 NS Aspila (1991) FI 11 All L Na-Sel. 6.20 77 0.15 0.06 S Batchelor (2002) AU 8 Mult. L Yeast 2.40 45 0.82 0.60 S Bis-Wencel (2003) PL 20 Mult. E Na-Sel. 0.60 79 1.34 0.30 S Brzoska and Brzoska (2004) PL 8 Mult. E Na-Sel. 4.83 84 0.23 0.10 S Charmley et al. (1993) CA 12 All E Yeast 5.00 56 0.44 0.27 S Conrad and Moxon (1979) US 5 NR L Na-Sel. 3.03 67 0.19 0.08 NR Cuesta et al. (1993) US 21 Mult. D Na-Sel. 1.85 100 0.23 0.05 S Gierus et al. (2002) DE 10 NR E Na-Sel. 3.47 49 0.17 0.03 S Gierus et al. (2003) DE 20 Mult. D Na-Sel. 2.40 74 0.11 0.02 NS Grace et al. (1997) NZ 20 Mult. D Na-Sel. 6.00 112 0.10 0.05 S Guyot et al. (2007) BE 6 Mult. D Na-Sel. 5.84 85 0.38 0.13 S Guyot et al. (2007) BE 6 Mult. D Yeast 5.84 85 1.65 1.39 S Heard et al. (2007) AU 6 Mult. L Yeast 11.64 32 1.45 1.11 S Heard et al. (2007) AU 6 Mult. E Yeast 10.94 32 1.26 1.10 S Hemken et al. (1998) US 4 NR E Na-Sel. 3.10 70 0.65 −0.08 S Hemken et al. (1998) US 4 NR E Na-Sel. 6.30 70 0.76 0.04 S Hidiroglou and Proulx (1988) CA 6 Prim D Na-Sel. 2.70 120 0.11 0.04 S Hidiroglou et al. (1985) CA 23 Mult. D Na-Sel. 3.00 114 0.16 0.06 S Hidiroglou et al. (1987a) CA 49 All D Na-Sel. 4.00 90 0.16 0.01 NS Hidiroglou et al. (1987b) CA 10 Mult. D Na-Sel. 2.50 120 0.12 0.06 S Juniper et al. (2006) GB 20 Mult. E Na-Sel. 2.25 35 0.26 0.02 S Juniper et al. (2006) GB 20 Mult. E Yeast 4.28 35 0.51 0.27 S Knowles et al. (1999) NZ 7 NR L Na-Sel. 3.00 88 0.17 0.09 S Knowles et al. (1999) NZ 7 NR L Yeast 3.00 88 0.51 0.43 S Malbe et al. (1995) EE 4 NR L Na-Sel. 4.20 56 0.30 0.25 NR Malbe et al. (1995) EE 4 NR L Yeast 4.20 56 0.81 0.75 NR McDowell et al. (2002) US 8 Mult. D Yeast 2.10 140 0.44 0.06 S McIntosh and Royle (2002) AU 3 Mult. L Yeast 4.00 42 0.26 0.17 S Muniz-Naveiro et al. (2005) ES 12 NR L Na-Sel. 2.87 35 0.30 0.02 S Muniz-Naveiro et al. (2005) ES 12 NR L Yeast 2.84 35 0.39 0.11 S Ortman and Pehrson (1999) SE 10 All E Na-Sel. 3.00 63 0.21 0.04 S Ortman and Pehrson (1999) SE 11 All E Yeast 3.00 63 0.40 0.23 S Paschoal et al. (2007) BR 8 All L Yeast 5.00 56 0.40 0.05 S Perry et al. (1977) US 3 Mult. D Na-Sel. 2.67 144 0.14 0.04 NR Phipps et al. (2007) UK 10 Mult. L Yeast 4.95 112 0.84 0.53 S Phipps et al. (2007) UK 10 Mult. L Na-Sel. 3.22 112 0.50 0.18 S Salih et al. (1987) US 12 All D Na-Sel. 3.50 90 0.08 0.02 S Stowe et al. (1988) US 38 Mult. D Na-Sel. 2.00 67 0.26 −0.02 NS Syrjala Qvist and Aspila (1993) FI 11 All L Na-Sel. 4.07 109 0.17 0.07 NR Waldron et al. (2004) US 10 Mult. L Na-Sel. 7.50 42 0.11 0.03 S Wiewiora et al. (2003) PL 8 Mult. E Na-Sel. 2.10 83 0.07 0.02 S
1Country codes according to official short names in English as given in ISO 3166-1 and ISO 3166-1-α-2 code elements. 2
n = number of cows.
3Parity: Prim = primiparous; Mult. = multiparous; All = first calving and multiparous; NR = not reported. 4
Stage of lactation when the study started: D = dry period; E = from calving to 100 DIM; L = more than 100 DIM.
5Source of Se: Na-Sel. = sodium selenite or selenate; yeast = Se yeast. 6
Days: lag time from supplementation to first milk sample collection for Se analysis.
7Mean difference: difference between means for milk Se concentration of supplemented and unsupplemented cows. 8
ance. Milk yield was not reported in all studies, and its
effect was evaluated by using the results of 11 studies.
A recent study found that milk Se concentration was
associated with stage of lactation, where early-lactation
cows had lower milk Se concentration than did
late-lactation cows and where that effect was likely
medi-ated by a simple dilution effect of milk yield (Wichtel
et al., 2004).
A critical examination for the presence of
publica-tion bias, or other bias types, is an integral part of
the meta-analysis process (Egger et al., 1997). In this
case, visual assessment (Figure 2) indicated weak
evi-dence of the presence of publication bias, but Egger’s
test was not significant and the trim-and-fill test did
not impute any study. The asymmetry observed in the
funnel plot might be an indication of the inclusion of
studies of poorer quality (e.g., poor methodological
design of small studies). On average, smaller studies
are conducted and analyzed with less methodological
rigor than are larger studies (Egger et al., 1997). The
effect of small studies on the assessment of publication
bias has not gone unnoticed, and a significant
exaggera-tion of the treatment response has been observed when
results of poorer quality trials have been pooled (Moher
et al., 1998). In this meta-analysis, the fact of whether
the experimental units were randomly allocated to
groups was weakly associated with the study outcome.
The effect of Se supplementation on milk Se
concentra-tion tended to be smaller when cows were randomly
allocated to the experimental groups (β = −0.12,
P
=
0.146), supporting the contention that smaller studies
tend to overestimate the effect of the treatment (Egger
et al., 1997; Moher, et al., 1998). However, the average
effect was not modified, regardless of whether the study
was published in a peer-reviewed journal, which might
reflect a better quality of study.
With regard to the meta-regression analysis, in the
univariate analysis, supplementation with Se yeast
resulted in a greater milk Se concentration compared
with supplementation with sodium selenite or selenate.
Studies in which Se yeast was used tended to
supple-ment at greater doses than did studies in which
inor-ganic sources were administered, and studies performed
in Oceania used even greater doses of both sources than
did studies performed in America or Europe. This is an
indication that Se source might be affected by
conti-nent (i.e., confounding effect), because these variable
was also related to milk Se concentration.
A lack of effect on predicted milk Se concentration
was observed when less than 3 mg/h per day was
given (Figure 3), which might be related to individual
responses that caused a high variability in milk Se
concentration across studies. Weiss (2005) described a
linear relationship of Se dose to milk Se concentration,
with the latter not changing greatly as intake of
inor-ganic sources increased. Based on this linear regression,
a change in Se intake from 2 to 5 mg/h per day when
inorganic sources were supplemented would result in
an increase in milk Se concentration of 0.06 μmol/L,
but this association was not controlled for potential
confounders. A low positive increase in milk Se
con-centration was also observed in a trial performed in
England, in which incremental doses of inorganic Se
were given (Givens et al., 2004). In contrast, the
meta-regression in this study showed that an increase from 2
to 5 mg/h per day in Se intake when inorganic Se was
fed would cause a decrease in milk Se concentration of
0.04 μmol/L, and the magnitude and direction of that
change were related to continent and Se dose, as shown
in Table 7 and Figure 3.
Particular characteristics of soils, forages, and cattle
production in America and Europe compared with
Oceania and characteristics of Se yeast may account
for the different strategies used in the design of
tri-als on Se supplementation, hence the suggestion that
continent, source, and dose were associated and acted
as potential confounders. It has been recognized that
Australia, and New Zealand in particular, where cattle
Table 5. Average effect of oral Se supplementation on milk Se concentration obtained after removing the
studies that did not report the SD or after adjusting the overall variance by the variance inflation factor (VIF)1
Item n 2
T 95% CI τ2
Actual estimate 42 0.162 0.117, 0.207 0.0192 SD reported 35 0.163 0.114, 0.211 0.0192 Adjusting by VIF3
ρ = 0.90 42 0.161 0.116, 0.206 0.0185
ρ = 0.75 42 0.161 0.116, 0.206 0.0186
ρ = 0.25 42 0.162 0.117, 0.207 0.0190
1Table presents the average effect (
T), 95% confidence interval (95% CI), and method-of-moments estimator of the between-study variance (τ2).
2Number of studies. 3
production is pasture based, have Se-deficient soils
because of low pH and rainfall (Australia) or volcanic
parent material (New Zealand), and both countries are
acknowledged as pioneers in Se research in livestock
(Oldfield, 2002). Factors such as the recognition of
deficiency (Oldfield, 2002); previous data on low milk
Se concentration from Australia (Heard et al., 2004),
England (Givens et al., 2004), Estonia (Pehrson et al.,
Figure 1. Forest plot of the effect of oral Se supplementation on milk Se concentration (μmol/L) difference in cattle. The average estimate of
1997), New Zealand (Grace et al., 1997; Knowles et
al., 1999), Nordic countries (Ekholm et al., 1991), and
North America (Maus et al., 1980); and the small
con-tribution of livestock-derived food products to the Se
intake of humans from several countries (Combs, 2001)
might be related to the choice of different doses for Se
supplementation trials, where the objective was to
en-hance the Se status in animals and the intake of Se for
consumers. Thus, Australian reports have described the
use of supranutritional doses of Se yeast in an attempt
to increase the content of Se in milk (Heard et al.,
2004, 2007), whereas American studies have been
car-ried out to adjust them to lower Se intakes, reflecting
NRC (2001) recommendations. Moreover, Se intake is
legally restricted in North America but not in Oceania,
and this may affect the choice for greater doses.
The biological properties of Se yeast may also
ac-count for the observed response in milk Se
concentra-tion. Recently, a narrative review suggested that Se
concentration was increased by 90% when cattle were
Figure 2. Funnel plot of the point estimates of the effect of oral Se supplementation on the difference of milk Se concentration (μmol/L) in cattle.
Table 6. Univariable meta-regression based on 42 studies of Se supplementation in cattle1
Factor β 95% CI P τ2
Null model 0.162 0.083, 0.241 <0.01 0.019 Random allocation −0.115 −0.276, 0.045 0.15 0.019
Continent <0.01 0.019
America2 Baseline
Europe 0.100 −0.051, 0.253 0.19
Oceania3 0.379 0.167, 0.591 <0.01
Stage of lactation 0.13 0.011
Dry period4 Baseline
Early lactation (<100 DIM) 0.133 −0.047, 0.314 0.14 Late lactation (>100 DIM) 0.168 −0.004, 0.339 0.06
Milk yield (n = 95) −0.035 −0.094, 0.025 0.213 0.038
Source 0.027
Sodium selenite or selenate Baseline
Se yeast 0.333 0.190, 0.476 <0.01
Dose −0.102 −0.179, −0.026 0.01 0.005
Quadratic term 0.015 0.008, 0.021 <0.01
Days −0.002 −0.005, 0.000 0.08 0.019
1
Table presents coefficients (β), 95% confidence interval (95% CI), P-values, and the method-of-moments esti-mator of the between-study variance (τ2).
2
Canada, the United States, and Brazil.
3Australia and New Zealand. 4
Dry period corresponds to beginning Se supplementation before calving.
5Milk production was reported in only 9 studies.
Figure 3. Effect of the dose of Se (mg/h per day) on milk Se
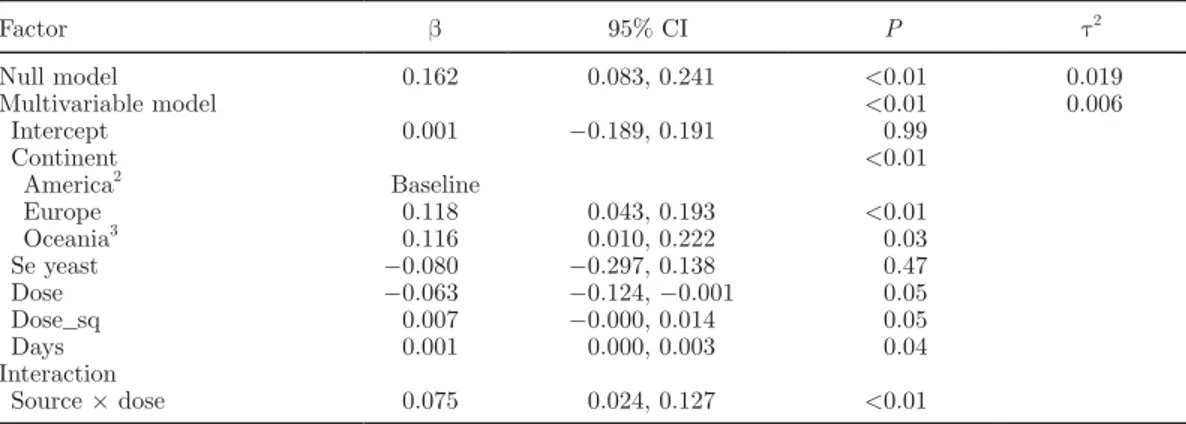
Table 7. Multivariable meta-regression based on 42 studies of Se supplementation in cattle
Factor β 95% CI P τ2
Null model 0.162 0.083, 0.241 <0.01 0.019
Multivariable model <0.01 0.006
Intercept 0.001 −0.189, 0.191 0.99
Continent <0.01
America2 Baseline
Europe 0.118 0.043, 0.193 <0.01 Oceania3 0.116 0.010, 0.222 0.03
Se yeast −0.080 −0.297, 0.138 0.47 Dose −0.063 −0.124, −0.001 0.05 Dose_sq 0.007 −0.000, 0.014 0.05
Days 0.001 0.000, 0.003 0.04
Interaction
Source × dose 0.075 0.024, 0.127 <0.01
1
Table presents coefficients (β), 95% confidence interval (95% CI), P-values, and the method-of-moments esti-mator of the between-study variance (τ2).
2
Canada, the United States, and Brazil.
3Australia and New Zealand.
Figure 4. Cumulative meta-analysis of 42 studies of the effect of Se supplementation on milk Se concentration (μmol/L) difference in cattle,
fed Se yeast compared with an inorganic source (Weiss,
2005). Selenium yeast is a dried nonviable yeast (
Sac-charomyces cerevisiae
) product. The yeast is cultivated
by using a fed-batch fermentation process that provides
incremental amounts of Se salts, minimizing the
det-rimental effects of Se salts on the yeast. This allows
for the optimal incorporation of inorganic Se into
cellular organic material, acquiring properties similar
to natural Se sources (Weiss, 2005). Organic Se yeast
contains a variety of Se proteins, mainly
selenomethio-nine (Se-Met), and other low molecular weight
seleno-compounds. Even though little information is available
concerning Se yeast metabolism in ruminants, it
ap-pears that Se coming from Se yeast is probably better
absorbed than inorganic forms of Se (Weiss, 2005).
In vitro studies found a better diffusibility of Se-Met,
which contributes to its high absorption in vivo (Shen
et al., 1997). Moreover, Se yeast is better transferred
to milk than are inorganic Se sources (Knowles et al.,
1999; Pehrson, 2005; Juniper et al., 2006), probably
because of the AA composition of milk proteins. Milk
has a Met concentration approximately 2 times greater
than blood protein. Therefore, it is 2 times more likely
that Se-Met will be incorporated into milk protein than
blood protein (Weiss, 2005).
The recommended dietary intake of Se for humans
depends on sex and age but, on average, a daily intake
between 26 and 55 μg meets the requirement for adults.
This intake must be greater in pregnant or lactating
women (Institute of Medicine, 2000; World Health
Or-ganization/Food and Agriculture Organization of the
United Nations, 2004). According to the
meta-regres-sion analysis, to provide at least 10% of the minimum
recommended dietary intake for Se when 100 mL of
Figure 5. Influence plot of 42 studies of the effect of Se supplementation on milk Se concentration (μmol/L) difference in cattle. The figure
milk will be consumed daily, cows in America should
be fed at least 11 mg of sodium selenite or selenate/h
per day or 6 mg of Se yeast/h per day to comply with
the suggestions of the Institute of Medicine (2000) and
World Health Organization/Food and Agriculture
Or-ganization of the United Nations (2004) for Se daily
intake.
The pattern observed after the cumulative
meta-analysis (Figure 4), which was the change toward a
greater effect, might have been the result of a
combina-tion of several factors, such as an improvement in study
designs (i.e., use of more powerful statistical analysis);
amendment to allowable Se supplementation in the
United States in 1987, which allowed 0.3 mg/kg (on a
DM basis) of supplemental Se to be added to ruminant
diets (Ullrey, 1992); the marketing of Se yeast, which
began in the early 1990s; and approval for its use in
cattle in 2003 (US Food and Drug Administration,
2003). However, the effect of source across years might
have been confounded by other factors (e.g., previous
Se status, age of the cow, stage of lactation) that did
not show any significant association with milk Se
con-centration in this study.
The average effect decreased slightly after the
re-moval of study 4 (Bis Wencel, 2003). The effect
de-creased by 18% but remained positive (Figure 5). That
particular study was performed in Europe (Poland) and
used sodium selenate as the Se source (0.6 mg/h per
day). A large increase in milk Se concentration was
found in supplemented cows (0.30 μmol/L) compared
with unsupplemented ones. The study had a relatively
large sample size (n = 20 cows), and the precision of
the estimate was high (SE: 0.001 μmol/L), which is an
indication of a strong influence on the average effect of
treatment. However, this study was neither blinded nor
were cows randomly allocated to treatments, and the
cows in the unsupplemented group had a greater milk
Se concentration than cows from other trials. In spite
of having a high milk Se concentration, the cows in this
trial responded favorably to low Se supplementation
with inorganic Se.
CONCLUSIONS
On average, an increase of 0.16 μmol/L in milk Se
concentration might be expected after oral Se
supple-mentation in cattle, and an effect on milk Se
concentra-tion between −0.17 and 0.50 μmol/L (95% certainty)
might be expected in future clinical trials conducted
to evaluate the effect of oral Se supplementation on
milk Se concentration. High variation among studies
was observed, in part because of geographic factors and
some characteristics related to study design (e.g., stage
of lactation, Se source, dose of Se). There was weak
evidence of publication bias. The effect of the dose of
Se was unexpectedly low when Se was given to cows
at a dose of less than 3 mg/h per day. However, other
studies reporting a linear relationship did not account
for potential confounders (i.e., source of Se). Greater
doses of Se (i.e., organic forms) are required to achieve
an adequate milk Se concentration for human
consump-tion according to the country where the study will be
performed. It has been suggested that seleno-AA from
Se yeast are metabolized by mechanisms distinct from
those of inorganic forms and may be the form of choice
for enhancing milk Se concentration. The challenge is
to tailor the Se form and supplementation protocols to
meet animal dietary requirements and to benefit
con-sumers of dairy products.
REFERENCES
Acevedo-Maldonado, N., P. F. Randel, and E. O. Riquelme. 1999. Supplementation of selenium in dairy cows using ruminal bolus or injections. J. Agric. Univ. Puerto Rico. 83:223–228.
Ammerman, C. B., H. L. Chapman, G. W. Bouwman, J. P. Fontenot, C. P. Bagley, and A. L. Moxon. 1980. Effect of supplemental selenium for beef cows on the performance and tissue selenium concentrations of cows and suckling calves. J. Anim. Sci. 51:1381– 1386.
Aspila, P. 1991. Metabolism of selenite, selenomethionine and feed-incorporated selenium in lactating goats and dairy cows. J. Agric. Sci. Finl. 63:1–74.
Awadeh, F. T., R. L. Kincaid, and K. A. Johnson. 1998. Effect of level and source of dietary selenium on concentrations of thyroid hormones and immunoglobulins in beef cows and calves. J. Anim. Sci. 76:1204–1215.
Barthelmy, D. 2005. Selenium. http://webmineral.com/data/Selenium. shtml. Accessed May 26, 2008.
Batchelor, J. 2002. Supplementing selenium to pasture-based dairy cows. Sel-Plex 136. Alltech Inc., Nicholasville, KY.
Binnerts, W. T., J. Rijken, and T. C. Viets. 1984. The selenium content in milk as an indicator of the selenium status of cows. Pages 129– 137 in Trace Element—Analytical Chemistry in Medicine and Biology. P. Bratter, and P. Schramel, ed. Walter de Gruyter and Co., Berlin, Germany.
Bis Wencel, H. 2003. Mineral elements level in milk of the cows with mineral dietary supplementation. Ann. U. Mariae Curie-Sklodowska Sec. EE 21:259–264.
Brzoska, F. 2004. Effect of calcium salts of fatty acids and selenium on cows’ milk yield and composition. Ann. Anim. Sci. 4:69–78. Brzoska, F., and B. Brzoska. 2004. Effect of dietary selenium on milk
yield of cows and chemical composition of milk and blood. Ann. Anim. Sci. 4:57–67.
Carver, J. D. 2003. Advances in nutritional modifications of infant formulas. Am. J. Clin. Nutr. 77(Suppl.):1550S–1554S.
Charlton, P. 1995. Sel-PlexTM supplementation increases glutathione peroxidase activity in dairy cows: Field results from Britain. Sel-Plex 025. Alltech Inc., Nicholasville, KY.
Charmley, E., J. W. G. Nicholson, and J. A. Zee. 1993. Effect of supplemental vitamin E and selenium in the diet on vitamin E and selenium levels and control of oxidized flavor in milk from Holstein cows. Can. J. Anim. Sci. 73:453–457.
Coe, P. H., J. Maas, J. Reynolds, and I. Gardner. 1993. Randomized field trial to determine the effects of oral selenium supplementation on milk production and reproductive performance of Holstein heifers. J. Am. Vet. Med. Assoc. 202:875–881.
Conrad, H. R., and A. L. Moxon. 1979. Transfer of dietary selenium to milk. J. Dairy Sci. 62:404–411.
Conrad, H. R., and A. L. Moxon. 1980. Selenium requirements for dairy cows. Ohio Rep. Res. Dev. 65:8–9.
Cuesta, P. A. 1992. Effect of supplemental selenium and vitamin E on serum and milk concentrations of cattle and sheep, tissue selenium concentrations and mineral status of grazing cattle in North Florida. PhD Thesis. Univ. Florida, Gainesville, FL.
Cuesta, P. A., L. R. McDowell, W. E. Kunkle, F. Bullock, A. Drew, N. S. Wilkinson, and F. G. Martin. 1993. Serum selenium and vitamin E, and selenium concentration in liver, milk and hair as affected by supplementation to beef cattle. Int. J. Anim. Sci. 8:257–262. Cuesta, P. A., L. R. McDowell, W. E. Kunkle, N. S. Wilkinson, and F.
G. Martin. 1994. Effects of high doses of selenium and vitamin E injected into cows prepartum on milk and serum concentrations of these nutrients. Int. J. Anim. Sci. 9:275–278.
Culleton, N., P. Parle, J. Murphy, and P. Rodgers. 1993. Selenium supplementation of dairy cows. Vet. Surg. 15:20–22.
Culleton, N., P. J. Parle, P. A. Rogers, W. E. Murphy, and J. Murphy. 1997. Selenium supplementation for dairy cows. Ir. J. Agric. Food Res. 36:23–29.
De Toledo, L. R. A., and T. W. Perry. 1985. Distribution of supplemental selenium in the serum, hair, colostrum, and fetus of parturient dairy cows. J. Dairy Sci. 68:3249–3254.
Deeks, J. J., D. G. Altman, and M. J. Bradburn. 2001. Statistical methods for examining heterogeneity and combining results from several studies in meta-analysis. Pages 285–312 in Systematic Reviews in Health Care: Meta-analysis in Context. M. Egger, G. D. Smith, and D. G. Altman, ed. BMJ Books, London, UK. Dell, W. J. 1974. Factors affecting the incidence of autoxidized milk.
PhD Thesis. Univ. Georgia, Athens.
DerSimonian, R., and N. Laird. 1986. Meta-analysis in clinical trials. Control. Clin. Trials 7:177–188.
Diaz, D. E., M. Casagrandi, A. Tampieri, L. Piccinni, and P. Geliot. 2005. Increases in milk selenium concentrations and decreases in somatic cell counts in dairy cattle consuming Sel-PlexTM. Alltech
Inc., Nicholasville, KY.
Dohoo, I., W. Martin, and H. Stryhn. 2003. Veterinary Epidemiologic Research. AVC Inc., Charlottetown, PEI, Canada.
Duval, S., and R. Tweedie. 2000. A nonparametric “trim and fill” method of accounting for publication bias in meta-analysis. J. Am. Stat. Assoc. 95:89–98.
Egger, M., G. D. Smith, and K. O’Rourke. 2001. Rationale, potential, and promise of systematic reviews. Pages 3–19 in Systematic Reviews in Health Care: Meta-analysis in Context. M. Egger, G. D. Smith, and D. G. Altman, ed. BMJ Books, London, UK. Egger, M., G. D. Smith, M. Schneider, and C. Minder. 1997. Bias in
meta-analysis detected by a simple, graphical test. BMJ 315:629– 634.
Ekholm, P. I., M. E. Ylinen, M. H. Eurola, P. E. Koivistoinen, and P. T. Varo. 1991. Effects of general soil fertilization with sodium selenate in Finland on the selenium content of milk, cheese and eggs. Milchwissenschaft 46:547–550.
Enjalbert, F., P. Lebreton, O. Salat, and F. Schelcher. 1999. Effects of pre- or postpartum selenium supplementation on selenium status in beef cows and their calves. J. Anim. Sci. 77:223–229.
Essick, L. A., and D. J. Lisk. 1987. Selenium in milk of dairy cows fed the newly legalized 0.3 ppm selenium-supplemented diet. J. Food Saf. 8:255–259.
Eversole, D. E., W. S. Swecker Jr., C. D. Thatcher, D. J. Blodgett, and G. G. Schurig. 1992. Selenium supplementation increases colostral IgG in beef cows. Virginia Tech. Livest. Res. Rep. 10:76–77. Falkowska, A., D. Minakowski, and J. Tywonczuk. 2000. The effect of
supplementing rations with selenium and vitamin E on biochemical parameters in blood and performance of cows in the early stage of lactation. J. Anim. Feed Sci. 9:271–282.
Fan, Y. K., I. T. Lin, and H. I. Chang. 2006. Effect of preparturient intramuscular injection of vitamin E and selenium on milk somatic cell counts in Holstein cows. J. Anim. Sci. 84(Suppl. 1):398–399. Fisher, D. D. 1995. Comparative effects of inorganic and organic
selenium sources (selenium yeast) on selenium status of lactating
cows. Pages 271–281 in Biotechnology in the Feed Industry: Proceedings of Alltech’s 11th Annu. Symp. T. P. Lyons, and K. A. Jacques, ed. Nottingham Univ. Press, Nottingham, UK.
Fisher, D. D., S. W. Saxton, R. D. Elliot, and J. M. Beatty. 1995. Effects of selenium source on Se status of lactating cows. Vet. Clin. Nutr. 2:68–74.
Fisher, L. J., C. Hoogendoorn, and J. Montemurro. 1980. The effect of added dietary selenium on the selenium content of milk, urine and feces. Can. J. Anim. Sci. 60:79–86.
Foltys, V., R. Bobcek, K. Kirchnerova, and I. Straka. 2004. Effect of Sel-PlexTM supplementation on milk selenium and somatic cell counts in a commercial dairy herd. Sel-Plex 317. Alltech Inc., Nicholasville, KY.
US Food and Drug Administration. 2003. Food additives permitted in feed and drinking water of animals: Selenium yeast. Fed. Regist. 68:52339–52340.
Fraser, A. J., T. J. Ryan, R. Sproule, R. G. Clark, D. Anderson, and E. O. Pederson. 1987. The effect of selenium supplementation on milk production in dairy cattle. Proc. N. Z. Soc. An. 47:61–64.
Furukawa, T. A., C. Barbui, A. Cipriani, P. Brambilla, and N. Watanabe. 2006. Imputing missing standard deviations in meta-analyses can provide accurate results. J. Clin. Epidemiol. 59:7– 10.
Gierus, M. 2007. Organic and inorganic sources of selenium in the nutrition of dairy cows: Digestion, absorption, metabolism and requirements. Cienc. Rural 37:1212–1220.
Gierus, M., F. J. Schwarz, and M. Kirchgessner. 2002. Selenium supplementation and selenium status of dairy cows fed diets based on grass, grass silage or maize silage. J. Anim. Physiol. Anim. Nutr. (Berl.) 86:74–82.
Gierus, M., F. J. Schwarz, and M. Kirchgessner. 2003. Investigation on selenium supplementation for dairy cows in late pregnancy. Zuchtungskunde 75:88–100.
Givens, D. I., R. Allison, B. Cottrill, and J. S. Blake. 2004. Enhancing the selenium content of bovine milk through alteration of the form and concentration of selenium in the diet of the dairy cow. J. Sci. Food Agric. 84:811–817.
Goff, D. 2008. Dairy chemistry and physics. http://www.foodsci. uoguelph.ca/dairyedu/chem.html Accessed May 26, 2008.
Grace, N. D., K. L. Ankenbauer-Perkins, A. M. Alexander, and R. M. Marchant. 2001. Relationship between blood selenium concentration or glutathione peroxidase activity, and milk selenium concentrations in New Zealand dairy cows. N. Z. Vet. J. 49:24–28.
Grace, N. D., J. Lee, R. A. Mills, and A. F. Death. 1997. Influence of Se status on milk Se concentrations in dairy cows. N. Z. J. Agric. Res. 40:75–78.
Grundler, M. 1999. Sel-PlexTM outperforms inorganic selenium in
German dairy cattle and nursing calves. Sel-Plex 020. Alltech Inc., Nicholasville, KY.
Guyot, H., and F. Rollin. 2007. Diagnosis of selenium and iodine deficiencies in bovines. Ann. Med. Vet. 151:166–191.
Guyot, H., P. Spring, S. Andrieu, and F. Rollin. 2007. Comparative responses to sodium selenite and organic selenium supplements in Belgian Blue cows and calves. Livest. Sci. 111:259–263.
Harris, R. J., M. J. Bradburn, J. J. Deeks, R. M. Harbord, D. G. Altman, and J. A. C. Sterne. 2008. metan: Fixed- and random-effects meta-analysis. Stata J. 8:3–28.
Harrison, G. A., and S. A. Elliot. 2006. Influence of Sel-PlexTM supplementation on milk production, composition, and somatic cell count of lactating dairy cows in commercial dairy herds in Canada. 1. Whole herd responses. Sel-Plex 514. Alltech Inc., Lexington, KY.
Harrison, G. A., J. M. Tricarico, and S. A. Elliot. 2005a. Effect of Sel-PlexTM supplementation to lactating cows on blood and milk selenium levels in a commercial dairy herd in the southeastern US. Sel-Plex 409. Alltech Inc., Nicholasville, KY.