UNIVERSIDAD DE VALLADOLID
ESCUELA DE INGENIERIAS INDUSTRIALES
Máster en Ingeniería Industrial
Iron-based catalysts for selective
hydrogenation of 1,3-butadiene
Autor:
Santander de Soto, Laura
Responsable de Intercambio en la Uva:
Alfonso Redondo Castán
Sorbonne Université
(UPMC)
TFM REALIZADO EN PROGRAMA DE INTERCAMBIO
TÍTULO:
Iron-based catalysts for selective hydrogenation of
1,3-butadiene
ALUMNO: Laura Santander de Soto
FECHA:
20 de Julio de 2018
ABSTRACT
Hoy en día, una gran mayoría de lo que nos rodea se ha fabricado a partir de polímeros obtenidos mediante la reacción de polimerización de pequeñas repetitivas subunidades (monómeros). Los monómeros más empleados en la industria son los alquenos ligeros. Sin embargo, su método de obtención da lugar a algunas impurezas (alquinos y alcadienos) que provocan la contaminación del catalizador. El objetivo de este estudio ha sido encontrar un catalizador adecuado para la hidrogenación selectiva del 1,3-butadieno ya que este proceso es una alternativa para conseguir purificar las corrientes de alquenos. Para ello, se han llevado a cabo dos métodos de preparación: “Chemical Reduction” y “Deposition-precipitation with urea”. Además, distintas técnicas de caracterización tales como XRD, XRF, TEM-EDX, TPR, BET.. se han utilizado para conocer la estructura, composición y morfología de los materiales. Por último, los catalizadores basados en hierro fueron sometidos a análisis catalíticos en la reacción de hidrogenación selectiva de 1,3-butadieno con el fin de comprobar su actividad catalítica, selectividad y estabilidad. El material que presentó mejor comportamiento fue Fe-Zn 1:5/TiO2.
KEYWORDS
Iron-based catalysts for selective hydrogenation
of 1,3-butadiene
Laura Santander de Soto
Master thesis submitted within an Erasmus programme +
Supervisor: Dr. Laurent Delannoy
Laboratory of Surface Reactivity
Chair: Prof. Dr. Hélène Pernot
Faculty of Chemistry
Acknowledgements
After almost 6 months far from my home working on my Master thesis, I can undoubtedly affirm that it has been a long and not easy way but very gratifying. This great experience has helped me to grow up as person, to be more independent, to value how lucky we are, to appreciate much more each person around me and to be more aware that every effort has a reward.
This had never been possible without some collaborations. Thank University of Valladolid for having entrusted me and, also, thank Sorbonne University for giving me the chance to study here.
I would like to express my gratitude to Prof. Hélène Pernot, director of Laboratory of Surface Reactivity for bringing me the opportunity to carry out my master thesis in this laboratory. I am also very grateful to my supervisor Dr. Laurent Delannoy for his patience, his time and his dedication teaching and helping me and for trusting me at the fist moment that I applied for this internship. And I would like to thank Sandra Casale for the TEM measurements and Dr. Juliette Blanchard for their assistance with N2
-physisorption.
I am thankful to all the people in LRS, especially to my friends and office mates for accompanying me during this period.
Table of Contents
CHAPTER 1 INTRODUCTION ...1
CHAPTER 2 LITERATURE SURVEY ...2
2.1 INTRODUCTION ...2
2.1.1 Main application ...2
2.1.2 Drawback and solution ...2
2.1.3 Purpose ...3
2.2 RAW MATERIALS ...3
2.2.1 Iron based catalysts ...3
2.2.2 Bimetallic Fe nanoparticles ...4
2.2.3 Support ...5
2.3 SYNTHESIS STRATEGY ...6
2.3.1 Deposition-precipitation with urea (DPu) ...7
2.3.2 Chemical Reduction ...9
2.4 SELECTIVE HYDROGENATION OF 1,3-BUTADIENE ... 10
2.4.1 Hydrogenation of 1,3-butadiene ... 10
2.4.2 Selective hydrogenation of 1,3-butadiene in the excess of propene ... 12
CHAPTER 3 MATERIAL AND METHODS ... 13
3.1 MATERIAL SYNTHESIS ... 13
3.1.1 Deposition-precipitation with urea (DPu) ... 13
3.1.2 Chemical reduction... 13
3.2 THERMAL TREATMENT ... 14
3.3 MATERIAL CHARACTERIZATION TECHNIQUES... 15
3.3.1 X-Ray Diffraction (XRD) analysis ... 15
3.3.2 X-Ray Fluorescence (XRF) analysis. ... 16
3.3.3 N2-adsorption analysis. Brunauer–Emmett–Teller (BET). ... 16
3.3.4 Transmission Electron Microscopy (TEM) ... 16
3.3.5 Temperature Programmed Reduction (TPR) ... 17
3.4 CATALYTIC TEST AND PERFORMANCE ... 17
CHAPTER 4 RESULTS ... 19
4.1 CHARACTERIZATION ... 19
4.1.1 X-Ray fluorescence (XRF) ... 19
4.1.3 X-Ray Diffraction (XRD) ... 24
4.1.4 Transmission Electron Microscopy (TEM) ... 29
4.2 CATALYTIC PERFORMANCE ... 35
4.2.1 Monometallic Fe/TiO2 comparison ... 35
4.2.2 Comparison between samples prepared by DPu ... 37
4.2.3 Comparison between samples prepared by Chemical Reduction ... 39
CHAPTER 5 CONCLUSION ... 42
APPENDICES ... 43
REFERENCES ... 45
1
In the recent days, a high percent of all we are surrounded is made of polymers which are composed of many repeated subunits, i.e. the monomers. These monomers are used as raw materials in the catalytic polymerization reactions, in particular, light alkenes are employed as reagents for polymer synthesis in industry. However, steam reforming processes, which produce these monomers, lead to the formation of a few percent of alkadienes and/or alkynes as impurities which can easily poison the catalysts employed for polymerization reactions.
On the other hand, the selective hydrogenation has been the most applied method for decreasing the amount of dienes and alkynes contaminants. Supported metals catalysts are designed in order to avoid total hydrogenation of the main alkene stream. Therefore, the ideal catalyst for this reaction should be active (alkynes and dienes conversion), selective (no overhydrogenation) and stable.
Palladium has been the most used metal in the industry for gas and liquid-phase selective alkynes and/or alkadienes hydrogenation. It presents high activity but tends to absorb hydrogenation and could form hydrides leading to selectivity reduction. Iron is increasingly gaining interest owing to its low toxicity and its abundance on Earth. In fact, recently, iron has been the centre of renewed interest because of its ability to catalyse alkenes, carbonyls, imines or carbonates hydrogenation. Moreover, bimetallic nanoparticles reveal unique properties since they could exceed those of the separated metal components. Using DFT calculations, it has been demonstrated that Fe-Zn alloys can turn out being a promising system for the selective hydrogenation of polyunsaturated hydrocarbons.
Moreover, though some studies evinced no influence of the oxide support nature on the activity and selectivity during the selective hydrogenation indicating that the reaction only takes place on the metal particles, the requirements of the support are stability during sample preparation and no catalytic activity for selective hydrogenation. TiO2 -support is selected as the main one because of its stability in
solution.
Two preparation methods, Deposition precipitation with urea and Chemical Reduction, are studied to synthesize the catalysts used for selective hydrogenation of 1,3-butadiene in the gas phase as a model reaction. The samples obtained by these two methods are characterized by several physico-chemical techniques, noticeably in order to estimate the degree of interaction between the two metals, Fe and Zn.
2
The literature study mainly focusses on the purpose of alkene stream purification process through selective hydrogenation reaction. It discusses the use of supported mono- and bimetallic catalysts as well as different synthesis strategies. The selective hydrogenation of 1,3-butadiene as model reaction is the major focus.
2.1.
INTRODUCTION
2.1.1.
Main application
In the recent days, a high percent of all we are surrounded is made of polymers such as synthetic fabric, furniture, plastic containers, shell of most electronic products…[1] The term polymer derives from the ancient Greek words: polus, meaning `many,such´, and meros meaning `parts´ and refers to a large molecule whose structure is composed of many repeated subunits i.e., the monomers. These monomers are used as raw materials in the catalytic polymerization reactions leading to organic products known as polymers. Unsaturated hydrocarbons, and especially light alkenes like ethylene, propylene, but-1- and -2-enes, isobutenes, etc., are widely selected as reagents for polymer synthesis in industry [2],[3]. The demand of these raw alkenes in industry has increased exponentially. For instance, the requirement of propylene was only 47 million tons in 1998 and the value predicted for 2020 is around 160 million tons and, in the case of the largest basic chemical building blocks, ethylene, was only 80.5 million tons in 1998, approximately 175 in 2015 and for 2020 is above 200 million tons [4].
2.1.2.
Drawback and solution
The main production method of unsaturated hydrocarbons is cracking of petroleum hydrocarbons including heavy liquid fractions i.e., crude oil [5]. However, steam reforming processes take place at high temperature which results in the formation of a few percent of alkadienes and/or alkynes as impurities, i.e. 0.3 to 6.0% of residual butadiene in butenes, 0.5 to 3% of acetylene in ethylene and 2 to 8% of propyne and propadiene in propene [6], [7]. These impurities contained into the alkene cuts can easily poison the catalysts employed for polymerization reactions [2]. An example is illustrated by B.J.Burger et al. when 2-butyne impurity altercates the catalyst during 2-butene polymerization [8]. Thus, to avoid catalyst poisoning, impurity level must be controlled and not exceeded 10 ppm [9]. In essence, there are three alternatives to eliminate or reduce the alkynes and dienes impurities:
i. Remove them by fractional distillation: uneconomic method, high energy consumption [10].
3
ii. Extract them from alkene stream by solvent extraction or metal-organic frameworks (MOF) adsorption [10].
iii. Convert them into useful products by selective catalytic hydrogenation which is the focus of this report [10].
2.1.3.
Purpose
The selective hydrogenation is the most applied method for decreasing the amount of dienes and alkynes contaminants. Moreover, it is an important industrial process for the production of high purity alkene stream for further polymerization reactions [9]. In fact, the key issue of this purification process is to avoid total hydrogenation of the main alkene stream. For that purpose, supported metals catalysts are designed in order to achieve semi-hydrogenation of alkynes and dienes into alkenes without any oligomers and alkanes formation. Therefore, the ideal catalyst for this reaction should present high activity (satisfying low activation barrier for alkynes/dienes conversion), high selectivity (no overhydrogenation favouring limited alkanes generation) and high stability (avoiding oligomers formation through C-C coupling since they lead to catalyst deactivation by means of fouling) [11]. In addition, impurities conversion should be performed at a temperature as low as possible [2] and, from an industrial point of view, low price and easy preparation and regeneration also play a relevant role [12].
2.2.
RAW MATERIALS
2.2.1.
Iron based catalysts
Over the last years, palladium has been the most used metal in the industry for gas and liquid-phase selective alkynes and/or alkadienes hydrogenation because of its high activity which is, in turn, due to its low H2 dissociation barrier [13]. Besides, it is selective when concentration of impurity is still high
[5]. Nevertheless, Pd also has some disadvantages such as: its tendency to absorb hydrogen and form hydrides leading to selectivity reduction by formation of alkanes, and its trend to favour oligomerization and green oil formation on its surface diminishing catalytic stability [13]. As a result, for ultimate purification and elimination of alkadienes or alkynes traces, i.e., at high conversion, Pd catalysts are not selective enough. Furthermore, other drawbacks are its high metal cost, around 1000 dollars per kg [13] and the foreseen shortage of noble metals in the near future[14].
4
catalysts are of a large interest owing to their low toxicity and the abundance of iron on Earth. Besides, taking also into account that nanometric-sized catalysts exhibit potential behaviour in catalysis due to the high ratio of surface atoms, iron-based NPs have been mostly used for different applications such as Fischer-Tropsch reaction, carbon nanotubes synthesis and biomedical applications [15]. Recently, iron has emerged at the centre of renewed interest in both homogeneous and heterogeneous hydrogenations. Iron-based materials can catalyse alkenes, carbonyls, imines or carbonates hydrogenation in addition to the selective hydrogenation of alkynes to alkenes which is, in fact, the purpose of this research [16]. For instance, an Al13Fe4 intermetallic compound showed high activity in
butadiene partial hydrogenation with high selectivity to butenes at room temperature [14]. For that reason, it seems that iron nanoparticles can be a promising catalyst for selective hydrogenation of polyunsaturated hydrocarbons.
2.2.2.
Bimetallic Fe nanoparticles
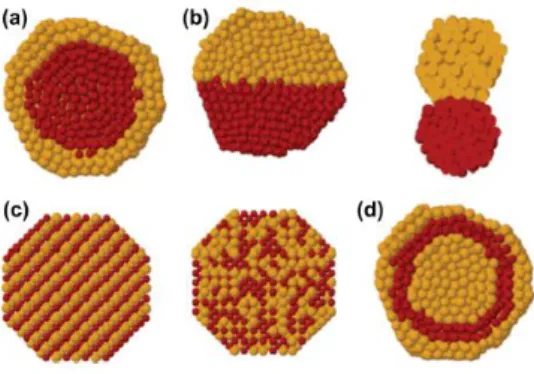
Bimetallic nanoparticles (NPs) are increasingly gaining importance owing to their unique properties. Depending on the respective future application such as catalysis, electrochemistry, magnetism, optics or biomedicine, structure properties of nanoalloys (e.g., shape, size, composition and surface chemistry) are different. In consequence, the diversity of NPs makes them extremely desirable. In the following scheme (Figure 2.1), the main types of structure which are determined by the nature of elements i.e., relative bond strengths, surface energies, relative atomic sizes, charge transfer and specific electronic/magnetic effects, are represented [17].
Figure 2.1. Schematic representation of bimetallic NPs with different structures. a) core-shell segregated structures; b) heterostructure; c) intermetallic or alloyed structures and d) multishell structures [17] .
5
structure due to orbital overlap changes are governing factors. However, improvements in activity and selectivity catalysts are the principle objective in this matter so special attention to geometric effect at the surface should be paid [18] since, for example, for bimetallic Pt/Ni system [19], the second metal (Ni) may block the first metal (Pt) sites on the surface and, then, average size and composition of active sites can be modified [18].
Concerning nano Fe which presents high reactivity, low cost, easily obtained raw materials and nontoxicity, as it has already been mentioned, catalytic performance of this metal in selective hydrogenation can be enhanced by combining with another non-noble metal [17]. No previous search has been carried out to explore the combination of Fe and Zn but some studies on other metals (Cu,Ni) have showed the promising effect of Zn addition on the catalytic performances[10]. In a study performed by F. Studt et al., DFT calculations predicted that Fe-Zn alloys could have interesting properties in terms of activity and selectivity for the acetylene hydrogenation reaction [20]. As a matter of fact, they went into detail to find the best catalyst for their purpose and, by means of Density functional theory (DFT), elaborated scaling relations between different adsorption energies of components in order to characterize their catalytic activity and selectivity. Through this DFT calculation, it can be predicted that bimetallic Fe-Zn or FeZn3 alloys could be interesting alternatives
for the selective hydrogenation of polyunsaturated hydrocarbons.
2.2.3.
Support
Referring to the fact that solid catalysts are very functional materials employed in 90% of industrial processes, it is important to point out that the most important ones are supported. In these catalysts, nanoparticles of an active element (metal, oxide, or sulphide) are dispersed on the surface of a carrier with high surface area [21].
The requirements of the support for this study in particular are[10]:
- Stability during the sample preparation and the following thermal treatments. - No catalytic activity for selective hydrogenation of unsaturated hydrocarbons.
6
For this research, although some studies evinced that no influence of the oxide support nature on the activity and selectivity was found during selective hydrogenation of butadiene indicating that the reaction happens only on the metal particles [22], [23], conversely, P.Burattin et al.[24] and V.Kaushik et al.[25] reported that SiO2 and Al2O3 supports can easily create silicates or aluminates species during
sample preparation. For that reason, TiO2 support has been selected because of its stability in solution
and owing to the absence of reports about titanates formation during sample preparation at low temperature [21].
Titanium oxide is widely used in a lot of photocatalytic and classical catalytic processes due to the fact that it is chemically and biologically inert, stable to corrosion and nontoxic. It presents two important phases, anatase and rutile crystals, both are formed by chains of distorted TiO6 octahedra where each
Ti atom is surrounded by 6 oxygen atoms. Regarding tetragonal structure of anatase, the conventional unit cell contains four TiO2 units, unlike that of rutile which consists of two TiO2 units [21].
Regarding the selected metal, there are not a great deal of studies on the deposition of Fe(II) on TiO2
in the literature, probably, since Fe(II) is very easily oxidised to Fe(III) so it is hard to find convenient conditions to work under. However, some authors have studied kinetics and equilibrium of the adsorption of Fe(II) on TiO2 oxide rich in anatase (P25) which it is well known to develop hydroxyl
groups on the surface as it occurs when the surface of an oxide is in contact with an electrolyte solution[21], [26]. Then, in order to fit properly the data of adsorption using the most realistic model (multisite complexation model or music), Hiemstra and Van Riemsdijk assumed that this deposition gives rise to the formation of a tetradentate inner-sphere complex (Eq. 1) [27].
2 𝑇𝑖2𝑂−0.67+ 2𝑇𝑖𝑂𝐻−0.33+ 𝐹𝑒2+↔ (𝑇𝑖2𝑂)2(𝑇𝑖𝑂𝐻)2𝐹𝑒 Eq. 1 [27]
2.3.
SYNTHESIS STRATEGY
7
Recent research has showed that the preparation method has a strong influence on the activity towards hydrogenation reaction. In fact, it was found that catalysts prepared by deposition-precipitation presented higher activity. For that reason, this synthesis method has been chosen for further investigation [23].
On the other hand, chemical reduction has resulted in being an interesting method to prepare nanoscale zero-valent iron in order to be used in environmental applications because of its reactivity toward targeted contaminants [28], [29]. Due to the fact that it has also been tested as catalyst in some hydrogenation processes [30], [31], it is another synthesis choice in this particular study.
2.3.1.
Deposition-precipitation with urea (DPu)
The first who proposed deposition-precipitation by a gradual and continuous increase of the pH to synthesise supported metal catalysts was Geus et al. for the preparation of Ni/SiO2 who pointed out
that the phase diagram of the precipitated solid in equilibrium with a solution containing its metal precursor as a function of temperature and concentration of a precipitation reactant (e.g. sodium hydroxide, ammonia and urea) must be taken into account. The equilibrium curves represented by solubility (S) and supersolubility (SS) curves, whose intermediate gap corresponds to the nucleation, of a pure solution and a solution with a support in suspension can be observed in (Figure 2.2) [32].
Figure 2.2. Phase diagram as a function of temperature and concentration of a reactant for a pure solution (solid lines) and a supported solution (bold lines) [32]
8
On the other hand, as this method is performed in isothermal condition, specifically at 80 °C for DPu (Figure 2.2), the concentration of soluble ions will diminish little by little owing to
deposition-precipitation onto support surface, in other words, during pH increase (Figure 2.3). This is due to the gradual rise of precipitating agent (OH-) which leads to precipitation by hydrolysis of the metal
complexes promoting a fluctuation in OH- concentration.
Figure 2.3. Phase diagram of precipitation of metal species in solution as a function of pH and ion concentration: a pure solution (solid lines) and a supported solution (dotted lines) [10]
It is also of significance for bimetallic materials synthesis to consider that if it is desired that the two metal ions are co-deposited on the support in a single step, solubility products must be closed to each other. In Table 2.1, the values of solubility products of some base metal hydroxides at room temperature are described [33]:
Table 2.1. Solubility products of non-noble metal hydroxide at RT [10], [33]
9
Urea has been selected as the precipitating agent to synthesise these particular catalysts because of being a delay-base, i.e., its dissolution and decomposition during solution basification can happen into two separated steps controlled by the solution temperature. This statement means that urea is capable of dissolving into solution at RT and then decomposing to CO2,NH4+ and OH- above 60 °C (Eq. 2) [12],
[30].
𝐶𝑂(𝑁𝐻2)2+ 2𝐻2𝑂 → 𝐶𝑂2+ 2𝑁𝐻4++ 2𝑂𝐻− Eq. 2
2.3.2.
Chemical reduction
Nowadays, one of the most common method of synthesizing metallic NPs because of its simplicity is chemical reduction of metal salts in a solution using proper reducing agents such as NaBH4, H2, NH2
-NH2... In this case, sodium borohydride (NaBH4) has been selected as reducing agent since Fe
precursors are difficult to reduce because of its low redox potential [17].
𝐹𝑒(𝐻2𝑂)62++ 2 𝐵𝐻4−→ 𝐹𝑒0↓ + 2𝐵(𝑂𝐻)3+ 7 𝐻2
Eq. 3
This process is referred in the literature as bottom up [28] since it is based on the production of nanoscale zero-valent iron (nZVI) which is an engineered nanomaterial widely used in environmental remediation and hazardous waste treatment [31].
Figure 2.4. Structure of fresh nZVI
nZVI displays high reactivity due to its classical core-shell structure which consists of a metallic iron (Fe(0)) core encapsulated by a thin iron oxide shell of a few nanometers. In a way that the oxide shell promotes the adsorption of contaminants via electrostatic interactions and surface complexation, whereas Fe(0) works as an electron source applies a reducing character [29], [31].
10
based on TiO2 achieving more efficiency and ‛life span’ increase [35]. For this reason, among all the
alternatives of nZVI modification such as doping with other metals, surface coating, emulsified nZVI or deposition on a support, the latter has been chosen to synthesise the nanoparticles in the current study. Apart from TiO2, SiO2 support also resulted in beneficial effects because it achieved to reduce
the aggregation with simultaneous preservation of high nZVI activity as Li et al. reported [36]. Thus, for these reasons, TiO2 and SiO2 were used as support to prepare nZVI by Chemical reduction.
2.4.
SELECTIVE HYDROGENATION OF 1,3-BUTADIENE
This study is focused on catalytic behaviour of synthesised catalysts in hydrogenation of 1,3-butadiene. Among all the model reactions of selective hydrogenation of alkynes and alkadienes in alkenes, this particular reaction has been chosen because it gives four different products (three butenes and butane), with 1-butene as the most desirable product, and therefore allows the study of both activity and selectivity issues [23].
First of all, it is known that the molecule of 1,3-butadiene presents two distinct configurations: trans-1,3-butadiene and cis-trans-1,3-butadiene (Figure 2.5). Both exhibit the same values for C-H, C-C and C=C bond lengths, 0.108, 0.148 and 0.137 nm respectively. In addition, there is a super π bond due to the orbital overlapping of 2p-2p in C atoms which joins the four carbon atoms in butadiene molecule.
Figure 2.5.Molecular conformation of A) Trans-1,3-butadiene and B) Cis-1,3-butadiene [10] .
2.4.1.
Hydrogenation of 1,3-butadiene
Three possible routes to hydrogenate 1,3-butadiene are found: 1,2-H2 addition, 1,4-H2 addition and
11
Figure 2.6.Scheme of three different hydrogen addition reaction on 1,3-butadiene [10] .
As far as it is observed in the representation (Figure 2.6), 1,2-addition gives place to 1-butene formation by means of two hydrogen atoms addition onto C1 and C2 atoms. Similarly, for 1,4-addition, two hydrogen atoms are added onto C1 and C4 atoms resulting in cis-2-butene and/or trans-2-butene generation. In these both cases, hydrogenation could continue and lead to butane. Nonetheless, during 2,3-addition, butadiene is totally hydrogenated to butane due to the fact that an unstable intermediate product is generated (*CH2CH2CH2CH2*) which rapidly reacts with other two H atoms and
forms the butane product [10]. On the other hand, another alternative reaction has been reported by Gómez et al. [18], it is isomerization which can transform trans-2-butene into cis-2-butene.
12
2.4.2.
Selective hydrogenation of 1,3-butadiene in the excess of propene
In this work, selective phase hydrogenation of 1,3-butadiene performed in an excess of propene (propene/butadiene ratio = 100 ; 0.3% butadiene, 30% propene and 20% hydrogen) has been selected in order to simulate the purification process of industrial light alkenes stream (C4 cuts) to prevent further poisoning of the polymerization catalysts used for polyalkene production [37].
The choice of replacing butene by propene was based on the experimental results of previous research which demonstrated that the reactivity of propene was similar to that of butenes [23], [37]. In fact, despite the assumed fact that adsorbed propene limits the access of catalytic sites to the other reactants, these studies probed that propene must be weakly adsorbed, otherwise butadiene hydrogenation would be inhibited. Thus, alkene adsorption on the catalytic sites is not a parameter limiting the reaction rate [37].
In conclusion, with the purpose of an easy distinction by gas chromatography between alkane (butane) arising from the total hydrogenation of 1,3-butadiene and that (propane) arising from hydrogenation of the alkene in excess, propene is selected as the main alkene rather than butene [23].
As a summary, 1,3-butadiene is expected to be semi-hydrogenated to butenes (1-butene, trans-2-butene or cis-2-trans-2-butene) with no further butane formation and no propane generation derived from propene hydrogenation [10].
13
The aim of this chapter is to describe the procedures followed towards the synthesis, characterization and testing of catalysts selected for selective hydrogenation reaction.
3.1.
MATERIAL SYNTHESIS
3.1.1.
Deposition-precipitation with urea (DPu)
Monometallic Fe/TiO2 and Zn/TiO2 and bimetallic Fe-Zn/TiO2 catalysts were prepared using the method
of deposition-precipitation with urea (DPu) described in Section 2.3.1. For this procedure, 3 g of support (TiO2 P25 Evonik, 80 % anatase, 20 % rutile) were weighed and dispersed into 300 ml of distilled
water (msupport(g) : Vwater(ml) = 1:100) previously heated at 80°C using a water bath and which contains,
the stoichiometric amount of metal precursor(s) such as FeCl2∙4H2O and ZnCl2 in order to achieve the
desired nominal metal loading, i.e., 2.5 wt% Fe with Fe:Zn atomic ratios of 1:1 and 1:5. Once the support was added into the mixture, the precipitating agent (urea) must be immediately introduced in excess with a molar concentration ratio of [urea]/[metal] = 100. The mixture was kept at 80 °C in a closed double-wall reactor for 16 h under continuous stirring. After that, the precipitated solid was separated from the liquid phase by centrifugation and subsequently repeatedly washed with distilled water and centrifuged (three times). At last, samples were dried under vacuum at room temperature for 24 h and, once they were crushed, sieved and weighed, activation through thermal treatment was performed (see Section 3.2.).
All chemicals were supplied by Sigma Aldrich. Metal precursors were: FeCl2·4H2O (198.81 g/mol), ZnCl2
(136.28 g/mol); Support: TiO2 P25 Evonik (79.87 g/mol) and precipitating agent: CO(NH2)2 (60.06
g/mol).
3.1.2.
Chemical reduction
Zero-valent iron (ZVI) were synthesised by the Chemical Reduction method described in Section 2.3.2. Different procedure conditions were attempted such as distinct inert gases and several main solution chemicals. Finally, it was found that working under Argon degassing using Milli-Q water (18.2 MΩ·cm at 25 °C) as solvent were the best conditions for this synthesis method.
Before starting the preparation, high purity water was subjected to degassing by Ar for 30 minutes. Next, 85 mL were separated and put in a round-bottom flask under stirring at room temperature without stopping Ar degassing. Then, the appropriate amount of iron precursor was weighed and added to the solution. The pH was measured (≈3.4) after dissolution and continuous stirring for 5 min. Then, 1 g of support (TiO2, SiO2 or Zn/TiO2) was introduced into the solution and stirring was kept for
14
10 additional minutes while a fresh NaBH4 solution (0.44 M) was prepared. The latter consisted of 83
mg of solid precursor NaBH4 dissolved in 5 mL of degassed Milli-Q water. At the same time that NaBH4
was added dropwise, the iron solution colour was changing from light pink to light brown, light grey and, then, dark grey for Fe/TiO2 whereas, in the case of Fe/SiO2,material turned very dark grey just
after the moment of addition. After keeping on stirring for 10 min, the precipitated solid was separated from the liquid phase by centrifugation and subsequently repeatedly washed with Milli-Q water and centrifuged (two times). Finally, samples were dried under vacuum at room temperature for 24 h and, once they were crushed, sieved and weighed, activation through reduction treatment was performed (see Section 3.2.).
All chemicals were also supplied by Sigma Aldrich. Metal precursors were: FeCl2·4H2O (198.81 g/mol),
ZnCl2 (136.28 g/mol); Support: TiO2 P25 Evonik (79.87 g/mol), SiO2 (60.08g/mol) and reducing agent:
NaBH4 (g/mol).
3.2.
THERMAL TREATMENT
After the procedure described in section 3.1., a thermal treatment was performed on the samples before characterization and catalytic tests. The materials prepared by DPu were subjected to a calcination treatment for 2 h at 400°C with a temperature ramp of 5°C min-1 under flowing air (‘x’ mL
min-1 for ’x’ mg of sample) and, then, to a reduction process at both 400 and 500 °C for 2 h with a
temperature ramp of 3°C min-1 under flowing H
2 (‘x’ mL min-1 for ’x’ mg of sample). In the case of the
samples synthesised by Chemical Reduction, the reduction treatment is directly performed without previous calcination since iron was already reduced and Fe reoxidation should be avoided as much as possible.
15
Figure 3.2. Temperature program for reduction.
3.3.
MATERIAL CHARACTERIZATION TECHNIQUES
The following experimental setups were used to characterize the samples and to analyse their physico-chemical properties.
- XRF: XEPOS HE (AMETEK). - XRD: D8 Bruker Company. - N2- adsorption: BELSORP-max.
- TEM, STEM-HAADF, EDX: JEOL 2100Plus, CCD Orius camera Gatan, Oxford, SDD 80 mm2 Xmax.
- TPR: Varian Micro GC QUAD CP4900.
3.3.1.
X-Ray Diffraction (XRD) analysis
The measurement was performed on a diffractometer (D8 Bruker Company) operating with Cu Kα radiation (1.5418 Å; 40 kV and 30 mA) with a Ni filter and XRD peaks were detected with the JCPDS cards.
Crystallite size can be estimated by Scherrer’s equation calculation using full-width half maximum (FWHM) of each characteristic peak.
𝑑̅ =
𝐾 𝜆16
3.3.2.
X-ray fluorescence (XRF) analysis.
It is also a non-destructive analytical technique used to determine the elemental composition of materials. XRF is based on the emission of the fluorescent (or secondary) X-ray from a sample which has been previously excited by bombarding with a primary X-ray source such as high energy X-rays or gamma rays which were firstly applied by Glocker and Schreiber et al. [38]. It is an excellent technology for qualitative and quantitative analysis of material composition, or in this case of metal loading, because each one of the elements produces a set of characteristic fluorescent X-rays that is unique for that specific element. Therefore, this method is based on calibration curves obtained from standard samples for each element. The measurements in the laboratory are carried out using a spectrometer XEPOS HE (AMETEK) [10].
3.3.3.
N
2-adsorption analysis. Brunauer–Emmett–Teller (BET).
Before carrying out the experiment, samples must be pre-treated in order to remove all the other gases in the sample such as H2O or CO2 since the aim is to measure properties using N2 adsorption.
Hence, once samples are weighed, they were heated at 300 ᵒC for 2h on a Belprep II.
Brunauer-Emmet-Teller surface area was determined by N2-physisorption using a BELSORP-max
designed for wide range adsorption isotherm for surface area and pore size distribution analysis. It can measure from relative pressures as low as 1x10⁻⁸ (N
2 at 77K, Ar at 87K).
3.3.4.
Transmission Electron Microscopy (TEM)
The morphology of the metallic nanoparticles was observed by Transmission Electron Microscopy (TEM) on a JEOL 2100Plus, operated at 200 kV and equipped with a LaB6 gun. To better distinguish metal particles from the support, scanning transmission electron microscopy in high-angle annular dark-field mode (STEM-HAADF) were also performed to study small mono and bimetallic particles. The image was obtained by a CCD Orius camera Gatan. Energy-dispersive X-ray spectroscopy (EDX) characterization was carried out using Oxford, SDD 80 mm2 Xmax with Aztec as software in order to
evaluate the composition of metal particles.
17
3.3.5.
Temperature-Programmed Reduction (TPR)
With the purpose of testing the reduction behaviour of materials, the samples were kept under He flow at 100°C for 15h and were then exposed to a hydrogen flow of 100 ml min-1 at increasing
temperature from 100°C to 400°C or 500°C with a rate of 2°C/min. The software used for collecting the data calculate the concentration of H2O which is being formed through the experiment. In this way,
comparing the value obtained experimentally with the theoretical amount of H2O that the material
should produce knowing its composition and the products of reaction, it is possible to estimate the extent of the reduction of the synthesised material and also to know approximately its temperature of reduction.
This analyses were undertaken by a Varian Micro GC QUAD CP4900 equipped with two analysis channels (Poraplot Q for H2O detection).
3.4.
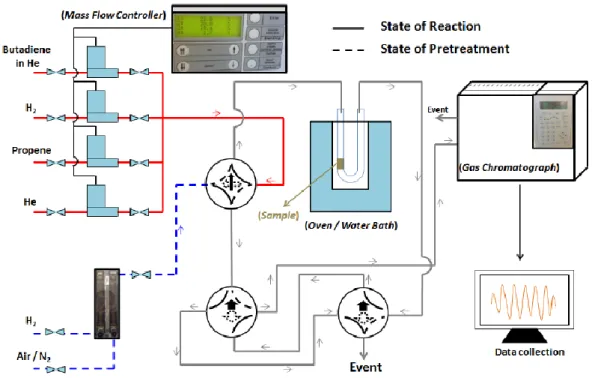
CATALYTIC TEST AND PERFORMANCE
The performance of synthesised catalysts in selective butadiene hydrogenation was tested on 50 mg of sample (sieve fraction, 125-200 µm) in a plug flow microreactor in Pyrex (4 mm of internal diameter) (Figure 3.3). Firstly, the ex situ calcined catalysts were activated in situ, under pure H2 (100 mL min-1)
from RT to 400°C at a heating rate of 3°C min-1 and kept 2 h at the final temperature. Then, the reactor
was cooled down were cooled down to room temperature under the same flow rate of pure H2, and
the reaction mixture containing 0.3% butadiene, 30% propene and 20% hydrogen in He (49.7%) with a total flow rate of 50 mL min-1 was first analysed as a reference by means of a gas chromatograph
18
The increase in temperature of the reactor in an oven was controlled via temperature program and the composition of gas mixture was controlled by mass flow controllers with a concentration ratio between butadiene and propene of 1:100.
Figure 3.3. Scheme of catalytic test set-up
o EVALUATION OF CATALYTIC PERFORMANCE
Catalytic properties of the samples are evaluated as follows: a. The selectivity:
𝐴𝑙𝑘𝑎𝑛𝑒𝑠 𝑓𝑜𝑟𝑚𝑎𝑡𝑖𝑜𝑛 (𝑝𝑝𝑚) = (𝑝𝑟𝑜𝑝𝑎𝑛𝑒𝑜𝑢𝑡𝑙𝑒𝑡− 𝑝𝑟𝑜𝑝𝑎𝑛𝑒𝑖𝑛𝑙𝑒𝑡) + 𝑏𝑢𝑡𝑎𝑛𝑒
b. The activity:
𝐶𝑜𝑛𝑣𝑒𝑟𝑠𝑖𝑜𝑛𝑏𝑢𝑡𝑎𝑑𝑖𝑒𝑛𝑒(%) = 100 𝑥 (1 −
𝐵𝑢𝑡𝑎𝑑𝑖𝑒𝑛𝑒𝑜𝑢𝑡𝑙𝑒𝑡 𝐵𝑢𝑡𝑎𝑑𝑖𝑒𝑛𝑒𝑖𝑛𝑙𝑒𝑡
19
4.1.
CHARACTERIZATION
In this section a structural investigation on the as-prepared and activated Fe-based catalysts has been performed using X-Ray Fluorescence (XRF), X-Ray Diffraction (XRD) and Transmission Electronic Microscopy (TEM). In addition, the reduction behaviour of these materials were investigated by monitoring the formation of H2O during a reductive thermal treatment under H2.
4.1.1.
X-ray fluorescence (XRF)
Based on the calculation and Fe metal loading selected for the synthesis of the samples, i.e., 2.5 wt%, the mass percent of Zn in the case of the bimetallic catalysts should be 2.78 wt% or 12.5 wt%, respectively, depending on the Fe-Zn molar ratio, 1:1 or 1:5. All theoretical mass percent, either for samples prepared by DPu or those by Chemical Reduction, have been included in Table 4.1.
THEORETICAL PERCENT OF MASS
Fe samples Fe-Zn 1:1 sample Fe-Zn 1:5 samples
wt% Fe 2.5 2.5 2.5
wt% Zn - 2.78 12.5
wt% TiO2 97.5 94.72 85
wt% SiO2 97.5 - -
Table 4.1. Theoretical mass percent of each compound
In order to verify these theoretical mass, X-Ray Fluorescence (XRF) analyses were carried out for the as-prepared samples as well as for the samples after activation treatments, i.e., calcination and reduction processes. The results are summarised in Table 4.2 for samples synthesised by Deposition-precipitation and in Table 4.3, for samples by Chemical Reduction.
EXPERIMENTAL MASS PERCENT OF SAMPLES BY DPU
Fe Zn TiO2
Fe/TiO2 2.46 - 95.2
calcined Fe/TiO2 2.55 - 93.7
500˚C-reduced Fe/TiO2 2.55 - 94.9
400˚C-reduced Fe/TiO2 2.39 - 95.1
Fe-Zn 1:1/TiO2 2.46 2.65 92.6
calcined Fe-Zn 1:1/TiO2 2.40 2.62 92
20
500˚C-reduced Fe-Zn 1:1/TiO2 2.44 0.68 94.7
400˚C-reduced Fe-Zn 1:1/TiO2 2.33 2.44 93
Fe-Zn 1:5/TiO2 2.21 11.12 82.7
calcined Fe-Zn 1:5/TiO2 2.19 10.80 83.4
500˚C-reduced Fe-Zn 1:5/TiO2 2.17 9.30 84.9
400˚C-reduced Fe-Zn 1:5/TiO2 2.19 10.88 83.1
Zn/TiO2 - 12.30 83.4
calcined Zn/TiO2 - 11.01 85.5
400˚C-reduced Zn/TiO2 - 11.53 81.7
Table 4.2. XRF analyses of Fe, Zn and TiO2 loadings in the samples prepared by DPu
By and large, it can be affirmed that Fe and TiO2 mass percent achieved are very similar to those
expected. Therefore, it is concluded that Fe has been well deposited on TiO2 surface. The zinc loadings
are lower than the theoretical values, indicating an incomplete deposition of Zn. Moreover, in the same way that T.Imoto et al. and S.Lew et al. reported [39], [40] , the volatility of metallic Zn has been demonstrated by means of these XRF analyses undertaken in the samples reduced at 500 °C. As far as it can be appreciated in Table 4.2, the content of Zn has largely decreased after the reduction at 500 °C, especially in the sample with a molar ratio Fe-Zn of 1:1, comparing the Zn loading of 0.68 wt% obtained experimentally to the theoretical value, 2.78 wt%. Reduction at lower temperature (400 °C) allows to strongly limit such a loss of Zn, whatever the zinc loading.
On the other hand, the results show that Fe deposition on the TiO2 surface was more incomplete using
the Chemical Reduction method (Table 4.3) since the iron content tested by XRF was less than that obtained by DPu. Nevertheless, for the bimetallic sample which was prepared by combining both methods, i.e., firstly DPu process to synthesise Zn/TiO2 and then, Fe addition by Chemical Reduction,
XRF analysis shows that Fe was well deposited as well as no loss of Zn after reduction at 400°C was detected. Lastly, as the SiO2 support is an amorphous material with higher surface area than TiO2, it
was not surprising that a higher Fe loading was achieved on its surface.
EXPERIMENTAL MASS PERCENT OF SAMPLES BY CHEMICAL REDUCTION
Fe Zn TiO2 SiO2
Fe/TiO2 2.15 - 95.68 -
400˚C-reduced Fe/TiO2 2.14 - 95.74 -
Fe/SiO2 2.96 - - 91.94
21
Fe-Zn 1:5/TiO2 2.69 11.77 79.92 -
400˚C-reduced Fe-Zn 1:5/TiO2 2.92 12.56 79.91 -
Table 4.3. XRF analyses of Fe, Zn and support loadings in the samples prepared by Chemical reduction
Additional experiments using N2-physisorption were performed so as to test the surface area (by BET
method) of the supports as well as the state of some samples after metal addition. Results are tabulated in (Table 4.4).
BET surface area (m2/g)
TiO2 support 58.53
SiO2 support 255.73
Fe/TiO2 Chem Red 60.13
Fe/SiO2 Chem Red 282.01
Fe/TiO2 DPu 56.28
Zn/TiO2 DPu 62.65
Table 4.4. BET surface area by N2-physisorption
4.1.2.
Temperature Programmed Reduction (TPR)
After observing the Zn loss at 500°C by XRF analysis, it was considered to probe the reduction behaviour of the Fe nanomaterials at 400°C and/or 500°C. The experiments were based on the comparison between the theoretical amount of H20 that should be produced during the reduction
calculated by some estimations and assumptions and the experimental amount of H20 produced under
a H2 flow over the increase in temperature. Despite the fact that samples were initially calcined ex-situ
at 400 °C for 2 h and, then, kept under a flow of He at 100 °C overnight before the TPR experiments, the amount of H2O generated at low temperature, i.e., from 100 °C up to 250°C, is probably "structural"
water removed from the bulk material and does not correspond to the reduction process. On the other hand, from 250°C, the formation of H2O is considered to be due to the reduction of the material. In
particular, Fe reduction consists in the following steps: Fe2O3 to Fe3O4 to FeO and, finally, to metallic
Fe [41]. The total amount of water released has been estimated by calculating the area under the curve using the trapezoidal rule and was compared to the theoretical H2O formation expected from the full
22
THEORETICAL AND EXPERIMENTAL H2O FORMATION
Theoretical H2O
production (mole)
Experimental H2O production
(mole)
Ratio
Experimental/Theoretical
Fe/TiO2 DPu reduction 500°C 6.83 ∙ 10-5 7.07 ∙ 10-5 1.03
Fe/TiO2 DPu reduction 400°C 6.40 ∙ 10-5 4.82 ∙ 10-5 0.75
FeZn 1:1/TiO2 DPu reduction 500°C 5.86 ∙ 10-5 7.80 ∙ 10-5 1.33
FeZn 1:5/TiO2 DPu reduction 400°C 5.86 ∙ 10-5 6.48 ∙ 10-5 1.10
Fe/TiO2 CR reduction 500°C 5.75 ∙ 10-5 4.77 ∙ 10-5 0.83
Fe/SiO2 CR reduction 500°C 7.92 ∙ 10-5 8.70 ∙ 10-5 1.09
Table 4.5. Theoretical and experimental H2O formation during the reduction under H2
The reduction up to 400°C and 500°C of the Fe/TiO2 sample prepared by DPu are represented in (Figure
4.1). At first sight, it is supposed that Fe-based materials are more completely reduced at 500 °C but it
is also worth to test their behaviour at 400 °C because of the important benefits for bimetallic FeZn-catalysts. Our estimations showed that Fe/TiO2 reduced up to 500 °C is able to produce approximately
23
Figure 4.1. TPR at 500 °C and 400 °C of Fe(II)/TiO2 sample after calcination at 400 °C for 2h
Concerning the Fe/TiO2 and Fe/SiO2 samples synthesised by Chemical Reduction, the amount of H2O
releases below 250°C is larger because these samples were not subjected to calcination before reduction. Additionally, as it was expected from XRF results, the higher water formation for Fe/SiO2 is
due to the more elevated content of iron. In the case of Fe/TiO2, the water formation is also clearly
lower than for the same sample prepared by DPu (Figure 4.2). This may result from the fact that for the samples prepared by Chemical Reduction, iron was already reduced by reaction with NaBH4 during
the preparation and was then reoxidised by exposure to air, but the extent of the reoxidation is unknown, as is the nature of the iron oxide phase(s) formed.
Figure 4.2. TPR at 500 °C of Fe(II)/TiO2 and Fe/SiO2 samples
Next, reduction behaviours up to 400 °C of both TiO2 supported monometallic Zn and Fe and bimetallic
Fe-Zn 1:5 catalysts and reduction behaviour up to 500°C of TiO2 supported bimetallic Fe-Zn 1:1 are
plotted in (Figure 4.3).Zn/TiO2 sample only shows limited H2O formation above 250°C whereas Fe-Zn
1:1/TiO2 presents high amounts of water under heating up to 500 °C, exceeding the expected water
24
one (Table 4.5) which might indicate a limited reduction of zinc oxide in addition to the one of iron oxide.
Figure 4.3. TPR at 400 °C of Fe(II)/TiO2, Zn/TiO2 and FeZn 1:5/TiO2 and TPR at 500 °C of FeZn 1:5/TiO2 samples synthesised by DPu
4.1.3.
X-Ray Diffraction (XRD)
Phase identification of as-prepared and activated samples is described in this section.
o Fe/TiO2 sample by Deposition-precipitation with urea
In Fe/TiO2 material prepared by DPu, the majority of the peaks detected by XRD (Figure 4.4).
correspond to the TiO2 support phases, anatase and rutile, whose most intense peaks are found in 2θ
positions at 25°, 47.5°, 54°, 55° and 63° in the case of anatase and at 26.5°, 36°, 41° and 56.5° for rutile phase. Calcination treatment has no significant effect on the structure of the iron-based catalyst. On the other hand, metallic iron has been the only iron phase visible at 44.8° by XRD in the reduced sample at 400 °C.
25
Figure 4.4. XRD patterns of as-prepared (black), calcined (pink) and reduced at 400 °C (blue) Fe(II)/TiO2 samples synthesised by DPu
26
Figure 4.5. XRD patterns of as-prepared (black), calcined (pink) and reduced at 400 °C (blue) Fe(II)Zn 1:1/TiO2 samples synthesised by DPu
There are no relevant changes in the structure of the sample after comparing the graph to that of monometallic Fe/TiO2 catalyst. Only metallic iron has been detected at 44.8° with smaller crystallite
size, 28 nm. No zinc oxide phase could be observed which might be due to high dispersion and/or too small crystallite size (Figure 4.5).
o Fe-Zn 1:5/TiO2 sample by Deposition-precipitation with urea
Figure 4.6. XRD patterns of as-prepared (black), calcined (pink) and reduced at 400 °C (blue) Fe(II)Zn 1:5/TiO2 samples synthesised by DPu
The TiO2 supported Fe-Zn 1:5 catalyst prepared by DPu exhibits a larger variety of compounds(Figure
4.6) though some of them could not be identified because of overlapped peaks or weak intensity. It is
27
o Zn/TiO2 sample by Deposition-precipitation with urea
Figure 4.7. XRD patterns of as-prepared (black), calcined (pink) and reduced at 400 °C (blue) Zn(12wt%)/TiO2 samples synthesised by DPu
The monometallic Zn(12wt%)/TiO2 catalyst shows approximately the same compounds as the
bimetallic FeZn1:5/TiO2 apart from the absence of iron oxide and metallic iron (Figure 4.7). The
elevated amount of Zn leads again to the detection of zinc oxide peaks.
o Fe/TiO2 sample by Chemical Reduction
28
The pattern of Fe/TiO2 sample synthesised by Chemical Reduction (Figure 4.8). is quite similar to the
one obtained by DPu apart from the lower intensity of metallic iron peak at approximately 45°. Crystallite size calculated by Scherrer’s equation is 49 nm.
o Fe/SiO2 sample by Chemical Reduction
As SiO2 is an amorphous material, no diffraction peak from the support is observed except the broad
peak at 22°. As XRF demonstrated, there should be iron species in the as-prepared sample but because of its small size or due to being amorphous, nothing has been identified. Nonetheless, after the reduction treatment, metallic iron is perfectly distinguished at 44.6° (Figure 4.9).with a crystallite size of 26 nm obtained by Scherrer’s equation.
Figure 4.9. XRD of as-prepared (black) and reduced at 400 °C (blue) Fe(II)/SiO2 samples synthesised by Chemical Reduction
o Fe-Zn 1:5/TiO2 sample by Chemical Reduction
In spite of the fact that bimetallic FeZn 1:5/TiO2 catalyst synthesised by Chemical reduction was not
29
Figure 4.10. XRD of as-prepared (black) and reduced at 400 °C (blue) Fe-Zn 1:5/TiO2 samples synthesised by Chemical Reduction
4.1.4.
Transmission Electron Microscopy (TEM)
In order to complement the information deduced by the other techniques, morphological and structural analyses were performed using TEM on three of the synthesised samples. Before microscopy analysis, a calcination treatment at 400 °C for 2h (heating rate: 5°C/min) followed by a reduction treatment under H2 at 400 °C for 2h (heating rate: 3°C/min) were performed for Fe/TiO2 and Fe-Zn
1:5/TiO2 samples prepared by DPu. On the other hand, the Fe/TiO2 sample synthesised by Chemical
reduction was only subjected to the reduction treatment under the same conditions. This pre-treatment was undertaken so as to test the materials after the same activation procedure as for the catalytic tests.
o Fe/TiO2 sample by Chemical Reduction
30
the molecular weights of Ti and Fe are rather close so the main principle of Z-contrast technique based on the statement of the higher the atomic number the brighter image is hardly useful. However, as far as it is appreciated in the elemental mapping of Fe (Figure 4.11),theiron species appear well dispersed on the support throughout the sample without any clear presence of cluster or agglomeration.
Figure 4.11. Spectre 1 of Fe/TiO2 sample (Chemical Reduction): a) TEM bright field graph b) STEM-HAADF and c) Elemental mapping of c.1) Ti, c.2) O, c.3) Fe
Nonetheless, in the case of other images corresponding to another area of the sample, the elemental mapping results are consistent with the XRD results obtained. Both show that the sample also contain large particles of iron as it can be observed in (Figure 4.12).
a)
b)
31
Figure 4.12. Spectre 2 of Fe/TiO2 sample (Chemical Reduction): a) TEM bright field graph b) STEM-HAADF and c) Elemental mapping of c.1) Ti, c.2) O, c.3) Fe
o Fe/TiO2 sample by Deposition-precipitation with urea
TEM and HAADF images of the Fe/TiO2 sample prepared by DPu also display particles of similar size
and aspects throughout all the sample. By means of elemental mapping, it is possible to identify iron species very well dispersed on the surface of the support. The presence of Fe clusters has not been found in this case since all the elements seem uniformly distributed throughout the material.
a)
a)
b)
c.1)
c.2)
c.3)
32
Figure 4.13. Spectre 1 of Fe/TiO2 sample (DPu): a) TEM bright field graph b) STEM-HAADF and c) Elemental mapping of c.1) Ti, c.2) O, c.3) Fe
o Fe-Zn 1:5/TiO2 sample by Deposition-precipitation with urea
The bimetallic catalyst shows a more complicated structure and, for that reason, an EDX analysis has been coupled with TEM imaging. As it can be observed in Tables b) and c)attached in (Figure 4.14), different regions of the sample do not have the same composition. For instance, referring to atomic percent calculated by EDX, region 1 is mainly formed by TiO2 support whereas region 2 mostly contains
zinc oxide corroborating XRD results.
Figure 4.14. Spectre 1 of Fe-Zn 1:5/TiO2 sample (DPu): a) TEM bright field graph, b) EDS of region 1 and c) EDS of region 2
Moreover, by means of elemental mapping, different compositions of various areas can be also demonstrated. Figure 4.15. c.3) shows a zone with a high concentration of well dispersed Zn which probably corresponds to a zinc oxide region. On the other hand, iron appears globally well dispersed
Element % atomic
O 77.86
Si 0.16
Ca 0.18
Ti 21.23
Fe 0.23
Zn 0.33
Element % atomic
O 63.47
Si 0.15
Ti 1.47
Cr 0.07
Fe 1.66
Zn 33.18
c.1)
c.2)
c.3)
a)
33
throughout the material as well as the presence of some Fe agglomerations is also detected Figure 4.15. c.4).
Figure 4.15. Spectre 2 of Fe-Zn 1:5/TiO2 sample (DPu): a) TEM bright field graph b) STEM-HAADF and c) Elemental mapping of c.1) Ti, c.2) O, c.3) Zn, c.4) Fe
On the other hand, in Figure 4.16, zinc seems to be well dispersed on the surface of the TiO2, support
(Figure 4.16. c.3)) and Fe presents a good dispersion but some clusters of iron can be also detected
(Figure 4.16. c.4)).
b)
a)
c.1)
c.2)
c.3)
c.4)
34
Figure 4.16. Spectre 3 of Fe-Zn 1:5/TiO2 sample (DPu): a) TEM bright field graph b) STEM-HAADF and c) Elemental mapping of c.1) Ti, c.2) O, c.3) Zn, c.4) Fe
Characterization conclusions
First of all, XRF results confirmed that the amounts of Fe and Zn obtained experimentally mostly agreed with the expected loadings, with the exception of samples containing Zn which showed an important loss of Zn after reduction at 500 °C. This fact was also evinced by TPR results of Fe-Zn 1:1/TiO2 depicted
in Figure 4.3with an extra amount of water produced when reduction takes place up to 500 °C. Despite the fact that TPR results indicate that reduction up to 400 °C results in an incomplete reduction for Fe/TiO2 by comparison with reduction at 500 °C, reduction at the lowest of the two temperatures will
be privileged for activation before catalytic reaction in order to limit the loss of Zn during the thermal treatment.
On the other hand, by XRD analyses, metallic iron is identified after reduction at 400°C in all the tested samples which should mean the presence of large particles in the material. This could be demonstrated in some samples by means of TEM imaging which showed the presence of Fe agglomerations as well as the one of dispersed iron throughout the sample. In addition, for the highly Zn loaded Fe-Zn 1:5 sample, elemental mapping of the material evinced the presence of zinc oxide, also detected by XRD, as well as some regions where Zn is as well dispersed as Fe. Thus, it can be deduced by TEM images that Zn and Fe are in proximity of each other although the existence of any mixed phase could not be evidenced.
35
4.2.
CATALYTIC PERFORMANCE
The samples were tested in the reaction of selective hydrogenation of 1,3-butadiene in an excess of propene (propene/butadiene ratio=100) after activation under H2 at 400°C. The evolution of the
concentration of butadiene, i.e., butadiene conversion, and of the alkanes formation to estimate the selectivity will be reported as a function of the reaction time.
4.2.1.
Monometallic Fe/TiO
2comparison
First of all, the catalytic performance of 50 mg of monometallic Fe/TiO2 prepared by DPu after
calcination and reduction at both 400°C and 500°C for 2 h was evaluated and gathered in Figure 4.17. Initially, three analyses were carried out at room temperature. Then, the reactor was heated from 30°C to 200°C (heating rate: 2°C/min). These experiments are displayed in a zoom in Figure 4.18 where it is observed that the butadiene conversion profile is very similar for both cases with a rather rapid deactivation during reaction at room temperature. However, over approximately 20 hours at 200 °C, the two samples behaviours in terms of butadiene concentration are different. After reaching a maximum butadiene conversion at 200°C, a progressive deactivation is observed for both samples but the Fe/TiO2 catalyst with a pre-treatment at 400 °C presents higher butadiene conversion although the
iron reduction is supposed incomplete making reference to TPR results.
36
Figure 4.18. Zoom in Figure 4.17 between 0-140 minutes. Representation of butadiene conversion over reaction temperature
On the other hand, the selectivity can be analysed by checking the alkanes (butane and propane) formation. Both cases are alike but, at the beginning, higher selectivity is observed for sample activated at 400 °C though a slight change happens when both remain at 200 °C with the sample activated at 500°C being the most selective. However, it is worth to note that the alkanes production is very low (below 3000 ppm at maximum) whatever the reduction temperature, underlining the fact that iron is very selective to alkenes in this reaction.
37
4.2.2.
Comparison between samples prepared by Deposition-precipitation with urea
Secondly, all catalytic results of samples synthesised by Deposition-precipitation with urea and calcined then reduced at 400°C are depicted together in Figure 4.20 and Figure 4.22.As in the previous case, the temperature programmed reaction was carried on the reduced 50 mg of catalysts after three analyses at room temperature and, then, the temperature for the catalytic reaction was kept as a constant for 20 h when 200 °C was reached.
Undoubtedly, bimetallic Fe-Zn 1:5/TiO2 is more active and stable at 200°C than the other catalysts.
Even the sample with a Fe-Zn molar ratio of 1:1 presents a higher activity than monometallic Fe/TiO2
and Zn(12wt%)/TiO2 which gives rise to the conclusion that Zn addition increases the catalytic activity
and stability of iron catalysts in selective hydrogenation. It should also be pointed out that the monometallic Zn/TiO2 turned out to be quite active especially when the final temperature was
reached.
Figure 4.20.Butadiene conversion as a function of the time over Fe/TiO2 (green), Zn/TiO2 (orange), Fe-Zn 1:1/TiO2 (blue) and Fe-Zn 1:5/TiO2 (pink). All samples synthesised by DPu and previously calcined and reduced at 400 °C
Focusing on the first experiments undertaken at room temperature and during the increase in temperature (Figure 4.21),it is remarkable that the bimetallic Fe-Zn 1:5/TiO2 was the most active and
38
Figure 4.21.Zoom in Figure 4.20 between 0-140 minutes. Representation of butadiene conversion over reaction temperature
However, regarding the formation of alkanes, the bimetallic Fe-Zn 1:5/TiO2 presents the highest
alkanes production, thus the lowest selectivity to alkenes, but it can still be considered as highly selective as the alkanes concentration at the outlet is very low, especially when the reaction temperature is stabilized at 200 °C (less than 2000 ppm). From a general point of view, the four samples prepared by DPu show similar behaviours with regard to alkenes selectivity reaching more than 99%.
39
4.2.3.
Comparison between samples prepared by Chemical Reduction
In addition, the catalytic performances of TiO2 supported monometallic Fe(II) and bimetallic Fe-Zn 1:5
and SiO2 supported monometallic Fe(II) prepared by chemical reduction, after reduction at 400°C for
2 h, are depicted in Figure 4.23. Despite the fact that Fe/SiO2 showed a higher Fe content than Fe/TiO2,
it presents the lower catalytic activity in selective hydrogenation of 1,3-butadiene. On the other side, the monometallic Fe/TiO2 exhibited a slightly lower activity than the equivalent samples synthesised
by DPu but presents an increase in stability with time. The most active and stable material is again the bimetallic Fe-Zn 1:5/TiO2 since complete butadiene conversion is reached at 200 °C and remained for
2 h underlining an improved stability.
Figure 4.23.Butadiene conversion as a function of the time over Fe/TiO2 (green), Fe/SiO2 (blue) and Fe-Zn 1:5/TiO2 (pink). All samples synthesised by Chemical Reduction and previously reduced at 400 °C
Referring to the initial analyses, the butadiene conversion over bimetallic Fe-Zn 1:5/TiO2 presents a
40
Figure 4.24. Zoom in Figure 4.23 between 0-140 minutes. Representation of butadiene conversion over reaction temperature
Unfortunately, as a negative point, the bimetallic Fe-Zn 1:5/TiO2 showed the poorest selectivity to
alkenes, depicting some instabilities at the beginning and then achieving a moderate increase. In any case, the alkanes formation is still very low, especially in the case of the monometallic catalysts (Figure 4.25).
41
Catalytic performance conclusions
In first place, Fe/TiO2 sample prepared by DPu and reduced at 400°C exhibited higher butadiene
conversion than the same material reduced at 500°C despite the lower iron reduction extent estimated by TPR. This result also validates the choice of 400 °C as the maximum reduction temperature for bimetallic Fe-Zn samples, which permits to avoid the loss of Zn by evaporation at high temperature. On the other hand, no very marked difference is appreciated between both synthesis methods applied in this study, but it is remarkable that samples prepared by Chemical Reduction show a slightly higher activity and stability. Moreover, the peculiar behaviour of bimetallic Fe-Zn 1:5/TiO2 prepared by
chemical reduction which presents an activation with time at RT is intriguing and may deserve additional investigations.
In addition, the highly loaded Zn/TiO2 presented some significant activity at 200 °C in selective
hydrogenation of 1,3-butadiene which was not expected. Thus, it is probably, at least partially, the reason why the activity of the bimetallic Fe-Zn 1:5/TiO2 catalysts prepared by DPu and Chemical
Reduction proved to be higher than the one of the monometallic Fe/TiO2 samples, which could be
42
The present study investigates the applicability of supported monometallic Fe and Zn catalysts and bimetallic Fe-Zn catalysts in the selective hydrogenation of 1,3-butadiene. Therefore, the objective is to find a good catalyst in terms of activity, stability and selectivity. However, there are other important characteristics to take into account regarding the metallic active phase such as its abundancy, its price and its toxicity. This is the reason why iron is selected as an alternative to palladium whose properties have been already revealed successful in that reaction. Furthermore, it is well known that bimetallic materials present unique properties and, in particular, the promising effect of Zn addition on the catalytic performances of several transition metals has been reported.
Two preparation methods are also investigated. However, no important differences are evidenced in selective hydrogenation of butadiene, but the fact that the chemical reduction method leads to slightly higher activity and stability is promising as it is a rather simple method.
In addition, one of the most surprising findings is the noteworthy activity of the monometallic Zn/TiO2
in this reaction. In fact, it is concluded that the best catalyst is the TiO2 supported bimetallic Fe-Zn 1:5.
At low reaction temperature, the active phase is mainly the iron one as the monometallic Zn/TiO2 does
not present any significant activity below 150 °C, but at 200 °C the activity of the bimetallic catalysts may correspond to the summation of the activities of the iron and zinc phases, at least partly.
Noting that Zn is a very cheap non-noble metal, it should be necessary to keep on searching its beneficial properties in selective hydrogenation 1,3-butadiene. Moreover, the question of the oxidation state of the Zn and Fe active species is still arising. As zinc oxide is hardly reducible up to 400 °C in the absence of another metal, the active zinc species in Zn/TiO2 correspond probably to an
oxidized form. Activation of H2 by zinc oxide as well as selective hydrogenation of dienes was reported
in the literature [42] and the use of Zn as an active phase for selective hydrogenation might be worth exploring.
Regarding iron, its activity at low temperature and high selectivity towards alkenes are very promising and the nature of the oxidation state of the active iron phase is also questionable as incomplete reduction of iron at 400 °C results in higher activity than full one at 500 °C. The use of X-Ray photoelectron spectroscopy (XPS) after in situ reduction of the samples may bring some important information on this aspect.
![Figure 2.2. Phase diagram as a function of temperature and concentration of a reactant for a pure solution (solid lines) and a supported solution (bold lines) [32]](https://thumb-us.123doks.com/thumbv2/123dok_es/6643527.240825/14.892.289.600.698.916/figure-function-temperature-concentration-reactant-solution-supported-solution.webp)
![Table 2.1. Solubility products of non-noble metal hydroxide at RT [10], [33]](https://thumb-us.123doks.com/thumbv2/123dok_es/6643527.240825/15.892.206.690.812.1017/table-solubility-products-non-noble-metal-hydroxide-rt.webp)
![Figure 2.6. Scheme of three different hydrogen addition reaction on 1,3-butadiene [10] .](https://thumb-us.123doks.com/thumbv2/123dok_es/6643527.240825/18.892.154.734.157.475/figure-scheme-different-hydrogen-addition-reaction-butadiene.webp)
![Figure 2.7 . Selective hydrogenation in the gas mixture [10] .](https://thumb-us.123doks.com/thumbv2/123dok_es/6643527.240825/19.892.164.688.747.951/figure-selective-hydrogenation-gas-mixture.webp)