Developing an information system for monitoring student's activity in online collaborative learning
6
0
0
Texto completo
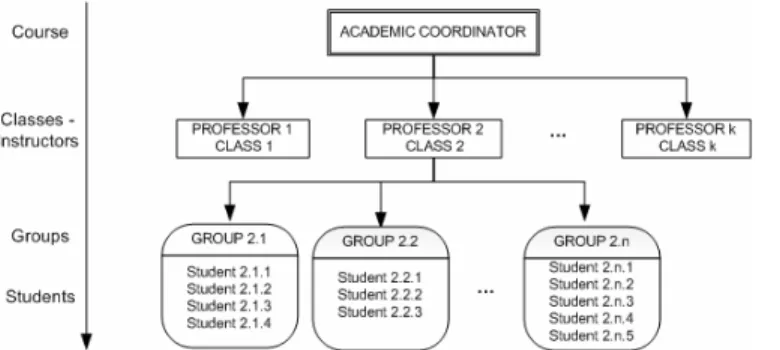
(2) Developing an IS for Monitoring Student’s Activity in Online Collaborative Learning activities and also that they provide regular feed-back on these activities. Furthermore, communication among students should also be facilitated and promoted by instructors –who should encourage students’ participation in the web spaces devoted to that function. Unfortunately, it is very difficult and time consuming for instructors to thoroughly track all the activities performed by each individual student in these e-learning environments. It is even much more complex to figure out the interactions taking place among students and/or groups of students, to identify actors –groups’ leaders and followers–, to detect students that are likely to dropout the course, or to perceive possible group internal conflicts or malfunctions before it gets too late to efficiently manage these problems. Monitoring students’ and groups’ activity can help to understand these interactions and forecast these potential problems which, in turn, can give important clues on how to organize learning exercises more efficiently and thus achieve better learning outcomes [5], [6]. Monitoring reports can be used by instructors to easily track down the learners’ online behavior and group’s activity at specific milestones, gather feedback from the learners and scaffold groups with low degree of activity. Monitoring has a time dimension, that is, instructors have to know both the groups’ and students’ activity performance as the learning process gets developed. The monitoring process can thus be a means for instructors to provide just-in-time assistance according to groups’ and students’ necessities. III. EXISTENT RESEARCH ON THE ISSUE Due to its importance, several works in the Computer Supported Collaborative Learning literature, and more especially those related to online collaborative learning, have addressed the monitoring issue from different perspectives, yet they all provide a very limited scope and do not raise most practical issues. Rather, they are concerned with conceptual aspects of monitoring [7] – [9]. There is also a wide variety of proposed methods to monitoring group and individual activity in online collaborative learning. These methods include statistical analysis, social network analysis, and monitoring through shared information and objects [10] – [12]. Moreover, there exist some differences as regards the sources of information used for monitoring: log files of synchronous and asynchronous communication, bulletin boards, electronic discussion information reports, etc. In general, though, the monitoring and evaluation of learners’ activity in online learning environments is still an important topic in the field of open and distance education. As some authors recognize, instructors participating in online learning environments have very little support by integrated means and tools to monitor and evaluate students’ activity [13], [14]. As a consequence, this monitoring process constitutes a difficult task which demands a lot of resources and expertise from educators.. 2. IV. OBJECTIVES AND SCOPE OF OUR WORK As in any other university offering online programs, in the case of the Open University of Catalonia (UOC, http://www.uoc.edu), instructors need non-intrusive and automatic ways to get feedback from learners’ progress in order to better follow their learning process and appraise the online course effectiveness. Designing efficient monitoring tools for online collaborative environments is certainly a complex task. This is partly due to a lack of practical models that had been already tested in real situations involving considerable number of students, groups and instructors. Therefore, the main goal of this work is to develop, implement and test a practical information system that allows instructors at the UOC to efficiently monitoring students’ and groups’ activity in collaborative e-learning courses. Even when the model presented in this paper has been designed to meet the UOC specific requirements, it can serve as a conceptual framework that can be used for tracking groups’ and individuals’ activity in any e-learning environment. In particular, it can be especially useful in those collaborative e-learning courses that: (a) span over one or more semesters, (b) involve a large number of groups and students that need to develop a continuous and intense collaborative activity, and (c) pursue specific academic goals regarding students’ active participation, low dropout rates and avoidance of groups malfunction. V. THE COLLABORATIVE E-LEARNING SCENARIO AT THE UOC In order to design our monitoring system at the UOC, we have considered a common scenario where groups of students have to develop long-term projects, which are problemsolving collaborative practices. Such projects are organized in terms of several phases, each of them corresponding to a target goal. The instructional design of each target goal includes several learning tasks, adequately linked to each other, which students should carry out individually –such as readings– or collaboratively –such as group activities and exercises– in order to achieve the corresponding goal. In addition, the design of some target goals also involves the realization of specific asynchronous debates at group or class level, aiming at decision taking on a set of specific questions. These projects are carried out in the scope of several distance learning undergraduate courses which typically run over a period of 15 weeks. Each of these courses involves one academic coordinator, several instructors –one for each virtual class– and the class of students –about 50 per class– distributed among different online groups with 3 to 5 members each (Fig. 1)..
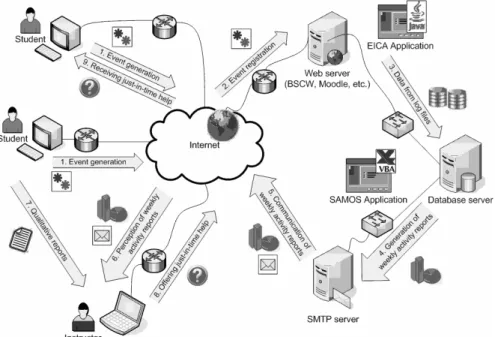
(3) Developing an IS for Monitoring Student’s Activity in Online Collaborative Learning. 4). Fig. 1. Collaborative e-Learning Scenario at the UOC. 5). The web platform that we use to develop collaborative elearning courses at the UOC is the Basic Support for Cooperative Work (BSCW) system (http://bscw.fit.fraunhofer.de/), a groupware tool that enables asynchronous and synchronous collaboration over the web [15]. This system, like any other similar online collaborative environment, offers shared workspaces that groups can use to store, manage, jointly edit and share documents, realize threaded discussions, etc. Additionally, the BSCW server keeps log files which contain all the actions (events) performed by group members on shared workspaces, as well as detailed information about these actions: user identification, event type, timestamp, associated workspace, affected objects, etc. Even though most e-learning environments offer some simple monitoring tools, they are very limited for practical purposes and do not meet information necessities of online instructors [16]. As a matter of fact, developers of the BSCW system recognize the need for powerful monitoring models and tools. To this end, our model will make use of the BSCW log files to generate visual reports that summarize relevant information on students’ and groups’ activity.. 6). 7) 8). 9). 3. could be adapted to read and process log files from web platforms other than BSCW, such as the ones cited before. Database files are then processed by SAMOS, which is an Excel/VBA application developed at the UOC. SAMOS uses Excel numerical, graphical and programming capabilities to generate weekly reports which summarize group and student activity levels in a graphical manner [17], [18]. The details regarding the design of these reports, which represent the core part of our model, are explained in the next section. The SMTP server automatically sends out these reports to instructors by e-mail. Instructors receive these reports and analyze them, looking for groups and students which seem to be “at risk”, i.e.: students with low activity levels –which makes them likely to be non-participating students and possible dropout students–, and groups with low activity levels –which makes them likely to be malfunctioning groups. These results are then combined and contrasted with the qualitative self-, peer- and group evaluation reports which are generated by the students themselves. Once the groups and students at risk have been detected, instructors contact them to offer specific guidance and support towards the best development and completion of their projects. The specific actions to be performed by instructors depend on the characteristics of the current learning activity and the type of problem detected. In any case, the important point here is that instructors become aware of the low activity problems as soon as they appear and, therefore, they can react on time, which adds value to their role as supervisors of the learning process. This way, students and groups at risk, receive just-intime guidance and support to enhance and continue their individual or collaborative work.. VI. OUR COLLABORATIVE E-LEARNING SCENARIO Fig. 2 shows the global scheme of the monitoring system that we have developed and tested at the UOC. The general functioning of this model is explained below: 1) Students perform activities in the web collaborative spaces associated to their working group: they post or read notes in forums, sent or read e-mails, upload or download documents, manage folders and files, etc. Each of these activities can be considered as an event of a certain type which has been developed by a particular student at a certain time and web space. 2) Events generated by students are registered in log files at the web server which supports the e-learning environment. In our case this server runs the BSCW web platform, but other platforms such as Moodle or WebCT would maintain similar log files. 3) A specific-purpose Java application, called EICA, is used to automatically read and process new incoming log files and to store the extracted data into a unique persistent database in the corresponding server. Note that EICA. VII. THE SAMOS MONITORING REPORTS Regarding the weekly monitoring reports, our goal was to design a small set of graphs that were easily and quickly understood by instructors, so that they did not have to invest extra time in analyzing data. These graphs should contain only critical information about groups’ and students’ activity levels. Furthermore, they should provide instructors with a rough classification for each kind of entities –groups and students– according to their corresponding activity levels. Specifically, they should allow instructors to easily identify those groups and students that were bound to maintain extremely low activity levels, since those entities are likely to need just-in-time guidance and assistance..
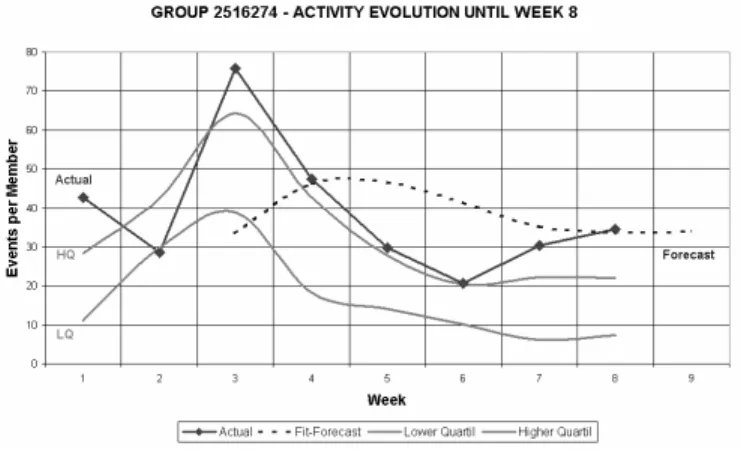
(4) Developing an IS for Monitoring Student’s Activity in Online Collaborative Learning. 4. Fig. 2. General Scheme of our Monitoring Model Similarly, these graphs should also provide information about the historical evolution of each group’s activity with respect the rest of the class groups, as well as information about the historical evolution of each student’s activity with respect to the rest of group members. Having these considerations in mind, we designed the following four charts: (a) a groups’ classification graph, (b) a students’ classification graph, (c) a group’s activity-evolution graph, and (d) a student’s activity-evolution graph. Each of these charts is described next: • Groups’ Classification Graph: This chart (Fig. 3) is a scatterplot of the following two variables: X = “average number of events per member that have been generated by group i during this (current) week” ( i = 1, 2,..., n ), and Y = “average number of events per member that have been generated by group i during a course average week”. The plot also includes the straight lines x = x and y = y , which divide the graph in four quadrants, Q1 to Q4. That way, points in Q1 can be seen as “heading groups” since their activity levels are above the two activity means –current week and course average week–; points in Q2 can be considered as “lowering groups”, since even when historically their activity level has been above the activity level for an average week, their current activity level is below the average; points in Q3 represent those groups which are below the two activity means –current and historical– and, therefore, they can be considered as “groups at risk”, since they are the most likely to suffer from low task contribution, group malfunctioning, lack of social cohesion and eventually from students’ dropouts; finally, groups in Q4 can be seen as “improving groups”, since even though their activity level has been historically below the mean, their level has been above the mean during the current. week, so they are experimenting some improvement in their activity level –maybe as a consequence of just-intime guidance by the instructor. Note that, as the distance between a point and any of the straight lines increases, more significant will be the former interpretations.. Fig. 3: Groups’ Classification Graph •. •. Students’ Classification Graph: This chart is similar to the one before. The only difference is that now the points will represent students instead of groups. Therefore, this graph allows for an easy identification of those “students at risk” –that is, students whose activity levels are below the current week average and below the historical week average. Analogously to what happened with groups, students can also be classified as “improving students”, “lowering students” or “heading students” depending on the quadrant they belong to. Group’s Activity-Evolution Graph: There is one of these charts for each group of students (Fig. 4). This way, for any given group the corresponding chart shows:.
(5) Developing an IS for Monitoring Student’s Activity in Online Collaborative Learning (a) a time series representing the group’s historical evolution –that is, the number of events per member generated by the group during each week–, (b) two smoothed bands which provide the lower (LQ) and higher (HQ) quartiles associated to the distribution of the events generated by each group during the current week –this way, it is immediate to check whether the group is performing above the third quartile, below the first one, or in between–, and (c) an exponentially smoothed line, using a smoothing factor of ω = 0.3 [19], that gives a forecast for the next week group’s activity. This chart allows the instructor not only to follow but also to predict the group’s evolution throughout the course.. 5. VIII. MODEL VALIDATION In order to test whether or not the information provided by our information system may influence groups’ and students’ performance in collaborative courses at the UOC, we developed the following experiment: at the beginning of the second semester of the 2006/07 academic course, a random sample of size 40 was drawn from the population of groups that were participating in any collaborative e-learning course. During the semester, instructors of these selected groups were provided with weekly reports generated by our system, so that they could detect students and groups at risk and provide them with just-in-time guidance and support. At the end of the semester, we calculated the following indexes: 1. Percentage of sampled groups which finished their project according to its initial specifications (PGF). 2. Percentage of sampled groups which received a positive evaluation at the end of the semester (PGP). 3. Percentage of sampled groups which experimented dropouts (PGD) –that is, some of the group members abandoned the course during the semester. Moreover, we used historical data from past semesters to obtain the before-SAMOS population percentages for these indexes, p0 ( i = 1, 2,3 ). Then, for each selected index i , we considered the corresponding hypothesis tests about the population proportions [20], i.e.: i. Figure 4: Group Activity Graph •. Group Members’ Accumulated Activity Graph: There is also one of these charts for each group. Given a group, the corresponding graph shows the percentage contribution of each member with respect to the total activity developed by the group until the current week (Fig. 5).. i i H 0 : pSAMOS = p0i versus H A : pSAMOS ≠ p0i .. Both percentages and results for these tests are shown in Table I. TABLE I HYPOTHESIS TESTS ABOUT THE POPULATION PROPORTIONS. Index 1. PGF 2. PGP 3. PGD. Figure 5: Group Members’ Activity Graph From this chart, group leaders and group nonparticipating members can be easily identified, allowing instructors to immediately activate policies aiming at preventing negative situations such as inefficient or unbalanced distribution of group tasks or student abandonment.. p0. (data) 55% 49% 43%. pSAMOS. (n = 40) 75% (30) 65% (26) 25% (10). 95% CI. p-value. (0.59, 0.87) (0.48, 0.79) (0.13, 0.41). 0.011 0.056 0.025. Using a standard significance level, α = 0.05, we could conclude from the corresponding p-values that those tests associated with indexes 1 and 3 were significant. In other words, statistical evidence supports the idea that the information provided by our system contributed to significantly enhance the PGF and PGD indexes in collaborative e-learning courses offered at the UOC. IX. FUTURE WORK In order to implement and test our system information model, we developed two initial versions of the computer programs EICA and SAMOS. These versions are partially.
(6) Developing an IS for Monitoring Student’s Activity in Online Collaborative Learning based on proprietary software and, furthermore, they present some limitations regarding the generalization of our approach to web platforms other than BSCW. Our current work deals with the development of two open source versions of both programs. These new versions will be completely based on Java and PHP and, moreover, they will be able to read and process log files from several e-learning platforms.. [8] [9]. [10]. X. CONCLUSION Two major related problems in distance learning courses are: (a) to assure that students will reach a satisfactory level of involvement in the learning process, and (b) to avoid high dropout rates caused by the lack of adequate support and guidance. These problems are even more critical in collaborative e-learning scenarios, where individual dropouts or individual low level involvements could force groups to loose cohesion, face anxiety or spend too much time and efforts to rearrange their activities, which may cause a slowdown or even a breakdown of the group’s activity. Monitoring students’ and groups’ activity can be very useful to identify non-participating students or groups with unbalanced distribution of tasks. This identification process, in turn, allows instructors to intervene whenever necessary to ensure and enhance student’s involvement in the collaborative learning process. The monitoring system model presented in this paper has been successfully used to track groups’ and students’ activity in several undergraduate online courses offered at the Open University of Catalonia. These courses involve long-term, project-based collaborative learning practices. Weekly monitoring reports are used by instructors to easily track down the students’ and groups’ activity at specific milestones, gather feedback from the learners and scaffold groups with low degree of activity. Our information system model has proved to be an innovative monitoring tool for our online instructors, since it provides them with prompt and valuable information which adds value to their role as supervisors of the learning process and allows them to offer just-in-time guidance and assistance to students and groups. In our opinion, this model can serve as a practical framework for other universities offering collaborative e-learning courses. REFERENCES [1] [2] [3] [4] [5] [6] [7]. S. Seufert, U. Lechner, and K. Stanoevska., “A Reference Model for Online Learning Communities”. International Journal on E-Learning. 1(1), pp. 43-54, 2002. M. Simonson, S. Smaldino, M. Albright, and S. Zvacek, Teaching and Learning at a Distance. Prentice Hall, Upper Saddle River, NJ, 2003. J. Engelbrecht, and A. Harding, “Teaching undergraduate mathematics on the Internet. Part 1: Technologies and taxonomy”. Educational Studies in Mathematics. 58(2), pp. 235-252, 2005. R. Sweet, “Student Drop-out in Distance Education: An Application of Tinto's Model”. Distance Education. 7, pp. 201-213, 1986. P. Dillenbourg (ed.), Collaborative Learning. Cognitive and Computational Approaches. Elsevier Science, 1999. T. Daradoumis, A. Martínez, and F. Xhafa, “A Layered Framework for Evaluating Online Collaborative Learning Interactions”. International Journal of Human-Computer Studies. 64(7), pp. 622-635, 2006. L. Guerrero, M. Madariaga, C. Collazos, J. Pino, and S. Ochoa, “Collaboration for Learning Language Skills”. In: Proceedings of 11th. [11]. [12]. [13]. [14]. [15]. [16] [17] [18] [19] [20]. 6. International Workshop on Groupware CRIWG’05. Pernambuco, Brazil, pp. 284-291, 2005. G. Joyes, and P. Frize, “Valuing Individual Differences within Learning: From Face-to-Face to Online Experience”. International Journal of Teaching and Learning in Higher Education. 17(1), pp. 33-41, 2005. A. Jeong, “The Combined Effects of Response Time and Message Content on Growth Patterns of Discussion Threads in ComputerSupported Collaborative Argumentation”. Journal of Distance Education. 19(1), pp. 36-53, 2004. C. Reffay, and T. Chanier, “Social Network Analysis Used for Modelling Collaboration in Distance Learning Groups”. In: Proceeding of Intelligent Tutoring System conference (ITS'02). Juin, France, pp. 3140, 2002. A. Martínez, Y. Dimitriadis, B. Rubia, E. Gómez, and P. De la Fuente, “Combining qualitative and social network analysis for the study of social aspects of collaborative learning”. Computers and Education. 41(4), pp. 353-368, 2003. R. Mazza, and C. Milani, “Exploring Usage Analysis in Learning Systems: Gaining Insights from Visualizations”. In: Proceedings of the 12th International Conference on Artificial Intelligence in Education (AIED). Amsterdam, 2005. P. Jerman, A. Soller, and M. Muhlenbrock, “From Mirroring to Guiding: A Review of State of the Art Technology for Supporting Collaborative Learning”. In: Proceedings of EuroCSCL. Maastricht, NL, pp. 324-331, 2001. J. Zumbach, M. Muehlenbrock, M. Jansen, P. Reimann, and U. Hoppe, “Multi-dimensional tracking in virtual learning teams: An exploratory study”. In: Proceedings of the Conference on Computer Supported Collaborative Learning CSCL-2002. Boulder, CO, pp. 650-651, 2002. R. Bentley, W. Appelt, U. Busbach, E. Hinrichs, D. Kerr, S. Sikkel, J. Trevor, and G. Woetzel, “Basic Support for Cooperative Work on the World Wide Web”. International Journal of Human-Computer Studies. 46(6), pp. 827-846, 1997. G. Stahl, Group Cognition: Computer Support for Building Collaborative Knowledge. Acting with Technology Series. MIT Press, Cambridge, MA, 2006. C. Albright, VBA for Modelers: Developing Decision Support Systems Using Microsoft Excel. Duxbury Press, 2006. T. Zapawa, Excel Advanced Report Development. Wiley, New York, NY, 2005. K. Berk, and P. Carey, Data Analysis with Microsoft Excel. Duxbury Press, 2000. D. Montgomery, and G. Runger, Applied Statistics and Probability for Engineers. John Wiley & Sons, New York, NY, 2006..
(7)
Figure
Documento similar
The course has the general objective of developing in the student a critical and coherent sense regarding the pedagogical aspects of the teaching-learning processes in collective
MBOX is a lightweight toolbox for collecting human interactions for collaborative learning scenarios [9]. MBOX utilizes a multilayered architecture taking advantage of the
Curation Practices Multimodal Literacy Critical Dispositions Global Discourses COLLABORATION.?. Searching,
For an online collaboration scenario, MONDO provides an online collaborative modeling tool, where users can open, view and edit models stored in the VCS backends using a web
Specifically, for these types of problems, an optimal classification rule is obtained by balancing the singular terms that appear in the quadratic discriminant in the dense
(a) Evolution of the expected value of the fraction of effective players, exp(S)/N, as a function of rescaled time Kαt, where K is the number of players for each round.. Notice that,
In Figure 18 we present the ratio of the dust luminosity (L dust ) derived from the UV/optical SED fitting to the observed IR luminosity against the current specific SFR.. Objects
The navigation process is very simple: when the user points to a specific node in the learning history the navigator sends to the session server undo and redo events, extracted from
