Real Time Early Detection of Allergic Reactions based on Heart Rate Variability
219
0
0
Texto completo
(2)
(3)
(4) University of Alcalá National University of Ireland, Cork Joint PhD PhD Program in Electronics: Advanced Electronic Systems. Intelligent Systems.. Doctoral Thesis. Real-Time Early Detection of Allergic Reactions based on Heart Rate Variability Raquel Gutiérrez Rivas 2016.
(5)
(6) University of Alcalá National University of Ireland, Cork Joint PhD PhD Program in Electronics: Advanced Electronic Systems. Intelligent Systems.. Real-Time Early Detection of Allergic Reactions based on the Heart Rate Variability Author Raquel Gutiérrez Rivas. Supervisors Professor William P. Marnane (University College Cork) Dr Juan Jesús García Domínguez (University of Alcalá) Head of Department: Professor Nabeel Riza (University College Cork) PhD Program Coordinator: Professor Manuel Mazo Quintas (University of Alcalá). July, 2016.
(7)
(8) A mis padres. Y pensar, pensar que allí nomás, desde donde pa’ cualquier lao se mira adentro, donde la luz y la sombra se juntan pa’ algo más que pa’ que pase un día […] Allí nomás la vi sentada, con sus ojos tan quietos, con el tiempo metido hasta en las uñas, con el sosiego entero escrito en el espinazo: la estatua de carne que enarbola siglos de olvido y de miseria. Me sentí tan pequeño ante tanta grandeza. ¿De qué vale mi canto sin tu algo? José Larralde (1969). Estatua de Carne.. i.
(9)
(10) Agradecimientos. A mi familia, vuestro apoyo y confianza me han empujado a afrontar este (y cada) reto teniendo la certeza de que estaríais sujetándome si algo salía mal. Soy consciente de la suerte que tengo al teneros tan cerca a pesar de los kilómetros y espero hacer que os sintáis orgullosos de mí con cada una de mis decisiones. A Marce, mi ancla con el mundo y el principal sufridor de mis “picos y valles” durante estos cuatro años y unos cuantos más. Gracias por todo: los consejos, los consuelos, las horas de escucha e, incluso, las “reprimendas”. Algún día seré yo la que esté al otro lado y espero poder corresponderte. A David… no hasta dos, ni hasta tres, sino contar conmigo. No creo que sepas cómo ni cuánto me has ayudado ¡gracias compae! A Juan Jesús García Domínguez, por haber puesto su confianza en mí desde mi primer proyecto hace ya más de 7 años. Por las horas de correcciones sacadas de donde no había. Por ver el vaso siempre medio lleno. To Liam Marnane for supporting this thesis and for his advices, corrections and congratulations. To Niall Twomey, Andriy Temko, Emanuel Popovicci, Jonathan Hourihane and people at UCC for their help. Al grupo GEINTRA US&RF del que siempre me sentiré parte, por muy lejos que me vaya. Gracias por la formación transversal y humana. Siempre recordaré con cariño, quién lo habría dicho, las reuniones semanales y los nervios antes de cada presentación. Gracias a los que de una forma u otra han colaborado en este trabajo. A Edel Díaz, que toma el relevo: muchísimo ánimo. A todo el equipo de la sección de alergología del Hospital Universitario de Guadalajara, sin el que esta tesis no podría haberse llevado a cabo. A Arantza Vega Castro, por su implicación y fe en el proyecto. A Isabel y Ana, enfermeras del servicio, por su paciencia y su buena disposición para colaborar en la recolección de datos.. iii.
(11)
(12) RESUMEN. V. Resumen La popularización del concepto “Internet de las cosas” ha fomentado el rápido desarrollo de aplicaciones centradas en la obtención de información relativa a personas. Por este motivo, y gracias a la disponibilidad de la capacidad de cálculo de los Smartphones, a lo largo de los últimos años se han comercializado diversos dispositivos económicos y aplicaciones a través de los que analizar la salud de los usuarios. En esta tesis se propone el uso de la señal electrocardiográfica para la detección precoz de reacciones alérgicas. Con este objetivo, se ha diseñado en primer lugar un nuevo algoritmo de detección de latidos cardiacos capaz de trabajar en tiempo real. La precisión de dicho algoritmo es similar a los propuestos en la literatura, sin embargo, su complejidad computacional y consumo de recursos son muy reducidos, lo que lo hace idóneo para ser empleado en plataformas portátiles de recursos limitados. En un estudio previo, se analizó el efecto que las reacciones alérgicas provocaban en la variabilidad del ritmo cardíaco, demostrando que dicho efecto es detectable incluso antes de la aparición de síntomas físicos en la mayoría de los pacientes alérgicos estudiados. Sin embargo, el método propuesto en dicho trabajo no puede emplearse para detectar alergias en pruebas reales, puesto que la complejidad computacional del modelo diseñado necesita horas de análisis para realizar dicha detección. Además, el estudio se centró únicamente en pruebas de provocación de alergias alimentarias en niños menores de 12 años. En este trabajo se continúa el estudio de la variabilidad del ritmo cardíaco en pacientes realizando pruebas de provocación con dos objetivos principales: el diseño de un algoritmo capaz de detectar alergias en tiempo real, y la extensión del estudio para incluir adultos y pruebas de provocación de alergias a medicamentos. El algoritmo resultante de dicho estudio tiene una precisión similar al propuesto en el trabajo previo, así como la reducción de la cantidad de alérgeno que los pacientes alérgicos deben consumir y de la duración de las provocaciones. Sin embargo, la nueva propuesta puede implementarse en un dispositivo autónomo y portátil y, lo que es más importante, es capaz de realizar las detecciones de reacciones alérgicas en tiempo real. A pesar de que los resultados obtenidos son prometedores, este estudio debe interpretarse como el inicio de una investigación mayor, puesto que es necesario emplear más tiempo y esfuerzo en la adquisición de nuevos datos para obtener una muestra representativa de toda la población de pacientes alérgicos a alimentos y medicamentos..
(13)
(14) ABSTRACT. VII. Abstract The popularisation of the concept of “Internet of Things” has promoted the fast increase of applications focused on obtaining information regarding people. For this reason, and thanks to the availability of the computing capacity of smartphones, over the last years a large number of low cost devices and applications have been marketed for analysing the health of users. In this thesis it is proposed to use ECG signals for early detection of allergic reactions. With this aim, a new QRS complex detection algorithm able to work in real time has been designed. This algorithm achieves an accuracy similar to those proposed by other authors, by reducing their computational complexity and the needed resources, which make it able to be implemented in portable platforms. In a previous study the effect that the occurrence of an allergic reaction causes in the heart rate variability was analysed, showing that it is noticeable even before the appearance of physical symptoms in most of the cases in which patients suffered an allergic reaction. However, the method proposed in this previous study is not suitable for detecting allergic reactions during real tests, since the computational complexity of the model designed requires hours of analysis to perform that detection. Moreover, the previous study only focused on food provocation tests in children under 12 years old. The study of the heart rate variability of allergic and non-allergic patients during provocation tests is continued in this work, with two main objectives: the designing of an algorithm capable of detecting allergic reactions in real time, and the extension of the study to include adults and drug provocation tests. The resulting algorithm has an accuracy similar to that proposed in the previous work and the achieved dose and length reduction of the provocation tests is similar as well. However, this algorithm is able to be implemented in a standalone portable device with limited resources and, what is more important, to perform the allergy reactions detection in realtime. Although the results are promising, this study should be interpreted as the beginning of further research, since it is necessary to spend more time and effort in acquiring new data to get a representative sample of the entire population of allergic patients in the case of both food and drug allergies..
(15)
(16) CONTENTS. IX. Contents Chapter 1.. Introduction ........................................................................................................... 1. Structure of the thesis ................................................................................................................................... 3 Thesis Background ......................................................................................................................................... 5. Chapter 2.. Background, Problem Statement and Objectives ..................................... 7. Basics of QRS complex detection .............................................................................................................. 8 2.1.1. The electrocardiographic signal .........................................................................................................................9. 2.1.2. ECG sources of noise, interferences and artefacts ................................................................................... 11 Power-line interference ....................................................................................................................................................... 12 Motion artefact ......................................................................................................................................................................... 14 Muscle noise .............................................................................................................................................................................. 16 Wandering baseline ............................................................................................................................................................... 16. 2.1.3. QRS complex detection structure .................................................................................................................... 17 Pre-processing techniques ................................................................................................................................................. 18 R-peaks detection techniques ........................................................................................................................................... 21. Heart Rate and Heart Rate Variability ................................................................................................. 24 Introduction to allergies and allergy detection ............................................................................... 27 Previous work ............................................................................................................................................... 30 2.4.1. Dataset ......................................................................................................................................................................... 30. 2.4.2. Feature set ................................................................................................................................................................. 32. 2.4.3. Automated allergy detection ............................................................................................................................. 34. Problem statement and Thesis objectives ......................................................................................... 37. Chapter 3.. QRS Complex Detection ................................................................................... 41. Benchmark databases ................................................................................................................................ 43 Metrics .............................................................................................................................................................. 44 Pan & Tompkins’ algorithm ..................................................................................................................... 45 3.3.1. Pre-processing stage ............................................................................................................................................. 45. 3.3.2. Thresholding stage ................................................................................................................................................ 48. 3.3.3. Search-back stage ................................................................................................................................................... 49.
(17) Proposed QRS detection algorithm ....................................................................................................... 50 3.4.1. Pre-processing stage ............................................................................................................................................. 51. 3.4.2. R peaks detection stage ....................................................................................................................................... 52. 3.4.3. Parameter selection............................................................................................................................................... 54. QRS complex detection evaluation ........................................................................................................ 56 3.5.1. Accuracy evaluation using floating-point representation .................................................................... 56. 3.5.2. Accuracy evaluation using fixed-point representation ......................................................................... 64. 3.5.3. Computational complexity evaluation .......................................................................................................... 64. 3.5.4. Fixed point implementation .............................................................................................................................. 68. Conclusions ..................................................................................................................................................... 69. Chapter 4.. Automated Allergy Detection ........................................................................ 71. Evaluation methods ..................................................................................................................................... 72 4.1.1. T-value and p-value analysis ............................................................................................................................. 72. 4.1.2. Area under the Receiver Operating Characteristic curve (AUC) ....................................................... 74. HRV feature selection ................................................................................................................................. 76 4.2.1. Diagnostic ability study ....................................................................................................................................... 76. 4.2.2. Complexity analysis ............................................................................................................................................... 81. 4.2.3. Feature selection .................................................................................................................................................... 83. Allergic reaction detection algorithm .................................................................................................. 85 Results ............................................................................................................................................................... 88 Conclusions ..................................................................................................................................................... 91. Chapter 5.. Artefact Detection and Positioning ............................................................. 93. Introduction to the new trial ................................................................................................................... 94 5.1.1. Differences between protocols ......................................................................................................................... 94. 5.1.2. Data collection set-up ........................................................................................................................................... 95. Test of the Allergy Detection algorithm .............................................................................................. 97 Movement artefact reduction ............................................................................................................... 100 5.3.1. First approach: Measurement of the chest movement ....................................................................... 101. 5.3.2. Second approach: Detecting subject posture and activity ................................................................ 107 Pocket Navigation system ................................................................................................................................................ 107 Test of the Pocket Navigation System ........................................................................................................................ 110. Conclusion .................................................................................................................................................... 114.
(18) CONTENTS. Chapter 6.. XI. Extension of the Algorithm Application .................................................. 117. Description of the new dataset .............................................................................................................118 Analysis of the new dataset ...................................................................................................................120 6.2.1. Group [Children, Drugs] ................................................................................................................................... 120. 6.2.2. Group [Adults, Food] .......................................................................................................................................... 121. 6.2.3. Group [Adults, non-NSAID] ............................................................................................................................. 122. 6.2.4. Group [Adults, NSAID] ....................................................................................................................................... 123. Adaptation of the allergy detection ....................................................................................................125 Conclusions ...................................................................................................................................................128. Chapter 7.. Conclusions and Future Works .................................................................. 131. Contributions ...............................................................................................................................................131 7.1.1. Novel real-time QRS complex detection algorithm .............................................................................. 131. 7.1.2. Development of an algorithm based on HRV for the early detection of allergy reactions .. 132. 7.1.3. Study of the HRV signal in adults and children exposed to food and drugs allergens .......... 133. Future Works ...............................................................................................................................................134 Publications Derived from the Thesis ...............................................................................................135 7.3.1. International Journals ....................................................................................................................................... 135. 7.3.2. International Conferences ............................................................................................................................... 135. Appendix A – HRV Features ..................................................................................................... 137 A.1 Time domain features ...................................................................................................................................138 A.1.1 Mean Heart Rate Variability ................................................................................................................................. 138 A.1.2 Standard Deviation ................................................................................................................................................... 138 A.1.3 Coefficient of Variation ........................................................................................................................................... 138 A.1.4 Root Mean Square ..................................................................................................................................................... 138 A.1.5 NN50, pNN50, pNN25 ............................................................................................................................................. 139 A.1.6 Histogram Index ........................................................................................................................................................ 139 A.1.7 Positive and Negative trends (STPP, STNN) .................................................................................................. 140. A.2 Graphical domain features ..........................................................................................................................140 A.3 Frequency domain features ........................................................................................................................141.
(19) Appendix B – SoC-based architecture for the proposed QRS complex detection algorithm ........................................................................................................... 143 B.1 Low-level peripheral ..................................................................................................................................... 144 B.2 High-level peripheral .................................................................................................................................... 147 B.3 Test of the proposed architecture ........................................................................................................... 147. Appendix C – t-value level of significance limit depending on the degree of freedom ............................................................................................................................... 149 Appendix D – Mean HRV of the subjects from the CUH database during the OFCs ............................................................................................................................... 151. Appendix E – Ethical approval documents ........................................................................ 161 Appendix F – Informed consents ........................................................................................... 175 F.1 Informed consent for a Food Allergy Test ............................................................................................ 176 F.2 Informed consent for a Drug Allergy Test ............................................................................................ 178 F.3 Informed consent for the data collection process ............................................................................. 180. Bibliography 183.
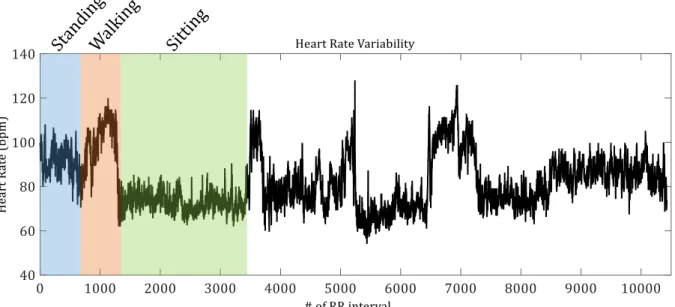
(20) LIST OF FIGURES. XIII. List of Figures Figure 2.1-1. Left: anatomy of the human heart [Ownw00]; Right: electrical system of the heart [Madh06] 9 Figure 2.1-2. ECG peaks, waves and interval representation ............................................................................................. 10 Figure 2.1-3. Example of the ECG signal during the occurrence of an atrial flutter. Subject iaf5 from the Intracardiac Atrial Fibrillation (iafdb) Database in [GAGH00]. The wrong activation of atria electrical nodes, makes them produce additional heartbeat. ....................................................................... 11 Figure 2.1-4. Example of the ECG signal during an atrial fibrillation. Subject iaf2 from the Intracardiac Atrial Fibrillation (iafdb) Database in [GAGH00]. The atria contract very fast and irregularly, provoking an irregular heartbeat and a desynchronization with the ventricles. ....................................................... 11 Figure 2.1-5. Power spectra of the main waves of the ECG signal, muscle noise and motion artefacts based on an average 150 beats. Figure extracted from [Afon93]. ............................................................................ 12 Figure 2.1-6. Einthoven Triangle configuration ....................................................................................................................... 12 Figure 2.1-7. ECG signal with 50 Hz interference .................................................................................................................... 13 Figure 2.1-8. Features of the notch filter ..................................................................................................................................... 13 Figure 2.1-9. ECG filtered with a notch filter ............................................................................................................................. 13 Figure 2.1-10. Motion artefact effect ............................................................................................................................................. 14 Figure 2.1-11. ECG without LL, LA or RA electrode ................................................................................................................ 15 Figure 2.1-12. ECG spectrum without LL, LA or RA electrodes ......................................................................................... 15 Figure 2.1-13. ECG with muscle noise .......................................................................................................................................... 16 Figure 2.1-14. Wandering baseline effect ................................................................................................................................... 17 Figure 2.1-15. Structure of a QRS complex detector algorithm ........................................................................................ 18 Figure 2.1-16. Wavelet denoising example ................................................................................................................................ 19 Figure 2.1-17. Wavelet coefficients and denoised wavelets ............................................................................................... 19 Figure 2.1-18. Example of Hilbert Transform of an ECG signal......................................................................................... 20.
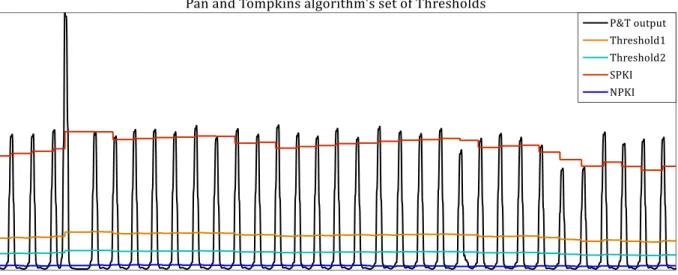
(21) Figure 2.1-19. EMD de-noising example...................................................................................................................................... 22 Figure 2.1-20. Example of the Empirical Mode Decomposition of an ECG signal into 5 Intrinsic Mode Functions .............................................................................................................................................................................. 22 Figure 2.1-21. Example of pre-processing stage ...................................................................................................................... 23 Figure 2.1-22. Result of the pre-processing stage ................................................................................................................... 24 Figure 2.1-23.Example of double adaptive threshold and detection of the R peaks ............................................... 24 Figure 2.2-1. Heart Rate Variability of a healthy subject performing different physical activities. .................. 25 Figure 2.3-1. Example of immediate hypersensitivity skin test or prick test (left, extracted from [Beea00]) and delayed hypersensitivity test preparation (right, extracted from [Grou15]) ............................... 28 Figure 2.3-2. Flowchart of an Oral Food Challenge (OFC) at CUH ................................................................................... 30 Figure 2.4-1. Modified OFC process ............................................................................................................................................... 32 Figure 2.4-2. Epoch definition for the computation of each feature ............................................................................... 34 Figure 2.4-3. Block diagram of the automated allergy detection based in the analysis of the 18 features of the HRV signal proposed in [Twom13] ................................................................................................................... 35 Figure 2.4-4. Example of likelihood signal achieved with the novelty classifier for an allergic subject ......... 36 Figure 2.4-5. Example of likelihood signal achieved with the novelty classifier for a non-allergic subject .. 36 Figure 2.5-1. Groups for the allergy detection study ............................................................................................................. 39 Figure 3.3-1. Block diagram of the Pan & Tompkins algorithm ........................................................................................ 46 Figure 3.3-2. Pan & Tompkins QRS detection algorithm block diagram ....................................................................... 46 Figure 3.3-3.Signals generated during the pre-processing stage of the Pan and Tompkins algorithm .......... 47 Figure 3.3-4. Input and output of the pre-processing stage ............................................................................................... 47 Figure 3.3-5. Comparison between ECG and pre-processed signal without delays ................................................. 48 Figure 3.3-6. Example of Pan and Tompkins algorithm's Signal and noise level estimation and set of Thresholds ........................................................................................................................................................................... 49.
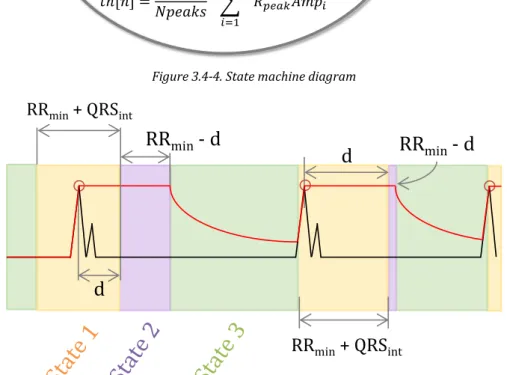
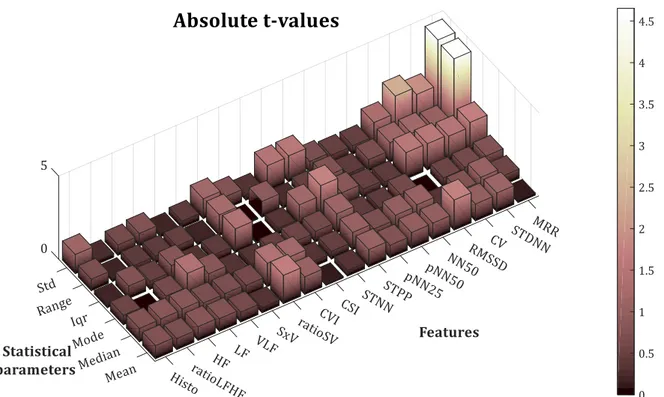
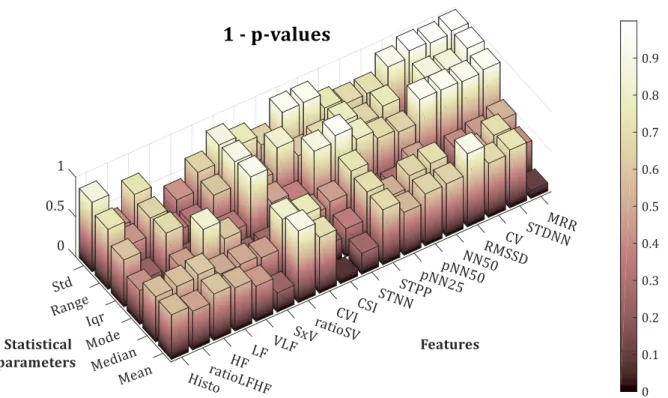
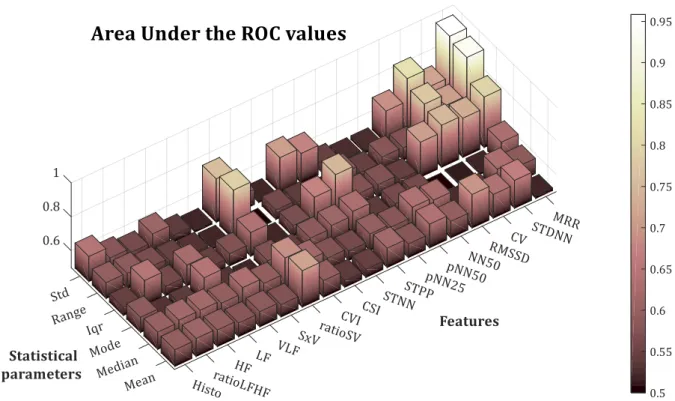
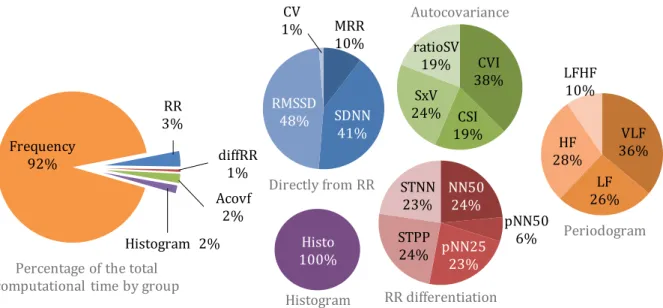
(22) LIST OF FIGURES. XV. Figure 3.3-7. Search-back technique example .......................................................................................................................... 50 Figure 3.4-1. Block diagram of the proposed QRS complex detection algorithm ..................................................... 51 Figure 3.4-2.Block diagram of the pre-processing stage ...................................................................................................... 51 Figure 3.4-3. Pre-processing result................................................................................................................................................ 52 Figure 3.4-4. State machine diagram ............................................................................................................................................ 53 Figure 3.4-5. Correspondence between the FSM states and the ECG phase ................................................................ 53 Figure 3.4-6. Proposed algorithm's parameters v. sampling frequency ....................................................................... 55 Figure 3.4-7. Definition of R-peak slope interval ..................................................................................................................... 55 Figure 3.5-1. Example of ECG signal, x [n], with motion artefacts. Subject 3 of the ADB database ................... 61 Figure 3.5-2. Pan & Tompkins. QRS complex detection for record no. 100 (Se=100%; +P=100%; F S=200 Hz) ................................................................................................................................................................................................... 62 Figure 3.5-3. Proposed algorithm. QRS complex detection for record no. 100 (Se=100 %; +P=100 %; F S=360 Hz) ........................................................................................................................................................................................... 62 Figure 3.5-4. Pan % Tompkins. QRS complex detection for record no. 108 (Se=98.525 %; +P=88.083 %; FS=200 Hz) ........................................................................................................................................................................... 63 Figure 3.5-5. Proposed algorithm. QRS complex detection for record no. 108 (Se=98.411 %; +P=95.96 %; FS=360 Hz) ........................................................................................................................................................................... 63 Figure 4.1-1. Example of ROC curves with different AUC .................................................................................................... 75 Figure 4.2-1. T-value for the six statistical parameters for the studied HRV features............................................ 77 Figure 4.2-2. (1 - p-value) of the six statistical parameters for the studied HRV features.................................... 78 Figure 4.2-3. AUC for the six statistical parameters for the studied HRV features .................................................. 80 Figure 4.2-4. Relative computational time needed to compute each feature ............................................................. 82 Figure 4.2-5. Comparison between mean HRV of allergic (red) and non-allergic (blue) subjects using (a) mean, (b) median, (c) mode, (d) range, (e) standard deviation and (f) interquartile range ........... 83.
(23) Figure 4.2-6. AUC, p-value, t-value of the standard deviation of all the features and relative computational time needed to obtain them. ........................................................................................................................................ 84 Figure 4.2-7. ECG (a); Heart Rate Variability (b), and mean Heart Rate Variability signal examples .............. 84 Figure 4.3-1. MRR signal of an allergic (a) and a non-allergic (b) subject. Purple dotted line represents the mean value of the MRR signal during each “background” period, or MBG signal. ............................... 85 Figure 4.3-2. Flow chart of the proposed allergy detection algorithm .......................................................................... 87 Figure 4.3-3. Normalized MRR (NMRR) signal for an allergic (a) and a non-allergic (b) subject...................... 87 Figure 4.3-4. Maximum MeanPeak value for each subject of the Allergy Database ................................................. 88 Figure 4.4-1. Subject 18's mean HRV signal during the OFC .............................................................................................. 91 Figure 5.1-1. Shimmer3 unit and orientation of the inertial sensors ............................................................................. 97 Figure 5.2-1. PDF of the standard deviation of the MRR for the training and testing datasets .......................... 98 Figure 5.2-2. ROC of the standard deviation of the new dataset ...................................................................................... 99 Figure 5.2-3. MRR signal of the subject GU053 ........................................................................................................................ 99 Figure 5.3-1. Example of MRR signal variations depending on the subject's physical activity or posture: standing (red), sitting (purple), walking (green), walking downstairs (cyan) and walking upstairs (orange).............................................................................................................................................................................. 101 Figure 5.3-2. Example of False Positive due to the presence of movement artefacts. a) MRR signal of the Subject GU069; b) Movement of the subject; and c) MRR signal corrected with the movement with GAcc=50 ............................................................................................................................................................................. 103 Figure 5.3-3. Sensitivity and Specificity obtained depending on GAcc and Th values ......................................... 104 Figure 5.3-4. Time gain obtained with several combinations of GAcc and Th parameters ............................... 104 Figure 5.3-5. Maximum MeanPeak value comparison between allergic and non-allergic subjects, before and after the artefact reduction ....................................................................................................................................... 105 Figure 5.3-6. MRR of the subjects GU118 during the OFC, corrected using the chest movement .................. 106 Figure 5.3-7. Accel of subject GU118 during the OFC ......................................................................................................... 106.
(24) LIST OF FIGURES. XVII. Figure 5.3-8. Shimmer allocation for the second approach ............................................................................................. 107 Figure 5.3-9. Block diagram of the inertial pocket navigation system. ....................................................................... 108 Figure 5.3-10. Roll, Pitch and Yaw angles definition ........................................................................................................... 109 Figure 5.3-11. Example of pitch angle depending on the subject posture and physical activity; (cyan) seated, (red) standing, (blue) walking, (green) walking upstairs and (purple) walking downstairs. ..... 110 Figure 5.3-12. Trajectory followed by the subject during the testing experiment. ............................................... 111 Figure 5.3-13. The upper subfigure shows the pitch angle estimation for the 10-minutes-walk at the hospital. The lower subfigure shows the MRR signal, measured in beats per minute, for the same walk. ................................................................................................................................................................................................ 111 Figure 5.3-14. MRR signal of the subject with which the Pocket Navigation System was tested ................... 112 Figure 5.3-15. Pitch angle and physical activity classification during the first false alarm ............................... 113 Figure 5.3-16. Pitch angle and physical activity classification during the second false alarm ......................... 113 Figure 5.3-17. Pitch angle estimation and physical activity classification during the third and fourth false alarms.................................................................................................................................................................................. 113 Figure 6.1-1. Classification of the subjects from the database ....................................................................................... 119 Figure 6.2-1. PDF of the MRR’s standard deviation of allergic and non-allergic children exposed to food, and non-allergic children exposed to drugs................................................................................................................ 121 Figure 6.2-2. PDF of MRR’s standard deviation of adults and children exposed to food .................................... 122 Figure 6.2-3. PDF of MRR’s standard deviation of adults exposed to food and non-NSAID .............................. 123 Figure 6.2-4. PDF of MRR’s standard deviation of adults exposed to non-NSAID and NSAID.......................... 124 Figure 6.3-1. PDF of the Children group ................................................................................................................................... 126 Figure 6.3-2. PDF of the group [Adults, non-NSAID] including food ........................................................................... 126 Figure 6.3-3. PDF of the [Adults, NSAID] group .................................................................................................................... 126 Figure 6.4-1. Division of the database subjects depending on the algorithm's results ....................................... 129.
(25) Figure A- 1. Example of HRV histogram and Histogram index computation ........................................................... 139 Figure A- 2. Representation of the relationship between the difference between each RR pair and the previous one ..................................................................................................................................................................... 140 Figure A- 3. Representation of the relationship between the difference between each RR pair and the previous one ..................................................................................................................................................................... 141 Figure A- 4. Example of Power spectrum in the VLF, LF and HF bands ..................................................................... 142. Figure B- 1. General block diagram of the proposed SoC architecture ...................................................................... 145 Figure B- 2. Block diagram of the proposed low-level peripheral ............................................................................... 145 Figure B- 3. Block diagram of the configurable FIR filter ................................................................................................ 145 Figure B- 4. Block diagram of the moving average block ................................................................................................. 146.
(26) LIST OF TABLES. XIX. List of Tables Table 2.4-1. Main features of the test from which the ECG signals of the database used were extracted ..... 31 Table 3.1-1. Databases used to test the algorithm performance ...................................................................................... 43 Table 3.4-1. ADB and NSRDB obtained results ......................................................................................................................... 55 Table 3.5-1. Results of the proposed QRS detection algorithm with the MITDB ...................................................... 57 Table 3.5-2. Results of the Pan & Tompkins algorithm with the MITDB ...................................................................... 58 Table 3.5-3. Comparison of accuracy results for some proposals with the full MITDB databases ................... 59 Table 3.5-4. Comparison of accuracy results for some proposals with several signals of the MITDB databases ................................................................................................................................................................................................... 59 Table 3.5-5. Comparison between P&T and proposed algorithm performances over all the databases ....... 60 Table 3.5-6. Results of the fixed-point version of the proposed QRS detection algorithm with the MITDB 65 Table 3.5-7. Results of the fixed-point version of the P&T algorithm with the MITDB .......................................... 66 Table 3.5-8. Relative error computation for the different signals involved in the QRS complex detection algorithm .............................................................................................................................................................................. 67 Table 3.5-9. Relative error computation for the different signals involved in the P&T QRS detection ........... 67 Table 3.5-10. Resource consumption of both algorithms .................................................................................................... 68 Table 3.5-11. Resource consumption of the proposed algorithm in a FPGA ............................................................... 68 Table 3.5-12. Comparison of the obtained result with the floating-point implementation of the proposed algorithm and the fixed-point version implemented in the FPGA .............................................................. 68 Table 4.1-1. Statistical parameters used for evaluating each HRV feature .................................................................. 75 Table 4.2-1. T-values obtained with the performed t-test for the 6 statistical parameters of the HRV features ................................................................................................................................................................................................... 78 Table 4.2-2. P-values (·10-3) obtained with the performed t-test for the 6 statistical parameters of the HRV features .................................................................................................................................................................................. 79.
(27) Table 4.2-3. Confidence level obtained with the performed t-test for the 6 statistical parameters of the HRV features .................................................................................................................................................................................. 79 Table 4.2-4. AUC obtained for the 6 statistical parameters of the HRV features ...................................................... 81 Table 4.3-1. Statistical differences between an allergic subject and a non-allergic one ........................................ 86 Table 4.4-1. Performance of the Allergy detection algorithm............................................................................................ 89 Table 4.4-2. Statistical parameters of subjects 14 and 15 ................................................................................................... 90 Table 5.1-1. Features of the new dataset .................................................................................................................................... 96 Table 5.2-1. Results obtained with the new dataset .............................................................................................................. 98 Table 5.3-1. Results of the allergic reactions detection algorithm with the artefact reduction ...................... 105 Table 6.1-1. Subjects (Allergic/non-allergic) divided by age and type of allergen ............................................... 118 Table 6.1-2. Prevalence of allergic subjects depending on their age and the type of allergen ......................... 120 Table 6.2-1. Mean and standard deviation of each one of the groups analysed in this chapter ...................... 124 Table 6.3-1. Evaluation of the standard deviation of the mean HRV depending on the group ........................ 125 Table 6.3-2. Evaluation of the allergy detection algorithm with the defined groups ........................................... 127. Table B- 1. Datapath dimensions in the proposed architecture ................................................................................... 148 Table B- 2. Resource consumption of the proposed system in a Zynq XC7Z010 FPGA ...................................... 148 Table B- 3. Comparison between the results obtained with the floating-point version of the proposed QRS complex detection algorithm and with the proposed SoC architecture ................................................ 148.
(28) LIST OF ACRONYMS. List of Acronyms +P. Positive predictivity. ADB. Allergy Database. ANS. Autonomic Nervous System. AUC. Area Under the Curve. AV. Atrioventricular. BIH. Beth Israel Hospital arrhythmia laboratory. bpm. beats-per-minute. BSN. Body Sensor Network. CHn. Channel n. CNS. Central Nervous System. CSI. Cardiac Sympathetic Index. CUH. Cork University Hospital. CV. Coefficient of Variation. CVI. Cardiac Vagal Index. CWT. Continuous Wavelet Transform. DWT. Discrete Wavelet Transform. ECG. Electrocardiogram. EMD. Empirical Mode Decomposition. FFT. Fast Fourier Transform. FN. False Negative. FP. False Positive. Fs. Sampling frequency. FSM. Finite-State Machine. GMM. Gaussian Mixture Model. GUH. Guadalajara University Hospital. HF. High Frequency. HPF. High-Pass Filter. HR. Heart Rate. HRV. Heart Rate Variability. IgE. Immunoglobulin E. IMF. Intrinsic Mode Function. XXI.
(29) IMU. Inertial Measurement Unit. IQR. Interquartile Range. LA. Left Arm. LF. Low Frequency. LFHF. ratio Low Frequency to High Frequency. LL. Left Leg. LOO. Leave One Out. LPF. Low-Pass Filter. MBG. Mean Background. MI. Myocardial Infarction. MIT. Massachusetts Institute of Technology. MITDB. MIT-BIH Arrhythmia Database. MRR. Mean RR. NMRR. Normalised Mean RR. NPKI. Noise Peak Level. NSAID. NonSteroidal Anti-Inflammatory. NSRDB. MIT-BIH Normal Sinus Rhythm Database. OC. Oral Challenge. OFC. Oral Food Challenge. P&T. Pan & Tompkins. PDF. Probability Density Function. PMV. Predicted Mean Vote. PNS. Parasympathetic Nervous System. QSWT. Quadratic Spline Wavelet Transform. RA. Right Arm. RMSSD. Root Mean Square of the Difference between adjacent RR intervals. ROC. Receiver Operating Characteristic. RRHL. RR High-Limit. RRLL. RR Low-Limit. RRML. RR Missed-Limit. SA. Sinoatrial. Se. Sensitivity. SNS. Sympathetic Nervous System.
(30) LIST OF ACRONYMS. SoC. System on Chip. SPKI. Signal Peak Level. SpO2. Peripheral capillary Oxygen Saturation. STD. Standard Deviation. STDNN. Standard Deviation of the RR intervals. STNN. Sequential Trend Negative. STPP. Sequential Trend Positive. SWT. (discrete) Stationary Wavelet Transform. TG. Time Gain. TN. True Negative. TP. True Positive. UKF. Unscented Kalman Filter. VLF. Very-Low Frequency. WT. Wavelet Transform. XXIII.
(31) Lista de Acrónimos Es. Especificidad. FC. Frecuencia Cardíaca. FN. Falso Negativo. FP. Falso Positivo. MVC. Media de la Variabilidad Cardíaca. PdE. Prueba de Exposición. SatO2. Saturación de Oxígeno (en sangre). Se. Sensibilidad. TA. Tensión Arterial. VC. Variabilidad Cardiaca. VN. Verdadero Negativo. VP. Verdadero Positivo. VP-. Valor Predictivo Negativo. VP+. Valor Predictivo Positivo.
(32) Chapter 1.. INTRODUCTION The level of miniaturizing of electronic devices achieved during the last 30-40 years has led to the development of portable devices that are able to perform relatively complex tasks, powered by a battery, operating with increasing autonomy. This fact has had a significant impact on most areas of technological development. However, the areas to benefit most are the ones related to remote monitoring. As a result, the so-called “motes” have emerged [YaSQ13]. These devices, in their most basic version, include a power source, a microcontroller, a transceiver and one or more sensors. The reason for their popularity is that they solve big challenges with systems that do not affect the environment they are deployed in, such as industrial processes monitoring [JZLQ15], environment control [SLYJ14] or smart spaces development [TeEB15]. One of the areas to benefit most from this evolution is that of medicine, since the appearance of these devices has encouraged the emergence of several technological proposals. Although motes do not automate the diagnosis, they greatly reduce the time required and facilitate the work of the medical staff. The use of devices and applications for remote patient monitoring (or Telemedicine) does not affect negatively to any extent the standard procedures followed in hospitals. On the contrary, these systems add a large number of advantages for both hospitals and patients as they allow the continuous and remote access to different physiological parameters..
(33) Real-Time Detection of Allergic Reactions based on Heart Rate Variability Raquel Gutiérrez Rivas. Besides, in some cases patients will be able to stay in their own homes during monitoring with a higher level of mobility. This will significantly increase their quality of life and reduce waiting lists, the economic costs of the hospitals and the workload of the medical staff. In general, a telemedicine system is provided with some intelligence, that allows, among others, the signal filtering, the signal conditioning and the analysis of the measurements made on those parameters. It is also possible to add other features such as the ability to locate patients, generate alarms, etc. Thus, telemedicine systems provide two main advantages: on the one hand, the quantity and quality of the extracted information is larger than the one obtained nowadays, which greatly helps doctors; on the other hand, they significantly increase the patient safety, since the control of their health can be as comprehensive as necessary. Although the doctors should always make the last decision, the inclusion of computational intelligence in the monitoring systems can simplify the diagnosis processes in a very significant way. The use of motes implies, however, some drawbacks. Due to the fact that they are powered by a battery, and the resources are usually limited, it is necessary to reduce as much as possible the computational complexity of their firmware. The tasks that they can carry out have a limited complexity as well. Besides, the applications in which they are usually employed, have real-time requirements which need to be taken into consideration. This thesis is focused on remote monitoring of patients, or telemedicine systems[JiCh15]. Several works have been published in the area of the analysis, control and/or monitoring of people’s health thanks to the consolidation of “Internet of things” [TrDu15]. In this area many parameters regarding the state of people’s health have been used for, among other applications: increasing the elderly safety by monitoring their motion [SuMu14]; analysing the evolution of a particular disease by measuring one physiological parameter [PBDT14]; or analysing the behaviour, increasing the comfort of the users of smart spaces or saving the energy consumption of the elements controlled by smart spaces by acquiring a large quantity of information [HJHJ15]. Particularly, in this work the health of patients will be observed through the measurement of their electrocardiographic signal (ECG). Due to its importance and the easiness to measure it, the ECG is one of the most studied physiological signals. It is possible to observe, not only the cardiovascular system state, but also the behaviour of different physiological systems through the analysis of the Heart Rate Variability (HRV) signal, which represents the time intervals between consecutive heartbeats. In this thesis, the relationship between HRV variations and the existence of allergic reactions will be studied..
(34) Chapter 1. Introduction. 3. Structure of the thesis. Nowadays, the gold standard for the detection of allergies is the so called provocation tests, in which the patients are required to take some doses of the suspected allergen. The danger of this process could be reduced by detecting the allergies before the appearance of the physical symptoms. A previous investigation carried out by Niall Twomey at University College Cork (Ireland) [Twom13] demonstrated that it is possible to relate variances of the HRV with the existence of allergic reactions, and, what is more important, that it is possible to detect them before the health of the patient is compromised. However, that process was not able to work in real-time due to its computational complexity, and so, the early detection could not be achieved during the provocation tests. This thesis proposes the continuous monitoring of the ECG for the early detection of allergies in real-time during the provocation tests. With this aim, information regarding the performance of the heart will be extracted from this signal during several provocation tests, and the differences between allergic and non-allergic patients will be defined and used for the development of an allergy alarm system. This novelty implies the reduction of the risk the patients are exposed to by warning the medical staff before the allergy reactions are noticeable.. Structure of the thesis The rest of this thesis is organized as follows: . Chapter 2: “Background, Problem Statement and Objectives”. In this chapter, the basics of the knowledge areas covered by this thesis are introduced. The main concepts of heartbeat detection are explained here: how the ECG signal is generated, the main noises that complicate the heartbeat detection, the state of the art on detection algorithms, etc. Then, the importance of the HRV signal is shown through the analysis of several current works in which this signal is employed in a variety of applications. The concepts of allergy and the allergy diagnostics methods used nowadays are outlined next. The previous work carried out at University College Cork is summarized in this chapter. The specific problems that comprise the motivation of this work, such as the need for computationally efficient algorithms, real-time requirements or portable devices constraints, are listed and finally the objectives of this thesis are introduced..
(35) Real-Time Detection of Allergic Reactions based on Heart Rate Variability Raquel Gutiérrez Rivas. . Chapter 3: “QRS Complex Detection”. In this chapter, a novel real time heartbeat detection algorithm for use in low resource hardware “motes” is proposed. With this algorithm, it is possible to obtain a sensitivity and specificity above 99.5% with a reduced computational complexity. The algorithm has been tested over standard and non-standard databases, sampled at different frequencies for patients with different health conditions. All these tests allow the performance of the proposed algorithm to be verified under different conditions and a comparison made to the results of other methods.. . Chapter 4: “Automated Allergy Detection”. As a first contribution, in this chapter the set of HRV features used in the previous work for the detection of allergic reactions is analysed in order to classify the 18 features of the set depending on their computational complexity and diagnostic ability. The results provided by these tests make it possible to distinguish between the features that give information related to allergic reactions and those that can be considered useless for this application. This study has been performed on a dataset obtained during the initial study that consists of 23 children who underwent a food allergy provocation test at Cork University Hospital. Once the proper feature has been selected, it should be studied how an allergy reaction affects it. This study leads to the second contribution of Chapter 4, which is the proposal of a novel real-time early detection of allergies. In Chapter 4 this algorithm is explained, as well as the results obtained with the 23 subjects that compose the database.. . Chapter 5: “Artefact detection and Positioning”. The algorithm presented in the previous chapter has been tested during food allergy provocation tests (Oral Food Challenges, OFC) with patients that were required to remain on a bed during the tests. However, depending on the hospital and the medical protocol, the subjects may be able to move freely. This condition will affect the performance of the proposed allergy detection algorithm and so, its effects need to be defined. With this aim, another dataset has been recorded at the Guadalajara University Hospital (Spain) where the patients are not confined to a bed during the OFC. This chapter investigates the differences arising from these two situations, which are mainly provoked by the patients’ movement. The effect of movement on the HRV signal can be considered here as an artefact..
(36) Chapter 1. Introduction. 5. Thesis Background. Two artefact-reduction methods are proposed in this chapter: firstly, the absolute movement of the patients is measured by placing a 3-axis accelerometer on the chest. The second solution consists of placing an Inertial Measurement Unit (IMU) in the patients’ pocket in order to detect the physical activity they are performing. Thus, this chapter provides two contributions. First one is the proposal of an early detection algorithm based on the HRV and movement of the subjects; second one is an early detection algorithm based on the HRV and movement of the patients and the ability to track their position during the OFCs. . Chapter 6: “Extension of the Study”. This chapter investigates the allergy detection performance when the target of the study is changed in different ways. During the data collection, the ECG signal of adults undergoing OFC, as well as children and adults exposed to drug allergies provocation tests have been acquired. In this Chapter, the features of those groups are analysed and the allergy detection algorithm is tested with them. However, as will be explained, a big effort needs to be made in this way to establish a detection pattern for each one of the groups based on the HRV response to allergens in the case of allergic patients. Thus, the results provided by this chapter can be taken into account as the starting point to further research in this area.. . Chapter 7: “Conclusions and Future Works”. This chapter presents the most significant conclusions of this thesis, and the publications derived from it are listed. Finally, some research lines that might be investigated in the future are proposed.. Thesis Background This thesis has been carried out as a joint PhD between the Electronics Department of the University of Alcalá (Spain) and the Electric and Electronic Department of University College Cork (Ireland). It has been developed under the auspices of the research projects LEMUR (ref. TIN200914114-C04-01) and LORIS (ref. TIN2012-38080-C04-01), both supported by the Spanish Ministry of Science and Innovation. It has also been economically supported by the University of Alcalá grant program FPI/UAH (ref. FPI/UAH2012) and by the University of Alcalá mobility program. Three research stays were carried out thanks to the mobility program, all of them at University College Cork, in Ireland..
(37) Real-Time Detection of Allergic Reactions based on Heart Rate Variability Raquel Gutiérrez Rivas. One of the goals of LEMUR and LORIS projects was the development of cooperative systems for the positioning of people and mobile robots in diverse environments. The research presented in this thesis was carried out as part of the subtask named “integration of the positioning networks with another networks (BSN and Smart grid)”, in particular with the interaction of the positioning networks with Body Sensor Networks (BSN). The thesis describes original work developed at the GEINTRA Research Group of the University of Alcalá and at the Biomedical Engineering research group of University College Cork..
(38) Chapter 2.. BACKGROUND, PROBLEM STATEMENT AND OBJECTIVES. This chapter introduces the basics of the heartbeat detection, Heart Rate Variability signal analysis, and allergy. Section 2.1 details how the electrocardiographic signal is generated and the main sources of noise that affect it. This analysis will help to understand the challenges faced when detecting QRS complexes. An overview of the current state of the art regarding the QRS complex detection is explained in order to justify the necessity of designing a new algorithm despite the fact that there are many methods proposed during the last 40 years. It is important to know that the Autonomous Nervous System (ANS) controls Heart Rate Variability (HRV) depending on the necessities of several physiological systems. Thanks to this fact it is possible to extract from the HRV, information related to the behaviour of those physiological systems. Section 2.2 explains some examples of the use of the HRV signal to provide diagnostic information for several conditions which are not directly related to the heart health. These examples give a clear idea of the great number of applications in which this signal can significantly improve several diagnostic methods that are used nowadays..
(39) Real-Time Detection of Allergic Reactions based on Heart Rate Variability Raquel Gutiérrez Rivas. The allergy definition is given in section 2.3, as well as the existing methods used to detect different kinds of allergies. The so-called Oral Food Challenge (OFC) procedure is detailed in this section, as to increase the safety of the patients undergoing it, is one of the main objectives of this Thesis. Section 2.4 explains the starting point of this work; the Thesis carried out by Niall Twomey [Twom13] which is summarized. Once defined the background of this work, the main limitations of the explained methods and technologies are listed in section 2.5. The overcoming of these limitations shapes the motivation of this study and lead to the objectives and proposals of this Thesis, which are listed in section 2.6.. Basics of QRS complex detection Due to its inherent importance, software QRS detection has been a research topic for more than four decades. As a result of this interest, many algorithms have been published that reflect the evolution of computer technology [KöHO02]. The computational load determined the complexity and therefore the performance of the first proposals, whereas recent work is focused on performance of the algorithm, as computers are becoming faster, more powerful and more reliable. Nevertheless, with the appearance of wearable technology, where low-power batterydriven devices are required, is changing to the original idea of developing low computational load algorithms [GFJC11, LANC14, ZDPL14] as is stated in [Kenn13]. Thanks to the evolution of technologies, there are some new alternatives available, allowing real-time analysis of the ECG signal to be performed. One of the latest is the use of cloud computing as is proposed by Xia et al. in [XiAZ13]. However, this proposal needs a permanent internet connection to achieve truly real-time results. Another possibility is the use of a host system to analyze the ECG signal measured by a remote device, in order to avoid the restrictions derived from its limited computational resources. In this case, a new problem arises related to the communication requirements, as the ECG signal has to be sent continuously to the analysis unit. To avoid these problems, it is necessary to compress, transmit and reconstruct all the data [LeKL11, MKAV11]. Another approach is the design of an ECG monitoring and analysis device for a particular application, as the one proposed by Chou et al. in [CTCL11] . In the next subsections, the challenges of QRS complex detection will be explained, as well as the techniques used more frequently to face those challenges..
(40) Chapter 2. Background. 9. Basics of QRS complex detection. The electrocardiographic signal The ECG represents the electrical activity of the heart. It has several electrical nodes (Figure 2.1-1) which are able to generate synchronized electrical impulses to activate its valves sequentially, thus allowing the blood to flow correctly through its chambers. The ECG signal shows the addition of all the action potentials1 generated by the electrical conduction system of the heart. Figure 2.1-2 represents the ECG waveform. Each one of its peaks: Q, R and S; waves: P, T and QRS complex; segments: PR and ST; and intervals: PR and QT; has correspondence with a state of the heart during each temporal phase of the heartbeat. These peaks, intervals, waves and segments have been studied and their features, both in time and amplitude domains, have been bounded. However, all these values have a strong dependency on the patients’ physiology, the measurement equipment, the position of the electrodes, etc. Depending on the application, those ECG’s features might have more or less importance (e.g. QT variability related to stress situations [KIKP14] or QT-RR interval co-variability differences on diabetic patients [FMSN14]). Usually the R peaks or the QRS complexes are used to define the instant in which the heartbeat occurs, as they represent the depolarization of both ventricles after they are contracted and the blood is pumped out of the heart.. Figure 2.1-1. Left: anatomy of the human heart [Ownw00]; Right: electrical system of the heart [Madh06]. Action Potential: “The Action Potential is the electrical signal that accompanies the mechanical contraction of a single cell when it is stimulated by an electrical current. It is caused by the flow of Sodium (Na+), Potassium (K+), Chloride (Cl-), and other ions across the cell membrane. It provides information about the nature of physiological activity at the single-cell level” [Rang01] 1.
(41) Real-Time Detection of Allergic Reactions based on Heart Rate Variability Raquel Gutiérrez Rivas. R. P. PR segment. PR interval. R. RR interval. ST segment. T. U. P. Q. Q S. ST interval. S. QRS interval QT interval. Figure 2.1-2. ECG peaks, waves and interval representation. As is explained above, different nodes are able to generate an electrical impulse. The natural pacemaker of the heart is the sinoatrial node, but, due to a bad functioning of the heart, it could be generated also at the Atrioventricular (AV) node, or at the Purkinje net. This is the cause or the consequence of a heart malfunction. Some examples are: . Atrial flutter: An electrical loop is formed between both atria, which produces heart beats at a very high rate, but in a regular form. Figure 2.1-3 shows an example of the ECG signal during an atrial flutter. In these cases, the atria beat faster than the ventricles, which provokes the appearance of additional heartbeats, as shown in the figure.. . Atrial fibrillation: Random electrical impulses are generated at the atria. These impulses could be so fast and irregular that the atria cannot contract completely but they tremble as is shown at the Figure 2.1-4. In this situation, the atria cannot impulse enough blood through the arteries.. . Atrioventricular block: Dysfunction occurs between atria and ventricles. It could be firstgrade block (the impulses reduce their speed when go from atria to ventricles), second grade (part of the impulses that pass through the AV node are blocked), or third grade (all the impulses are blocked at the AV node). Some P waves appear that are not followed by a QRS complex, so a low heart rate (or bradycardia) is detected.. These and other kinds of heart malfunctions can produce an irregular heart rate, or extra heartbeats or, even, missing heartbeats. It is important to take them into account when designing an algorithm for the detection of the heartbeats position..
(42) Chapter 2. Background. 11. Basics of QRS complex detection. Amplitude. Extra beats. Time Figure 2.1-3. Example of the ECG signal during the occurrence of an atrial flutter. Subject iaf5 from the Intracardiac Atrial Fibrillation (iafdb) Database in [GAGH00]. The wrong activation of atria electrical nodes, makes them produce. Amplitude. additional heartbeat.. Irregular beats Time. Figure 2.1-4. Example of the ECG signal during an atrial fibrillation. Subject iaf2 from the Intracardiac Atrial Fibrillation (iafdb) Database in [GAGH00]. The atria contract very fast and irregularly, provoking an irregular heartbeat and a desynchronization with the ventricles.. ECG sources of noise, interferences and artefacts The main challenge facing the QRS detection process is to perform an accurate heartbeat detection even with the presence of several artefacts. In [FJJY90] the features of the most important artefacts involved in the QRS complex detection were analysed. Most of these noises are easily removed, since their bands of frequencies are far away from the frequency band of interest. However, some of these interferences have features very similar to those of the ECG waves (Figure 2.1-5) such as the artefacts provoked by the movement of the patient. The most important sources of noise will be explained next. For all the ECG recordings it has been employed a 3-lead configuration, with the electrodes arranged in the Einthoven Triangle configuration [WiJK47] as shown in Figure 2.1-6..
Figure


+7
Documento similar
Antecedentes: La Variabilidad de la Frecuencia Cardíaca (HRV, del inglés Heart Rate Variability ) analiza las diferencias entre sucesivos intervalos R-R en la función
• University College of Cork, Ireland: “Spatial effects on technical progress: Convergence and Congestion”, dentro de la Regional Science Association British and Irish
The draft amendments do not operate any more a distinction between different states of emergency; they repeal articles 120, 121and 122 and make it possible for the President to
International Conference on Biometrics: Theory, Applications and
Second, the performance of our proposal, in terms of throughput, shows that Skype traffic can be identified from a traffic aggregate of up to 1 Gbps with a single process
"Heart rate variability and dispersion of QT interval in patients with vulnerability to ventricular tachycardia and ventricular fibrillation after previous
Based on the literature revision, our study aimed at exploring whether players with higher resting HRV before the competition will score lower in pre-competitive anxiety
Participation in international networks, conferences, workshops: European University Association (EUA), Euro- Mediterranean University (EMUNI), EuroMed Permanent University
