An architecture for the analysis and detection of anomalies in smart city WSNs
20
0
0
Texto completo
(2) munication technologies. However, the technological improvements in the cities 5. involve the introduction of equipment such as WSN into a new context. Although WSN technology has been widely studied in research, it is still immature in real implementations and deployments in a city. Yet, in the last few years, there has been a major increase in the number of deployments, which has involved many different providers, technologies, solutions, requirements, etc. As a. 10. consequence of this, security has been put aside in many WSN implementations, which opens up a security gap affecting the smart city system as a whole. In most of the cases, smart city managers (i.e. the public administration) have outsourced the WSN implementations to external providers. Generally, the providers keep the responsibility of administering the networks, so they. 15. deploy their devices only granting access to their employees. In this way, public administrations lose the means to verify that the WSNs are operating without attacks or failures. Nevertheless, public administrations are starting to become aware of the security problems caused by the loss of visibility on their WSNs. Smart city. 20. systems increase the interconnectivity among infrastructures and create new ways to spread vulnerabilities and to exploit infrastructure dependencies, causing damages to third parties. Thus, handing over security responsibilities only to the providers, who have a limited view just to their network, increases the risk of globally undetected incidents in the system. Therefore, public adminis-. 25. trations need to find another way to ensure that WSN performance is faultless, which is not an easy task due to the following three intrinsic characteristics of smart cities: • Heterogeneity: Multiple providers use different technologies, under diverse security requirements.. 30. • Limited access: Providers restrain public administrations from accessing their equipments. • Difficulty to update: System updates become very costly and sometimes even impossible in WSNs. 2.
(3) In this scenario, the first step towards improving security is a recovery of the 35. lost visibility over the networks operated by third parties. In this article, we propose a non-intrusive architecture designed together with the city of Barcelona, to bring the WSNs control back to the system administration and monitor the providers. Moreover, the system allows to detect incidents due to both known and unknown attacks, prevent contagion and stop their effects.. 40. The rest of this paper is structured as follows: focussing on urban WSNs, Section 2 analyses the security problems and solutions proposed so far. In Section 3, the proposed architecture is described. Then, Section 4 examines a use case based on a public car park. Finally, Section 5 concludes the paper.. 2. Related work 45. 2.1. WSN security background WSN security has been extensively studied in the literature. Conventional computer network countermeasures are normally not applicable to WSNs due to the limited computational and energetic constraints of the nodes. Therefore, preventive security solutions are adjusted or designed from scratch.. 50. The use of cryptography has been proposed to defend against the most typical attacks and to preserve basic security principles such as confidentiality, integrity, availability and non-repudiation. For example, 802.15.4 and ZigBee include different security modes based on symmetric cryptography[1]. However, cryptography neither defends against all attacks nor is effective against an. 55. attacker who has previously stolen the network security keys. Hence, further security mechanisms are necessary. Surveys [2, 3] summarize the most popular attacks on WSNs and also present some solutions. So far, the proposed security techniques are valid in certain circumstances or are designed to solve a specific problem. Due to the multi-. 60. ple constraints of the WSNs, no mechanism applicable to all possible scenarios exists. For instance, deploying networks with resource-constrained nodes (limited processing power) which cannot support some cryptographic modes is. 3.
(4) frequent. Furthermore, many vulnerabilities and their corresponding countermeasures were discovered once the WSN had already been deployed. Thus, the 65. impossibility of updating certain types of WSNs becomes a serious problem for the administrators. Nowadays, no security system exists capable of covering the wide range of heterogeneous scenarios present in the smart city. Accordingly, additional security measures are required, apart from the traditional prevention mechanisms that manufacturers usually embed in their devices.. 70. 2.2. Intrusion Detection Systems In order to not exclusively depend on the prevention countermeasures, Intrusion Detection Systems (IDSs) are deployed as additional defensive barriers to alert administrators when unusual situations are taking place in the system. Principally, IDSs use techniques based on misuses or anomalies. Misuse-. 75. based techniques rely on an extensive database of attack signatures. An attack signature is a pattern that can be used to identify an attacker’s attempt to exploit a known operating system or application vulnerability. Alarms are raised when new observations match any of the signatures[4]. The main advantage of this type of detection is the low rate of false-positives. Nevertheless, it has the. 80. drawback of not being able to detect unknown threats for which there is not yet any implemented signature. Anomaly-based techniques are based on identifying differences between the actual network activity and a predefined model considered as normal. Different techniques are used to define what to consider normal[5]. The most widespread. 85. techniques come from the Machine Learning domain. Unlike misuse-based detection, anomaly-based techniques are suitable to detect unknown attacks. On the other hand, as main drawbacks, these techniques trigger high false-alarm rates and the normal-activity profiles need to be periodically updated in networks with dynamic activity. In this area, classification techniques based on. 90. Support Vector Machines (SVM) have proven to be effective in several contexts related with intrusion and anomaly detection[6, 7]. A particular type of SVMs especially convenient to detect anomalies is one-class SVM (OC-SVM). 4.
(5) OC-SVM algorithms define a frontier in a vector space for a set of observations (training data). This frontier is used to classify new observations as normal or 95. as outliers. This is an unsupervised learning technique where labeled training data is not required. Other learning techniques require labeled training data for normal and anomalous instances (supervised techniques) or just for normal instances (semi-supervised techniques). In the scope of intrusion detection in a smart city, obtaining labeled data (particularly for anomalous instances) is. 100. challenging. Therefore, unsupervised learning techniques such as OC-SVM are more appropriate in this context. At present, there are many proposed IDSs for WSNs implementing anomaly detection techniques[8]. However, IDSs for WSNs are usually designed to have some components embedded in the nodes and/or to benefit from a previous. 105. knowledge about the devices, the topology, the communication protocol or another feature of the WSN. Thus, they are not appropriate as a general solution for a smart city. 2.3. Security Information and Event Management The characteristics of an heterogeneous and complex system like the smart. 110. city make solutions based on Security Information and Event Management (SIEM) suitable. SIEMs are designed for log management, IT regulatory compliance, event correlation, active response and endpoint security[9]. Basically, SIEM systems contribute to the security administration of organizations by gathering and correlating the security information of several types, formats and. 115. sources into a single system. Thus, administrators may drop out the traditional analysis using the security mechanisms in a silo perspective. With a SIEM, security practitioners carry out complex monitoring and incident inquiries involving multiple devices and protection mechanisms. In addition, the view over the entire network becomes more manageable and the number of false alarms from. 120. the individual systems decreases. In general, SIEMs are focused on network and system security. However, in the last years, they have as well become powerful tools for analysis in other areas. Regarding WSNs, authors of [10] propose to 5.
(6) modify the SIEM OSSIM1 , in order to protect the WSNs in an hydroelectric power plant. 125. SIEMs deliver excellent results when IT administrators have total control of the organization’s equipment and access to the logs is granted. As we have already mentioned, the smart city is a totally opposite scenario and, therefore, it is not feasible to deploy a SIEM. In the next section, we propose to enhance a SIEM to overcome the restrictions of smart cities and to bring back visibility. 130. to its system administrators. As far as we know today, there are no references in the literature addressing this specific topic.. 3. Architecture For the principal purpose of recovering the lost visibility over the smart city WSNs, in this section we propose an architecture that adds an extra protection 135. layer to the system to monitor the health of the WSNs deployed by third parties. Thus, the first defensive line is still responsibility of the providers, who have easier access, more knowledge and permission to their own infrastructure. Thus, the proposed architecture has been designed in collaboration with the Barcelona City Council with the main purpose of ensuring that the service providers are. 140. implementing security measures to avoid attacks and to respond to incidents with low latency. At the same time, the proposed architecture has been designed to be compatible with the deployed devices and respect the existing contracts agreed with the providers. Furthermore, the proposed architecture avoids the restrictions of the three characteristics mentioned in Section 1. Our solution. 145. deploys a new layer in the servers of the smart city administrators. This layer is conceptually above the devices used by the different providers. Therefore, it is not affected by the heterogeneity of the different configurations, it does not require special permissions over third party devices and it is easily accessible and updatable. 1 ”OSSIM”,. http://www.alienvault.com/open-threat-exchange/projects. 6.
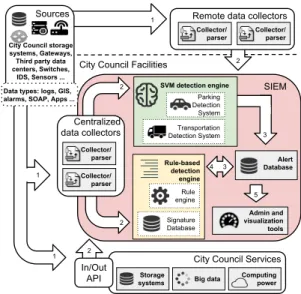
(7) Sources. Remote data collectors. 1. Collector/ parser City Council storage systems, Gateways, Third party data centers, Switches, IDS, Sensors .... SVM detection engine. 2. Transportation Detection System. Collector/ parser. Rule-based detection engine. Collector/ parser. 4. Rule engine Signature Database. 2. 1. SIEM. Parking Detection System. Centralized data collectors. 1. 2. City Council Facilities. Data types: logs, GIS, alarms, SOAP, Apps .... Collector/ parser. 3. Alert Database. 3. 5 Admin and visualization tools. 2. In/Out API. City Council Services Storage systems. Big data. Computing power. Figure 1: Architecture of the proposed solution. 150. The proposed solution, shown in Fig. 1, is based on an enhanced SIEM contained within the city council facilities in order to make use of the recollection, storage, processing and big data services offered by the smart city. The main components and the data flow represented in the figure are: 1. Data originate from several sources in different data types. Generally,. 155. application data come from the sensor readings and network status data come from gateways, watchdogs[11] or other devices with enough capacity to monitor the WSN. In certain cases, in order to get a precise picture of the network, WSN nodes log system status information, which is sent regularly or under request[12, 13]. Then, these data are gathered, parsed. 160. and normalized by remote data collectors distributed near the sources or by centralized data collectors installed near the processing engines. 2. Normalized data are the input of the two detection engines. On the one hand, the rule-based detection engine, which has the objective to detect known attacks and to correlate data from different sources (see Sec-. 165. tion 3.1 for more information). On the other hand, the SVM-based detection engine, which uses machine learning techniques for the detection of anomalies and unknown attacks (see Section 3.2 for more information).. 7.
(8) 3. The detection engines independently analyse the input data and trigger alerts that are stored in a common alert database. 170. 4. The alerts from the database are correlated by the rule-based detection engine generating new alerts, which become candidates to be correlated in future iterations. 5. The administration and visualization tools offer interfaces (e.g. dashboards, SMS alerts) and subscription mechanisms to inform about the. 175. alerts and to manage the system. The core of this architecture is built around the two detection engines. As it has been discussed in Section 2, these two types of detection techniques have different characteristics that need to be combined for effective anomaly detection in smart cities. In this way, the SVM-based detection engine allows to detect. 180. attacks that have not yet been disclosed or for which a signature would be too complex to be implemented. On the other hand, the rule-based detection engine is a highly reliable mechanism with which administrators are capable of easily implementing rules to detect misuses and also to correlate the alerts triggered by the SVM-based detection engine to reduce the number of false alarms. In. 185. the following sections, we give a more detailed description of these two detection engines. 3.1. Rule-based detection engine The rule-based detection engine provides the system with a highly reliable alert module. An alert is mainly defined by a rule with the conditions that. 190. trigger the alert, a schedule, a level of severity and the actions to execute (e.g. administrator warning, execution of certain processes). Rules are built with two purposes. Firstly, to find evidences of undesirable situations (e.g. traces of refused connections, parameters surpassing a threshold). Secondly, rules are also built to correlate multiple evidences found in. 195. different network components and/or moments in time. These correlation rules take advantage of the fact that some attacks leave traces in several parts of. 8.
(9) the system within a limited time window. These traces are normally a consequence of the several steps required to perform an attack or the persistence of the attacker after failing. The following are high-level examples of alerts: 200. • IF ∃ Event E FROM Log L ON Real-time WHERE Field F CONTAINS "Authentication failed" THEN Alert(Severity: Low, Action: Run Script S). 205. • IF ∃ Event E FROM Log L ON Real-time WHERE Field F > Threshold THEN Alert(Severity: Medium, Action: Show in alert panel). 210. • IF 6 ∃ Event E1 FROM Log L1 Last 2 Hours AND ∃ Event E2 FROM Log L2 Last Hour THEN Alert(Severity: High, Action: Send SMS). 215. The proposed architecture gathers all the evidences of suspicious behaviours in the WSNs of the smart city in a single system. However, the real challenge is to warn administrators just when the severity of the alarm is high enough. To meet this goal, we propose to define rules in an iterative manner. First, simple rules are designed to seek for traces of undesirable actions or parameters. 220. beyond known thresholds. Then, more complex correlation rules are created to bind together several alerts triggered by simple rules, other correlation rules or the SVM-based detection engine. Each step of this process results in an alert with a higher reliability. To simplify the definition of rules for an entire smart city, system adminis-. 225. trators can use signature databases publicly available. For instance, Snort2 is a popular IDS that offers regularly updated signature databases for most common protocols. Quickdraw3 offers signatures for SCADA. As far as we know, 2 ”Snort”,. https://www.snort.org/ http://www.digitalbond.com/tools/quickdraw/. 3 ”Quickdraw”,. 9.
(10) however, there are no signature databases specifically designed for WSNs or for smart city applications (e.g. parking, environmental monitoring). This compli230. cates the management and the detection of anomalies in contexts with a vast number of incident types. The rule-based detection engine is especially useful against attacks that are clearly identifiable through thresholds and which are considered stable in the long term. However, in a changing environment such as the smart city, thresh-. 235. olds are usually hard to define because the environment is dynamic and changes according to the seasons, the time of day, etc. Furthermore, unknown attacks, for which no rules are defined, are undetectable. In the next section, we present a complementary detection engine to overcome these problems. 3.2. SVM-based detection engine. 240. The SVM-based detection engine uses unsupervised OC-SVMs to trigger alerts when new observations are identified as outliers. For each system to protect, we propose to regularly train a OC-SVM with vectors with the most representative system features. Thus, each feature vector becomes a picture of the system state within a chosen time window. At scheduled intervals, new. 245. feature vectors with the system’s current state are built and tested with the trained OC-SVM. The selected features come from: • Application data from sensor readings. • Network status data from the base station and other available devices. • Data from other services of the smart city with temporal or spatial. 250. relationship with the monitored application. For instance, our proposal allows the use of samples from the historical records to train a OC-SVM to protect a public car park application. The feature vectors are composed of the three data types described above. Within a time window of two hours, data are aggregated for each sensor to represent the. 255. amount of free/occupied state changes (application data), the number of lost 10.
(11) packets (network status data) and the flow of vehicles in the nearby roads (data from other services). Then, every two hours the trained OC-SVM is used to test if there are anomalies in the data received from the smart city.. 4. Use case: attack on a parking WSN 260. In this section, we validate the proposed architecture through a use case structured around a public car park. Parking data come from a service provider of Barcelona. With the goal of building more comprehensive scenarios, the parking data is supplemented with WSN simulations made with Castalia 3.34 . To analyze the data, the proposed solution is implemented on top of the SIEM. 265. Splunk5 and is deployed in Barcelona City Council data center. The alert module of this SIEM is used as the rule-based detection engine. Furthermore, Splunk is extendable with custom commands to enhance search and alert rules. Thus, the SVM-based detection engine is implemented with two custom commands for training and testing OC-SVMs. In this use case, we create alerts based on. 270. simple and correlation rules and we use OC-SVMs to detect unknown attacks (i.e. attacks for which there are no implemented signatures in the database). Moreover, we validate that a combination of network status and application data from related systems makes up for the reduced access to third party devices in smart cities.. 275. 4.1. Scenarios In order to validate the flexibility of our solution, we present seven scenarios based on different configurations of parking WSNs. To capture the variability of layouts and the diversity of technologies in the smart city, the networks are designed relying on two types of data link protocols (802.15.4 and TMAC), two. 280. types of topologies (star and tree) and with a different amount of sensors. The number of parking sensors varies between 9 and 100. In addition, in scenarios 1 4 ”Castalia”, 5 ”Splunk”,. http://castalia.npc.nicta.com.au/ http://www.splunk.com/. 11.
(12) Table 1: Summary of the scenarios.. Scenario. parking Other sensors. MAC. Topology. 802.15.4. Star. TMAC. Star. 802.15.4. Star. TMAC. Star. sensors 1. 9. 2 CO2, 3 light, 1 mass, 2 humidity. 2. 9. 2 CO2, 3 light, 1 mass, 2 humidity. 3. 30. 2 CO2, 3 light, 1 mass, 2 humidity. 4. 30. 2 CO2, 3 light, 1 mass, 2 humidity. 5. 100. None. 802.15.4. Star. 6. 100. None. TMAC. Star. 7. 100. None. 802.15.4. Tree. - 4, sensors from a miscellany of applications (environmental monitoring, light and mass in a container) share a single WSN with different sending behaviours. While parking, light and mass sensors are reactive, CO2 and humidity sensors 285. are programmed to send the readings at regularly scheduled intervals. Table 1 shows a summary of the scenarios. 4.2. Attack model We assume that attackers intend to gain advantage over other users of the public parking spaces. To this end, the attackers disrupt the communication of. 290. several nodes during high occupancy hours. Thus, parking applications do not receive updates when parking slots become free and, therefore, attackers have a higher probability to find available slots in certain areas. Different types of attack are conducted depending on the specific network. 12.
(13) configuration: 295. • Jamming. This attack at the physical layer consists in sending a high power signal to the gateway in order to corrupt legitimate packets. • Unfairness. At the data link layer, the attackers exploit the channel access protocols to prevent transmissions from legitimate nodes. In 802.15.4 configurations, legitimate nodes use Clear Channel Assessment (CCA) to. 300. check whether the channel is free before transmitting. The attackers continuously occupy the communication channel impeding other transmissions. In TMAC configurations, the attackers corrupt reference control packets used by legitimate nodes to initiate transmission. • Selective forwarding and blackhole. In these attacks at the network. 305. layer, the attackers capture a node that stops retransmitting some packets from some nodes (selective forwarding), or from all of them (blackhole). 4.3. SVM-based detection A SVM-based detection engine prototype has been implemented with two Splunk custom commands (svmtrain, svmtest). The machine learning mecha-. 310. 315. nism relies on the library scikit-learn 0.15.2[14]. The command svmtrain trains a OC-SVM. Below we show the use of this command with training data from the Scenario 7. The feature vectors contain the hour, the number of state changes of the parking sensor and the rate of lost packets: index=20150325-100nodes802154-multihop sim_type=train | fields - * | fields + "hour", * appsend, * applossrate | svmtrain file_name=scenario7 nu=0.01 gamma=0.01. The command svmtest tests each vector from a dataset using a previously trained OC-SVM: 320. index=20150325-100nodes802154-multihop sim_type=test | fields - * | fields + "hour", * appsend, * applossrate | svmtest file name=scenario7. In this use case, we use these two commands to train a OC-SVM with a Radial Basis Function (RBF) kernel for each proposed scenario. Then, we test 13.
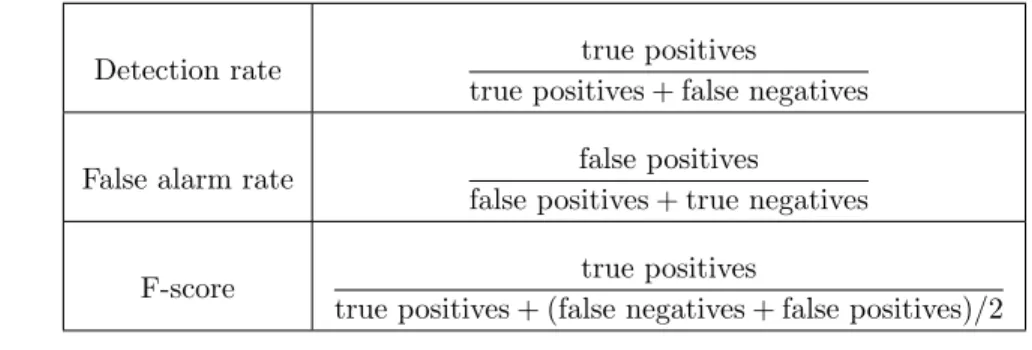
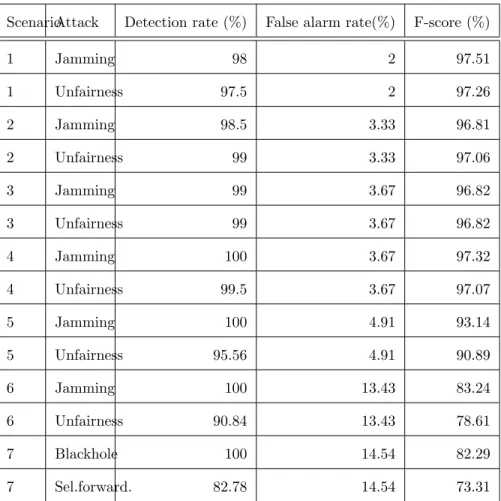
(14) Table 2: Metrics.. 325. Detection rate. true positives true positives + false negatives. False alarm rate. false positives false positives + true negatives. F-score. true positives true positives + (false negatives + false positives)/2. the detection engine with a failure-free dataset and several datasets with the mentioned attacks. The vectors to build the datasets contain application data (e.g. sensor readings) and network status data obtained at the base station (e.g. number of lost packets, number of packets received with interferences, number of sent RTS).. 330. To evaluate the detection results, we calculate three standard metrics widely used to assess IDSs and machine learning algorithms [15]. These metrics are summarized in Table 2. The detection rate is calculated dividing the number of detected attacks (true positives) by the number of total attacks (true positives + false negatives). The false alarm rate, also known as false positive rate, is. 335. calculated dividing the number of instances that are incorrectly classified as attacks (false positives) by the number of total instances that are not attacks (false positives + true negatives). Finally, the f-score takes into account the number of true positives over the arithmetic average of predicted positives and real positives.. 340. As Table 3 shows, the combination of application data with the available network status data at the base station results in high detection rates in all the scenarios. Furthermore, the parameters to configure the OC-SVM are not modified among scenarios, which validates that this unsupervised machine learning mechanism has high flexibility. However, the false alarm rate in certain scenar-. 345. ios is also high, especially in the scenarios with more nodes. We see that, in the tree topology, the lack of information about far apart nodes at the base station reduces the detection rate when a small percentage of the nodes is affected by. 14.
(15) Table 3: SVM-detection results.. ScenarioAttack. Detection rate (%). False alarm rate(%). F-score (%). 98. 2. 97.51. 1. Jamming. 1. Unfairness. 97.5. 2. 97.26. 2. Jamming. 98.5. 3.33. 96.81. 2. Unfairness. 99. 3.33. 97.06. 3. Jamming. 99. 3.67. 96.82. 3. Unfairness. 99. 3.67. 96.82. 4. Jamming. 100. 3.67. 97.32. 4. Unfairness. 99.5. 3.67. 97.07. 5. Jamming. 100. 4.91. 93.14. 5. Unfairness. 95.56. 4.91. 90.89. 6. Jamming. 100. 13.43. 83.24. 6. Unfairness. 90.84. 13.43. 78.61. 7. Blackhole. 100. 14.54. 82.29. 7. Sel.forward.. 82.78. 14.54. 73.31. the attacker (i.e. selective forwarding) and it increases the false alarm rate. In the same way, the features extracted from the data link layer in the TMAC sce350. nario provide the trained models with less information than the features from the physical layer used in the 802.15.4 scenario in the star topology. This also results in a decrease in the detection rate when few nodes are affected (i.e. unfairness) and an increase in the false alarm rate. In the next section we use the rule-based detection engine to define correlation rules in order to reduce this. 355. inconvenience.. 15.
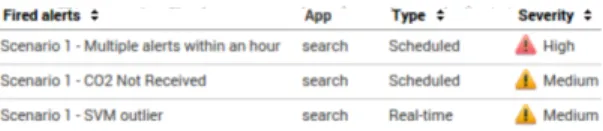
(16) index="parking_simulation" host=20150113-9sensors802154-2h | eval count_co2_sent = ’10_appsend’ + ’11_appsend’ + ’12_appsend’ | search count_co2_sent<3. (a) CO2 not received: Medium severity alert scheduled at 20h to verify that the regular CO2 readings from 19h have been received. index="parking_simulation" host=20150113-9sensors802154-2h. | fields - _* | fields + "hour", "0_radiopckfailedNoInt",. "0_radiopckfailedInt", "0_radiopckfailedBelowSens", "0_radiopckfailedNonRX", "0_radiopckreceivedWithInt", "0_radiopckreceivedWithoutInt", *_appsend | svmtest file name=20150113-9sensors802154-2h | search test=-1. (b) SVM outlier: Medium severity alert to identify outliers in real time using a trained OC-SVM within a two hour window. index=_audit action=alert_fired | eval ttl=expiration-now() | search ttl>0 | eval is_not_co2=if(ss_name=="Scenario 1 - CO2 Not Received",1,0) | eval is svm=if(ss_name=="Scenario 1 - SVM outlier",1,0) | stats sum(is_not_co2) as sum_alert1 sum(is_svm) as sum_alert2 | eval num_alerts=sum_alert1+sum_alert2 | search num_alerts>1. (c) Multiple alerts within an hour: High severity alert to detect that several evidences are affecting the network within an hour window. Figure 2: Rule examples for alert definition.. Figure 3: Alerts in the alert panel in Splunk.. 4.4. Rule-based detection with alert correlation As it has been previously mentioned, the main problems of a rule-based detection engine are the difficulty to define thresholds and the unfeasibility to detect unknown attacks. At the same time, machine learning mechanisms gen360. erate too many false positives to be considered fully reliable. As an example, in this use case, we create a set of low and medium severity alerts based on rules that look for evidences of anomalies, as well as highly reliable alerts based on correlation rules. Example alerts for Scenario 1 are shown in figures 2a, 2b and 2c. These alerts are triggered with the datasets from the attacks described. 365. in 4.2 resulting in the warnings on the alert panel shown in Fig. 3. It must be emphasized that to trigger the high severity warning on Fig. 3, our proposal combines data from different WSN applications (i.e. CO2 and parking); application and network status data; and it is also paramount to combine the rule-based and the SVM-based detection engines. 16.
(17) 370. 5. Conclusions In this article, we have seen that traditional security needs to be enhanced in order to detect anomalies in smart city WSNs operated by third parties. The reduced access to the service provider network devices limits the visibility over the WSNs to smart city administrators and prevents a conventional log analysis. 375. using just rule-based mechanisms. To overcome this, we have proposed a non intrusive architecture that combines a rule-based and a SVM-based detection engine. This architecture deploys a new security layer in the central servers above the miscellaneous equipments of the providers. Thus, problems due the heterogeneity, the limited access or the difficulty to update certain devices are. 380. avoided. Moreover, we have proposed to supplement the reduced network status data with the application data sent by the sensors and with data from other temporally or spatially related smart city services. Furthermore, we have implemented a prototype of the proposed architecture on top of Splunk and we have presented a use case structured around a public. 385. car park to validate it. We have seen that the two detection engines complement each other. On the one hand, the rule-based detection engine triggers highly reliable alerts, but it is not capable of detecting unknown attacks. Besides, some rules require thresholds that are hard to define in a context such as the smart city with intrinsic variability associated to the season of the year, the number. 390. of sensors, etc. On the other hand, the SVM-based detection engine detects unknown attacks and its unsupervised learning nature provides with flexibility in a changing environment. Nevertheless, machine learning techniques have the drawback of a high false alarm rate. To improve the reliability of the alerts, we have proposed to iteratively define correlation rules to group alerts from. 395. both detection engines. Thus, the proposed architecture increases smart city security and returns part of the lost visibility over the WSNs to smart city administrators.. 17.
(18) 6. Acknowledgement This work is partially funded by the Ministry of Economy and Competitive400. ness through the projects CO-PRIVACY (TIN2011-27076-C03-02) and SMARTGLACIS (TIN2014-57364-C2-2-R) and for the Government of Catalonia through the subvention of the industrial doctorate ECO/2497/2013. Barcelona City Council, Cast Info and openTrends deserve particular thanks.. 7. References 405. [1] P. Radmand, M. Domingo, J. Singh, J. Arnedo, A. Talevski, S. Petersen, S. Carlsen, Zigbee/zigbee pro security assessment based on compromised cryptographic keys, in: Int. Conf. P2P, Parallel, Grid, Cloud and Internet Computing, IEEE, 2010, pp. 465–470. [2] T. Kavitha, D. Sridharan, Security vulnerabilities in wireless sensor net-. 410. works: A survey, Journal of information Assurance and Security 5 (1) (2010) 31–44. [3] H. Modares, R. Salleh, A. Moravejosharieh, Overview of security issues in wireless sensor networks, in: Int. Conf. Computational Intelligence, Modelling and Simulation, IEEE, 2011, pp. 308–311.. 415. [4] I. Kim, D. Oh, M. K. Yoon, K. Yi, W. W. Ro, A distributed signature detection method for detecting intrusions in sensor systems, Sensors 13 (4) (2013) 3998–4016. doi:10.3390/s130403998. [5] I. Butun, S. D. Morgera, R. Sankar, A survey of intrusion detection systems in wireless sensor networks, Communications Surveys & Tutorials 16 (1). 420. (2014) 266–282. [6] A. Este, F. Gringoli, L. Salgarelli, Support vector machines for tcp traffic classification, Computer Networks 53 (14) (2009) 2476–2490.. 18.
(19) [7] S. Kaplantzis, A. Shilton, N. Mani, Y. A. Sekercioglu, Detecting selective forwarding attacks in wireless sensor networks using support vector ma425. chines, in: Int. Conf. Intelligent Sensors, Sensor Networks and Information, IEEE, 2007, pp. 335–340. [8] M. Xie, S. Han, B. Tian, S. Parvin, Anomaly detection in wireless sensor networks: A survey, Journal of Network and Computer Applications 34 (4) (2011) 1302–1325.. 430. [9] D. Miller, S. Harris, A. Harper, S. VanDyke, C. Blask, Security information and event management (SIEM) implementation, McGraw Hill Professional, 2010. [10] L. Romano, S. D’Antonio, V. Formicola, L. Coppolino, Protecting the wsn zones of a critical infrastructure via enhanced siem technology, in: Com-. 435. puter Safety, Reliability, and Security, Springer, 2012, pp. 222–234. [11] S. Marti, T. J. Giuli, K. Lai, M. Baker, Mitigating routing misbehavior in mobile ad hoc networks, in: Int. Conf. Mobile Computing and Networking, ACM, 2000, pp. 255–265. [12] S. Gupta, R. Zheng, A. M. Cheng, Andes: an anomaly detection system for. 440. wireless sensor networks, in: Int. Conf. Mobile Adhoc and Sensor Systems., IEEE, 2007, pp. 1–9. [13] N. Ramanathan, K. Chang, R. Kapur, L. Girod, E. Kohler, D. Estrin, Sympathy for the sensor network debugger, in: Int. Conf. Embedded Networked Sensor Systems, ACM, 2005, pp. 255–267.. 445. [14] F. Pedregosa, G. Varoquaux, A. Gramfort, V. Michel, B. Thirion, O. Grisel, M. Blondel, P. Prettenhofer, R. Weiss, V. Dubourg, J. Vanderplas, A. Passos, D. Cournapeau, M. Brucher, M. Perrot, E. Duchesnay, Scikit-learn: Machine learning in Python, Journal of Machine Learning Research 12 (2011) 2825–2830.. 19.
(20) 450. [15] A. Lazarevic, L. Ertöz, V. Kumar, A. Ozgur, J. Srivastava, A comparative study of anomaly detection schemes in network intrusion detection., in: Int. Conf. Data Mining, SIAM, 2003, pp. 25–36.. 20.
(21)
Figure

+2
Documento similar
The second method is based on an extension of tensor voting in which the encoding and voting processes are specifically tailored to robust edge detection in color images.. In this
MD simulations in this and previous work has allowed us to propose a relation between the nature of the interactions at the interface and the observed properties of nanofluids:
For a short explanation of why the committee made these recommendations and how they might affect practice, see the rationale and impact section on identifying children and young
The expansionary monetary policy measures have had a negative impact on net interest margins both via the reduction in interest rates and –less powerfully- the flattening of the
Jointly estimate this entry game with several outcome equations (fees/rates, credit limits) for bank accounts, credit cards and lines of credit. Use simulation methods to
In our sample, 2890 deals were issued by less reputable underwriters (i.e. a weighted syndication underwriting reputation share below the share of the 7 th largest underwriter
After a deep study of the state of the art for the task of person detection, it has been possible to train a neural network based on the Yolo v2 detection, using MobileNet and Tiny
3p orbitals, as shown in Figure 8 for 100 K and Figures S1 and S2 for 300 K structures. As mentioned above, the EXSCI approach has been employed to reduce the
