Gold
−
Copper Nano-Alloy,
“
Tumbaga
”
, in the Era of Nano: Phase
Diagram and Segregation
Gre
gory Guisbiers,
́
*
,†Sergio Mejia-Rosales,
‡Subarna Khanal,
†Francisco Ruiz-Zepeda,
†Robert L. Whetten,
†and Miguel Jose
-Yacaman
́
††Department of Physics & Astronomy, University of Texas at San Antonio, One UTSA Circle, San Antonio, Texas 78249, United
States
‡Center for Innovation, Research and Development in Engineering and Technology (CIIDIT) and CICFIM-Facultad de Ciencias
Fisico-Matematicas, Universidad Autonoma de Nuevo Leon, San Nicolas de los Garza, Nuevo Leon 66450, Mexicó
*
S Supporting InformationABSTRACT: Gold−copper (Au−Cu) phases were employed
already by pre-Columbian civilizations, essentially in decorative arts, whereas nowadays, they emerge in nanotechnology as an important catalyst. The knowledge of the phase diagram is critical to understanding the performance of a material. However, experimental determination of nanophase diagrams is rare because calorimetry remains quite challenging at the nanoscale; theoretical investigations, therefore, are welcomed. Using nanothermody-namics, this paper presents the phase diagrams of various polyhedral nanoparticles (tetrahedron, cube, octahedron, decahe-dron, dodecahedecahe-dron, rhombic dodecahedecahe-dron, truncated octahe-dron, cuboctaheoctahe-dron, and icosahedron) at sizes 4 and 10 nm. One
finds, for all the shapes investigated, that the congruent melting
point of these nanoparticles is shifted with respect to both size and composition (copper enrichment). Segregation reveals a gold enrichment at the surface, leading to a kind of core−shell structure, reminiscent of the historical artifacts. Finally, the most stable structures were determined to be the dodecahedron, truncated octahedron, and icosahedron with a Cu-rich core/Au-rich surface. The results of the thermodynamic approach are compared and supported by molecular-dynamics simulations and by electron-microscopy (EDX) observations.
KEYWORDS: nanothermodynamics, binary phase diagram, nanoalloy, size effect, polyhedra, congruent melting
“Tumbaga” was the name given by the Conquistadors to the gold−copper alloy perfected by pre-Columbian civilizations in Central and South America.1−3 The proportion of gold to copper varies widely and sometimes silver was even found as an impurity. The popularity of this alloy comes from its congruent melting point. Congruency denotes that at a particular composition, the alloy behaves like a pure element (i.e., it melts at a definite temperature rather than over a range) and also the melting point of the alloy is reduced as compared to the two pure elements. For bulk Au−Cu, the congruent melting point occurs at 44% copper composition and 910 °C,4 well below the gold melting point (1064 °C) and the copper melting point (1084°C). In contrast to this high-temperature regime, wherein the alloy exists in the form of a solid solution over the entire range of composition; at reduced temperatures, it forms ordered phases Au3Cu (L12), AuCu (L10) and AuCu3 (L12) depending on the alloy composition.
Nowadays, besides its continued use in jewelry, the Au−Cu alloys have emerged prominently in the nanosciences, mostly for catalysis; they catalyze a wide range of chemical reactions from carbon monoxide oxidation5−8 to selective oxidation of alcohols.9,10 In fact, this alloy exhibits novel physical and
chemical properties11,12at the nanoscale. Although the Au−Cu alloy has been extensively studied in the literature both at the bulk4,13−18 and nanoscales,10,11,19−29 the prediction of phase diagrams at the nanoscale is still missing. The objective of this paper is to present the phase diagram of Au−Cu at the nanoscale for the relevant distinct polyhedral morphologies of nanoparticles namely the tetrahedron, cube, octahedron, decahedron, dodecahedron, rhombic dodecahedron, truncated octahedron, cuboctahedron, and icosahedron.
To predict the solid solubility of two metals, there exist the empirical Hume−Rothery rules.30,31 These rules indicate that the alloy is preferred when the atomic radii, crystal structure, valence, and electronegativity of the elements are similar. The Au−Cu combination fulfills three of the four Hume−Rothery rules, and hence, it formsat high temperaturea random substitutional solid solution; that is, Au and Cu atoms substitute for each other in the crystal lattice without structural
Received: September 13, 2014 Revised: October 17, 2014 Published: October 22, 2014
Letter
pubs.acs.org/NanoLett
this fourth (electronegativity) Hume−Rothery rule should be replaced by one based on the molar heat of vaporization,32,33 which is related to the cohesive energy of the material and, thus, is better adapted to describe the alloy behavior. Applying this new rule, the relative difference between the molar heat of vaporization of gold and copper is only 11% indicating a strong preference for mixing. Therefore, as usually given for a binary isomorphous system, that is, a two-component system A and B in which A and B are completely miscible in both solid and liquid phases, the phase diagram can be predicted within a thermodynamic approach employing a regular solution model (i.e., a quasichemical model). Figure 1 demonstrates clearly that
= Δ − + Ω − Ω ⎩ ⎪ ⎪⎪ ⎛⎝⎜ ⎞ ⎠ ⎟ H T
T x x
1 m
B
m
B l liquidus 2
s solidus 2
(1)
Here, xsolidus (xliquidus) denote the compositions of the solid (liquid) phases at given temperature T;TmA and TmB, the size-dependent melting temperatures of gold (A) and copper (B); ΔHmA and ΔHmB, their respective size-dependent melting enthalpies; Ωl and Ωs, the respective size-dependent interactions parameters in the liquid and solid phases; andR, the characteristic ideal gas constant.
Figure 1 presents the bulk phase diagram wherein the congruent melting point is the intersection between the liquidus and solidus curves, at this particular composition, the two-component solution behaves like a pure element. In the Au−Cu alloy, the congruent melting point is lower than either the gold and copper melting points, implying that the liquid solution is stabilized more than the solid one. This is rationalized within the regular solution model (above) by the interaction parameters, which are both negative (A−B interactions are stronger than A−A or B−B interactions, i.e., mixing is favored), leading to the inequality, indicative of greater stability of the liquid solution compared to the solid one.
To calculate the phase diagram at the nanoscale, the size-dependent parameters must be evaluated. The size-size-dependent melting temperature is calculated according to eq 239
γ γ = + − Δ ∞ ∞ ⎛ ⎝ ⎜⎜ ⎞ ⎠ ⎟⎟⎛⎝⎜⎜ ⎞⎠⎟⎟ T T N
N X a H
1 1
m hkl
m
,
surf
tot ( )
l s
m, (2)
Here,X(hkl)denotes a set of factors equal to {1/2,√2/4,√3/ 3} for the {100, 110, 111} faces, respectively.γlandγsare the respective surface energies in the liquid and solid state;ais the bulk lattice parameter; andNsurf/Ntotis the ratio of surface to total atoms. The size-dependence of the interactions and melting enthalpy are also calculated consistently by the same relationship. This is justified by quantum physics consideration where all thermodynamic quantities are approximately a linear functions of 1/D (where D denotes the length edge of the polyhedron) corresponding to the nanoparticle’s surface-to-volume.38,40
Once we have used eq 2 to obtain the set of size-dependent parameters {TmA,T
m B,ΔH
m A,ΔH
m B,Ω
l,Ωs} for any sizes selected (here, 10 and 4 nm), we can introduce these parameters into eqs 1 to generate the Au−Cu phase diagram at the nanoscale (Figure 2). All phase diagrams, presented in Figure 2 at two distinct sizes (10 and 4 nm), show that the liquid region is enlarged and the solid solution area is narrowed. As usual,
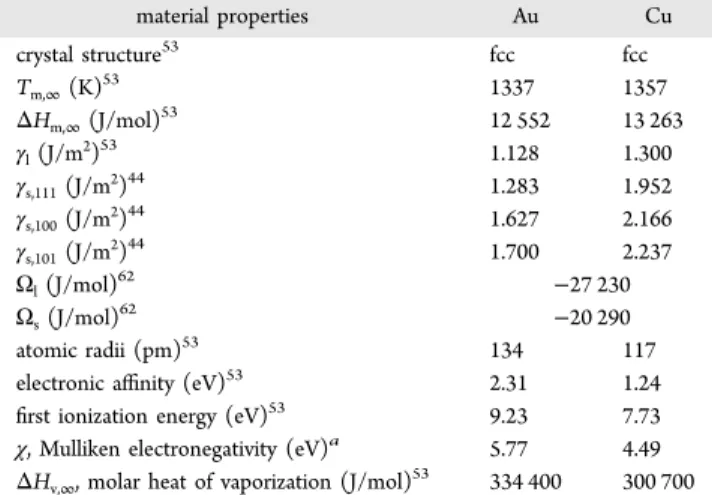
Tm,∞(K) 1337 1357
ΔHm,∞(J/mol)53 12 552 13 263
γl(J/m2)53 1.128 1.300
γs,111(J/m2)44 1.283 1.952
γs,100(J/m2)44 1.627 2.166
γs,101(J/m2)44 1.700 2.237
Ωl(J/mol)62 −27 230
Ωs(J/mol)62 −20 290
atomic radii (pm)53 134 117
electronic affinity (eV)53 2.31 1.24
first ionization energy (eV)53 9.23 7.73
χ, Mulliken electronegativity (eV)a 5.77 4.49
ΔHv,∞, molar heat of vaporization (J/mol)53 334 400 300 700
a
The Mulliken electronegativity is defined as the mean value between the electronic affinity and thefirst ionization energy.
above the liquidus curve, the solution is purely liquid. In the lens-shaped 2-phase region, the liquid is at equilibrium with the solid phase. Below the solidus curve, the solution is purely solid. Ordered phases may exist at low temperature but are not considered in this study and will be the subject of another work. On all the phase diagrams investigated in this paper (except the bulk one), at a given size and shape, the copper melting point is always lower than the gold melting point due to a stronger size effect on copper compared to gold, originating in its higher surface energy difference |γl − γs|Cu>|γl − γs|Au irrespective of the faces considered (cf. Table 1). For example, this effect occurs for the dodecahedron when its edge length is reduced below∼64 nm. The magnitude of the size effect may be quantified by a shape-dependent parameter, denotedα, and defined byTm/Tm,∞= 1−α/D.40For all shapes investigated, the shape parameter of copper is always greater than the one of gold, as listed in Table 2.
By comparing the values of the shape-dependent parameter of gold and copper (cf. Table 2), we can predict the preferential shape adopted by these pure materials at small scales (Figure 3a and b). The most stable shapes are the dodecahedron, truncated octahedron, and the icosahedron, that is, the ones having the lowest α value and, thus, exhibiting the highest melting temperature. The dodecahedron and the truncated octahedron are equivalent for pure copper nanoparticles (Figure 3b). For comparison, Barnard et al.41,42used relativistic
first-principles methods to calculate, for pure gold nano-particles, the stability of the truncated octahedron, icosahedron,
decahedron, and cuboctahedron. Here, for the alloy, the sequence of preferred shapes can be predicted by looking at the crossover between the solidus curves. In Figure 2, those shapes exhibiting the highest solidus curve indicate a large solid solution region and thus a corresponding higher stability. Figure 3c−d show the sequences for Au−Cu alloy for larger (10 nm) and smaller (4 nm) nanoparticles.
These results illustrate how the dynamical and structural behavior of the alloy as calculated at the special sizes 10 and 4 nm, evolves from the gold sequence to the copper sequence as the copper composition increases. Whatever the composition and the size of the nanoalloy, the preferred shapes remain the dodecahedron, truncated octahedron, and the icosahedron. Experimentally, the truncated octahedron has been observed by Figure 2.Phase diagrams at the bulk scale (black) at 10 nm (red) and at 4 nm (green) for (a) tetrahedron, (b) octahedron, (c) decahedron, (d) dodecahderon, (e) icosahedron, (f) cube, (g) truncated octahedron, (h) cuboctahedron, (i) rhombic dodecahedron. The blue arrow is only there to guide the eye and highlighting the size effect on the congruent melting point.
Table 2. Shape-Dependent Parameter Used To Quantify the Size Effect
shape type of faces αAu(nm) αCu(nm)
tetrahedron 111 1.84 5.13
octahedron 111 0.92 2.56
decahedron 111 0.91 2.50
dodecahedron 111 0.34 0.94
icosahedron 111 0.50 1.38
truncated octahedron 111 and 100 0.44 0.94
cuboctahedron 111 and 100 1.22 1.60
rhombic dodecahedron 110 1.71 1.84
Figure 3.Predicted sequence of preferred shapes (left to right) for (a) gold, (b) copper, and (c) copper−gold alloy at 10 and 4 nm where 1, 2, 3, 4, 5, and 6 represent different range of composition. At 10 nm, the composition ranges are: 1, 0≤XCu≤0.21; 2, 0.21≤XCu≤0.26; 3, 0.26≤XCu≤ 0.29; 4, 0.29≤XCu≤0.51; 5, 0.51≤XCu≤0.55; 6, 0.55≤XCu≤1. At 4 nm, the composition ranges are: 1, 0≤XCu≤0.03; 2, 0.03≤XCu≤0.22; 3, 0.22≤XCu≤0.24; 4, 0.24≤XCu≤0.51; 5, 0.51≤XCu≤0.54; 6, 0.54≤XCu≤1.
Ascencio et al.43At the other extreme, the least stable shapes of the Au−Cu nanoalloys are the tetrahedron and the cube, which correspondingly exhibit a narrow solid solution region. These results on the stability of the Au−Cu nanoalloys may be understood in terms of geometrical considerations, that is, the surface-to-volume ratio of the different shapes (morphologies), as well as the number and type of facets play a major role. One may view this as the stress induced by the geometry to form a shape with a low number of facets; disfavoring both the tetrahedral and cubic shapes. Moreover, it is known that the surface energies follow this sequence:γ111<γ100<γ110,
44
thus those polyhedra involving a high number of (111)-faces should be favored: dodecahedra, truncated octahedra, and icosahedra. Nevertheless, the predictions can differ from the shapes observed experimentally due to the critical role played by defects and adsorbed species on the surface of the nano-particles, as already noted by Barnard and Zapol.45
For each shape investigated, by decreasing the size, the congruent melting point is shifted to lower temperature and higher copper composition (Figures 2). The size dependence of the congruent melting point is illustrated in Figure 4a, whereas the composition dependence of the congruent melting point is illustrated in Figure 4b. The shift to lower temperatures is due to the size and shape effects on melting temperature, melting enthalpy and interaction parameters. The shift at higher copper compositions is due to the size and shape effects on the interactions parametersΩlandΩs, and this is responsible of the degeneration of the regular solution into an ideal solution when size reduces. This degeneration has already been noticed by Jiang et al.46Two examples are given by the phase diagrams of the octahedron and the decahedron, which degenerate into an ideal solution (at 4 nm). The phase diagram of the tetrahedron at 4 nm indicates the impossibility to form a solid solution of Au−Cu over all the composition range except for copper composition below ∼4% and temperature ranging between
∼200 K and∼700 K. From this diagram, it seems impossible to form ordered phases with a tetrahedral shape and a size equal or smaller than 4 nm.
Compared to bulk scale, diffusion is enhanced at the nanoscale, due to a higher surface-to-volume ratio.47According to the Onsager’s theorem,48 the driving force activating diffusion is attributable to the gradient of the chemical potential between the surface and the bulk; therefore, surface segregation caused by the diffusion of atoms from the bulk to the surface
appears naturally in nanoalloys. To calculate the surface segregation of binary alloys, the Williams−Nason model,49 constructed on a bond-breaking concept allowing the non-equivalence of different sites at the surface and in the bulk, is very convenient because it rests on the knowledge of the thermodynamic properties of the bulk rather than on the surface. The solidus and liquidus compositions at the surface of the alloy are given by
= + − −Δ − −Δ x e e 1 x x
H z z kT
x x
H z z kT
solidussurface 1 / 1 / soliduscore solidus
core sub 1v 1
solidus core
soliduscore
sub 1v 1
(3) = + − −Δ − −Δ x e e 1 x x
H z z kT
x
x
H z z kT
liquidus surface 1 / 1 / liquiduscore liquidus
core vap 1v 1
liquidus core
liquidus
core vap 1v 1
(4)
Here, xsoliduscore and x liquidus
core are the bulk solidus and liquidus
composition given by the set of eqs 1, that is, when segregation is not considered. ΔHvap = |ΔHv,A−ΔHv,B| is the absolute difference in the enthalpy of vaporization of the two pure elements.ΔHsub= |ΔHs,A−ΔHs,B|is the absolute difference in the enthalpy of sublimation of the two pure elements.z1v/zvis the fraction of nearest neighbor atoms missing for atoms in the
first layer (for atoms belonging to a 111 face in afccstructure,
z1v/zv = 0.25). kT is the characteristic thermal energy. For a Au−Cu decahedron with a size edge length of 4 nm, gold segregates at the surface while copper migrates inside the core (Figure 5a). Indeed, it is favorable to have at the surface, the element alloy with the largest atomic radii (gold in our case). This reduces the total number of surface atoms required to populate the surface reducing the increase in energy due to broken bonds at the surface. Then, the component with the smallest surface energy (gold in our case) segregates to the surface. In Figure 5b, the surface composition of the decahedron (size edge length ∼4 nm) is plotted versus the core composition illustrating the gold enrichment of the surface. From this figure, we can see that to reach a composition of copper higher than ∼10% at the surface, we need to have an alloy with a composition in copper higher than
to be in the core is higher for the element with the smaller core electron density (copper in our case) that is, the element with the higher core electron density (gold in our case) will be located at the surface. Molecular dynamics simulations also confirm the preferential presence of gold at the surface.11,51,52 For very small clusters (2.88 nm), it has been shown theoretically by Wilson and Johnston,22using a semiempirical approach (Gupta many-body potential) that there is a tendency toward segregation with Cu-rich core and Au-rich surface, thus confirming the trend that we highlight within our thermody-namic approach. Monte Carlo simulations have also been used by Chen et al.25on a 55-atom Cu−Au cluster and they noticed the same behavior. Experimentally, Ascensio et al.43 could identify the existence of octahedral and decahedral Au−Cu nanoparticles. The Cu-core/Au-shell structure predicted thermodynamically for the decahedron (Figure 5) is the most stable structure in good agreement with the observations from Ascencio et al.43The instability observed by Ascencio et al. for the Au-core/Cu-shell can be explained by our thermodynamic calculations highlighting the lower melting point temperature of copper compared to gold at the nanoscale (cf. Table 2). Furthermore, the presence of copper at the surface contributes also to the instability28 due to its sensibility to oxidation. Indeed, copper is much less electronegative than oxygen,χCu≪ χO (χO = 7.54 eV).
53
We have also compared the stability of Au-core/Cu-shell and Cu-core/Au-shell decahedra of 4 nm by performing an energetic optimization of the monometallic and core−shell decahedral models using the quantum-corrected version of the Sutton−Chen potential to describe the atomic interactions.54,55 In order to compare the stability of the structures we calculated the formation energy of the core−shell decahedra, defined as the difference between total cohesive energy and the stoichiometry energy of the structure, Est =
nAuEAu+nCuECu, wherenXandEXare the number of atoms in the structure and the average energy per atom of the element X, respectively. The results are summarized in Table 3, where it
can be noted that only the Cu-core/Au-shell decahedron has a negative formation energy, about 140 eV smaller than the energy formation of the Au-core/Cu-shell decahedron, which is predicted to be unstable. Nevertheless, although the decahe-dron with a gold shell is more stable, its formation energy is comparable with the thermal energy at room conditions for a cluster of this size (about 0.024 eV/atom), and thus it is not unlikely, at least with regard to energetic considerations, tofind experimentally particles with other kinds of elemental distributions, including Au-core/Cu-shell decahedra.
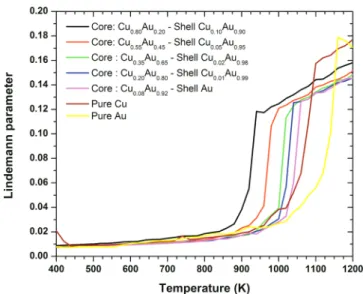
simple crystals when the rmsd reaches around 12−13% of the interatomic distance.57,58 At low temperatures, the rmsd increases linearly with temperature, until the system starts to melt and the rmsd value increases very rapidly corresponding to the divergence in rmsd observed for the bulk system. We found that for the 4 nm decahedra, a Lindemann parameter δL of around 0.12 is a good predictor for melting. The melting temperatures estimates obtained by this way are shown in Figure 6. Not surprisingly, these estimates are larger than those
predicted by the thermodynamic model, but there is consistency in the order of appearance, and it is worth to note that the Lindemann parameter starts to deviate from linearity at the same range of temperatures predicted by the thermodynamic model, as can be noted both in theδL curves and in the animations included in the Supporting Information. Experimentally, we have synthesized Au−Cu nanoparticles by wet chemistry24 (Supporting Information available). High
resolution transmission electron microscopy (HRTEM) observations, high angle annular darkfield (HAADF) imaging and energy dispersive X-ray spectroscopy (EDX) analysis have been carried out on a JEOL JEM-ARM200F probe aberration corrected electron microscope operating at 200 kV. EDX spectra were obtained using a probe size of 0.13 nm with a probe current of 140 pA and the HAADF STEM images were obtained with a convergence angle of 34 mrad and a collection semiangle varying from 50 to 180 mrad. The samples for TEM observations were prepared by dropping the colloidal solution onto nickel TEM grids and drying in air. TEM observations showed that most of the particles produced by this method exhibit a decahedral shape.59 EDX mapping of the particles reveals the presence of gold at the surface. This is shown in Figure 7 where the elemental distributions of Cu and Au inside the nanoparticle are represented by the assigned false colors red and green, respectively, from the EDX signal. This is also revealed by the brightness intensity in the HAADF image signal because it depends not just on the amount of material but also on the elements present in the atomic column parallel to the electron beam.
Furthermore, it should be noted that Au-core/Cu shell can also be favored when thiolates are present in the chemical synthesis.60 One would account for these effects, within our thermodynamic model, by the modification of the surface energies of gold and copper when they are covered by ligands or surfactants. Additionally, Au−Cu nanocatalysts are generally deposited on a support which can therefore induce a preferential segregation of one of the two metals depending on the interaction energy between the support and the metal.8 Moreover, segregation can also be suppressed by some high-temperature processing during the synthesis, such as calcina-tion, and thus favor the diffusion of both elements, leading
finally to an alloyed structure.61In fact, surface segregation is size- and support-dependent, whereas diffusion is highly temperature- and size-dependent as already demonstrated by Guisbiers et al.47
In conclusion, our thermodynamic approach gives some interesting insights concerning the behavior of several polyhedral Au−Cu nanoalloys. This paper highlights the size Figure 6. Lindemann parameter versus the temperature. The
discontinuity in δL marks the mechanical instability transition, correlated with the melting transition.
■
*
S Supporting InformationSynthesis of Au−Cu Bimetallic Nanoparticles + Molecular Dynamics Simulations. This material is available free of charge via the Internet at http://pubs.acs.org.
■
AUTHOR INFORMATIONCorresponding Author
*E-mail: [email protected]. Notes
The authors declare no competingfinancial interest.
■
ACKNOWLEDGMENTSThis project was supported by grants from the National Center for Research Resources (G12RR013646-12) and the National Institute on Minority Health and Health Disparities (G12MD007591) from the National Institutes of Health. The authors would also like to acknowledge the NSF PREM #DMR0934218 and the Mexican Council for Science and Technology, CONACYT (Mexico) through the grant CIAM 148967.
■
REFERENCES(1) Root, W. C.J. Chem. Educ.1951,28, 76−78. (2) Bray, W.Gold Bull.1978,11, 136−143. (3) Pendergast, D. M.Science1970,168, 116−118.
(4) Okamoto, H.; Chakrabarti, D. J.; Laughlin, D. E.; Massalski, T. B.
Bull. Alloy Phase Diagrams1987,8, 454−473. (5) Gong, J.Chem. Rev. 2012,112, 2987−3054.
(6) Joshi, A. M.; Tucker, M. H.; Delgass, W. N.; Thomson, K. T.J. Chem. Phys.2006,125, 194707.
(7) Yin, J.; Shan, S.; Yang, L.; Mott, D.; Malis, O.; Petkov, V.; Cai, F.; Ng, M. S.; Luo, J.; Chen, B. H.; Engelhard, M.; Zhong, C.-J.Chem. Mater.2012,24, 4662−4674.
(8) Zhang, L.; Kim, H. Y.; Henkelman, G.J. Phys. Chem. Lett.2013,4, 2943−2947.
(9) Li, W.; Wang, A.; Liu, X.; Zhang, T.Appl. Catal., A2012,433− 434, 146−151.
(10) Bracey, C. L.; Ellis, P. R.; Hutchings, G. J.Chem. Soc. Rev.2009,
38, 2231−2243.
(11) Ferrando, R.; Jellinek, J.; Johnston, R. L.Chem. Rev.2008,108, 845−910.
(12) Gao, Y.; Shao, N.; Pei, Y.; Zeng, X. C.Nano Lett. 2010,10, 1055−1062.
(13) Ozolins, V.; Wolverton, C.; Zunger, A.Phys. Rev. B1998,57, 6427−6443.
(14) Wolverton, C.; Ozolins, V.; Zunger, A.Phys. Rev. B1998,57, 4332−4348.
(15) Fitzner, K.; Guo, Q.; Wang, J.; Kleppa, O. J.J. Alloys Compd.
1999,291, 190−200.
(16) Sahara, R.; Ichikawa, H.; Mizuseki, H.; Ohno, K.; Kubo, H.; Kawazoe, Y.J. Chem. Phys.2004,120, 9297−9301.
Hu, T.; Ge, M.; Hu, F.; Xie, Z.; Pan, G.; Wei, S.ACS Nano2014,8, 1886−1892.
(25) Cheng, D.; Huang, S.; Wang, W.Eur. Phys. J. D2006,39, 41− 48.
(26) Lordeiro, R. A.; Guimaraes, F. F.; Belchior, J. C.; Johnston, R. L.
Int. J. Quantum Chem.2003,95, 112−125.
(27) Qi, W. H.; Huang, B. Y.; Wang, M. P. Physica B2009,404, 1761−1765.
(28) Xu, Z.; Lai, E.; Shao-Horn, Y.; Hamad-Schifferli, K. Chem. Commun.2012,48, 5626−5628.
(29) Su, Y.-H.; Wang, W.-L.Nanoscale Res. Lett.2013,8, 408. (30) Hume-Rothery, W.; Mabbott, G. W.; Channel Evans, K. M.
Philos. Trans. R. Soc., A1934,233, 1−97.
(31) Mizutani, U.Hume-Rothery Rules for Structurally Complex Alloy Phases; CRC Press: Boca Raton, FL, 2011.
(32) Miyajima, K.; Fukushima, N.; Himeno, H.; Yamada, A.; Mafune,́ F.J. Phys. Chem. A2009,113, 13448−13450.
(33) Miyajima, K.; Himeno, H.; Yamada, A.; Yamamoto, H.; Mafune,́ F.J. Phys. Chem. A2011,115, 1516−1520.
(34) Roberts-Austen, W. C.; Rose, T. K.Proc. R. Soc. London, Ser. A
1900,67, 105−112.
(35) Kurnakov, N. S.; Zemczuzny, S. F.Z. Anorg. Chem.1907,54, 149−169.
(36) Bronievski, W.; Wesolowski, K.Compt. Rend.1934,198, 370− 372.
(37) Bennett, H. E.J. Inst. Met.1962,91, 158−&.
(38) Jiang, Q.; Weng, Z. Thermodynamics of Materials; Springer: Berlin, 2011.
(39) Guisbiers, G.; Abudukelimu, G.J. Nanopart. Res.2013,15, 1431. (40) Guisbiers, G.; Buchaillot, L.J. Phys. Chem. C2009,113, 3566− 3568.
(41) Barnard, A. S.; Young, N. P.; Kirkland, A. I.; van Huis, M. A.; Xu, H.ACS Nano2009,3, 1431−1436.
(42) Barnard, A. S.Acc. Chem. Res.2012,45, 1688−1697.
(43) Ascencio, J. A.; Liu, H. B.; Pal, U.; Medina, A.; Wang, Z. L.
Microsc. Res. Technol.2006,69, 522−530.
(44) Vitos, L.; Ruban, A. V.; Skriver, H. L.; Kollar, J.Surf. Sci.1998,
411, 186−202.
(45) Barnard, A. S.; Zapol, P.J. Chem. Phys.2004,121, 4276−4283. (46) Liang, L. H.; Liu, D.; Jiang, Q.Nanotechnology2003,14, 438− 442.
(47) Guisbiers, G.; Buchaillot, L.Nanotechnology2008,19, 435701. (48) Mehrer, H.Diffusion in Solids; Springer: Berlin, 2007. (49) Williams, F. L.; Nason, D.Surf. Sci.1974,45, 377−408. (50) Reyes-Nava, J. A.; Rodriguez-Lopez, J. L.; Pal, U.Phys. Rev. B
2009,80, 161412.
(51) Rodriguez-Lopez, J. L.; Montejano-Carrizales, J. M.; Jose-́ Yacaman, M.Appl. Surf. Sci.2003,219, 56−63.
(52) Rodriguez-Lopez, J. L.; Montejano-Carrizales, J. M.; Pal, U.; Sanchez-Ramirez, J. F.; Troiani, H. E.; Garcia, D.; Miki-Yoshidda, M.; José-Yacaman, M.Phys. Rev. Lett.2004,92, 196102.
(54) Rafii-Tabar, H.; Sutton, A. P.Philos. Mag. Lett.1991,63, 217− 224.
(55) Çağin, T.; Kimura, Y.; Qi, Y.; Li, H.; Ikeda, H.; Johnsonb, W. L.; Goddard, W. A.Mater. Res. Soc. Symp. Proc.1999,554, 43−48.
(56) Jin, Z. H.; Gumbsch, P.; Lu, K.; Ma, E.Phys. Rev. Lett.2001,87, 055703.
(57) Lindemann, F. A.Z. Phys.1910,11, 609−615.
(58) Zahorchak, J. C.; Kesavamoorthy, R.; Coalson, R. D.; Asher, S. A.J. Chem. Phys.1992,96, 6873−6879.
(59) Khanal, S.; Casillas, G.; Bhattarai, N.; Velazquez-Salazar, J. J.; Santiago, U.; Ponce, A.; Mejia-Rosales, S.; Jose-Yacaman, M.Langmuir
2013,29, 9231−9239.
(60) Yang, H. Y.; Wang, Y.; Yan, J. Z.; Chen, X.; Zhang, X.; Hakkinen, H.; Zheng, N. F.J. Am. Chem. Soc.2014,136, 7197−7200. (61) Hai, Z.; El Kolli, N.; Bahena Uribe, D.; Beaunier, P.; Jose-Yacaman, M.; Vigneron, J.; Etcheberry, A.; Sorgues, S.; Colbeau-Justin, C.; Chen, J.; Remita, H.J. Mater. Chem. A2013,1, 10829−10835.