C
C
|
E
E
|
D
D
|
L
L
|
A
A
|
S
S
Centro de Estudios
Distributivos, Laborales y Sociales
Maestría en Economía Universidad Nacional de La Plata
Capital Accumulation, Trade Liberalization and
Rising Wage Inequality: The Case of Argentina
Pablo Acosta y Leonardo Gasparini
Capital Accumulation, Trade Liberalization,
and Rising Wage Inequality:
The Case of Argentina
Pablo Acosta*
University of Illinois at Urbana-Champaign
Leonardo Gasparini
CEDLAS - Universidad Nacional de La Plata
Revised version: July 24, 2006
Abstract
Capital accumulation can modify the relative productivity between skilled and unskilled workers, leading to changes in the wage structure. In particular, if capital goods are relatively more complementary to skilled workers, a positive correlation between investment in physical capital and the wage premium would be expected. In this paper, we present evidence for this hypothesis by taking advantage of the variability in wage premia and capital investment across industries in the Argentina’s manufacturing sector. We conclude that the wage premium for skilled workers increased more in those industries with higher investment in machinery and equipment. The overall evidence seems to indicate that industry affiliation is an important determinant of earnings differentials by skill group.
JEL classification: J31 – F16 – 033
Keywords: wage inequality, capital accumulation, trade liberalization, Argentina
*
I. Introduction
Investment in machinery and equipment can affect the wage premium for skilled workers through at least two channels. First, capital goods are usually believed to be skill-complementary (see Krusell et al., 2000, among others). Consequently, higher rates of capital investment should increase the relative productivity of skilled workers. Second, new machinery and equipment may incorporate skill-biased technological innovations. The empirical literature suggests that capital accumulation and technological change are the main reasons behind the observed rising skill premium in many developed countries.
investment merely replaced depreciated capital stock (e.g., leather and footwear), while in others net investment in machinery and equipment was strong (e.g., chemicals and petrochemicals).
This paper assesses the effect of capital accumulation on the observed wage gap between skilled and unskilled workers in the manufacturing sector in Argentina. The existing literature on the determinants of the rising wage premia in that Latin American country is limited to a study by Galiani and Sanguinetti (2003). They conclude that wage differences between skilled and unskilled workers in manufacturing sectors in Greater Buenos Aires increased more in industries with higher import penetration (explaining roughly 10% of the total wage gap increase). In contrast, other studies on Latin American countries—Attanasio et al. (2004) in the case of Colombia and Pavcnik et al. (2004) for Brazil—find no significant impact of trade liberalization on industry-specific skill premia.
To the best of our knowledge, this is the first paper that provides evidence of the relationship between capital investment and skill premium in Latin America. Related studies include Pavcnik (2003), who presents evidence on the complementary relationship between skill-upgrading and the adoption of new technologies at the plant level in Chile, and Goldberg and Pavcnik (2005), who relate gross capital accumulation levels to industry rents in Colombia. Neither study finds a significant impact of investment (as opposed to trade exposure) on industry-specific skill premia. Other studies in Latin America suggest that technological progress could be behind the increase in wage inequality in the region, although they arrive at this conclusion indirectly (Behrman et al., 2001; Sánchez-Páramo and Schady, 2003).
the Permanent Household Survey (EPH) between 1991 and 2001, as well as official data on import penetration, exports, and investment in machinery and equipment in manufacturing sectors (see the Appendix for a detailed description of the data). Our results suggest that in sectors in which capital accumulation has been more intense, the wage gap between skilled and unskilled workers has significantly widened. Although we are unable to identify causal effects, we take the results as preliminary evidence for the major impact of capital accumulation on wage inequality in the manufacturing sector of Argentina.
The remainder of the paper is organized as follows. Section II presents the evolution of wages and employment by educational group in Argentina. Section III is a brief review of some theoretical arguments linking physical capital to the wage structure. Section IV shows the results at the industry level of the links between capital accumulation and industry-specific skill premia, while section V contains a similar analysis, but at the individual level. The paper concludes with some brief comments in section VI.
II. Wages and employment
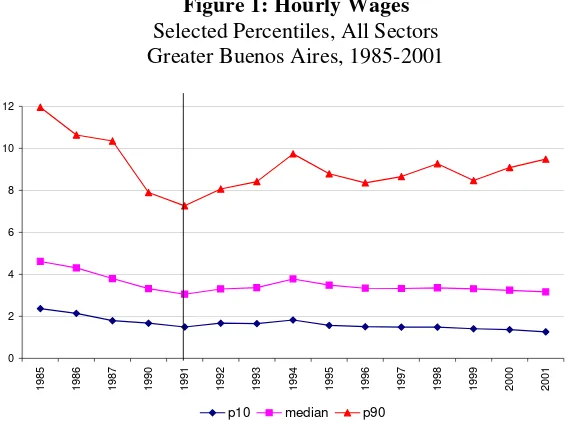
Wage inequality substantially increased in Argentina during the 1990s, compared to previous decades.1 Figure 1 shows real hourly wages for workers between 18 and 65 years of age in Greater Buenos Aires (GBA), the main urban area of Argentina (34% of total population).2 The figure shows the evolution of real hourly wages for the median worker and those located at the 90th and 10th percentiles. The wage gap between these two percentiles shrunk during the 1980s, mainly due to decreasing real wages for individuals at the top of the distribution, and widened
1
between 1991 and 2001. In that period, while the median hourly wage increased 4%, real wages increased 31% for workers at the 90th percentile, and fell 15% for workers at the 10th percentile.
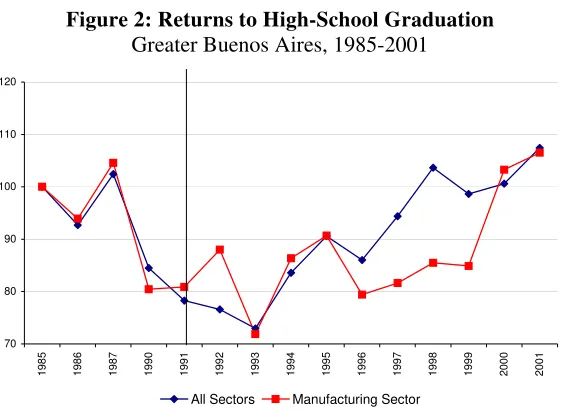
This paper is aimed at exploring changes in wages by skill group. Figure 2 shows the evolution of the wage premia for skilled workers (defined as those with at least a high school degree) for the period 1985-2001 in Greater Buenos Aires, both across all sectors in the economy and only in the manufacturing sector (20% average employment share during this period). The skill premium for each year is calculated by regressing the logarithm of hourly wage of the main occupation on a high school graduation indicator, along with other controls such as age, age squared, and gender (population weights considered). The skill premium declined until 1993, from where it started an ascending path, and returns to high school graduation increased by 48% between 1993 and 2001 in the manufacturing sector (47% for the whole economy). Changes for the rest of the urban areas also have been significant, although milder; the skill premium rose 15% in the manufacturing sector and 27% in the economy.
If each skill group is homogeneous and the labor market adjusts quickly, the wage gap between the skilled and the unskilled should not differ across economic sectors. Instead, with unobservable heterogeneity and high adjustment costs, industry differences in the wage structure could persist for a long period of time (Hamermesh, 1993).3 We compute the sector-specific skill premium by means of the following specification:
ijt jt ijt ijt I ijt X ijt
ijt X I I S SP
w )= β + β +( * )* +ε
ln( (1) where wijt is the hourly wage of individual i working in industry j at time t, Xijt is a vector of workers’ characteristics (age, age squared, gender, and regional indicators), Iijt is a set of industry
2
GBA is one of the few regions for which household survey data prior to 1991 is available.
3
indicators, and Sijt is an indicator for whether worker i in industry j at time t is skilled (has a high
school degree). The coefficients SPjt are the sector-specific skill premia, representing the
additional wage skilled workers earn in a given industry at time t, compared to the base wage received for both skilled and unskilled workers in each industry.
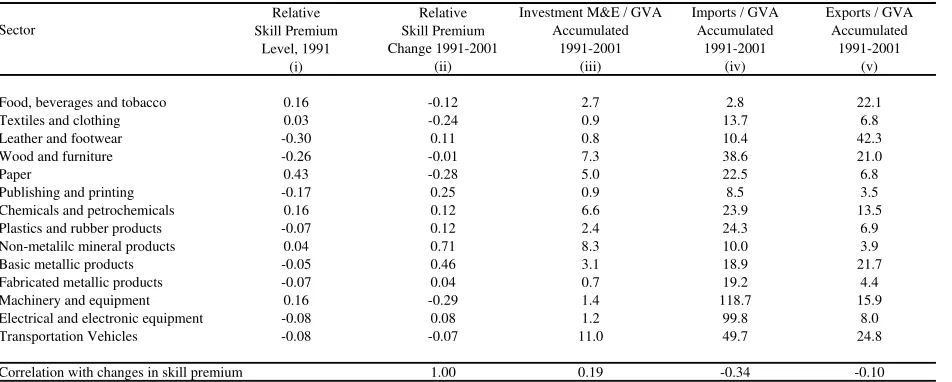
The first column in Table 1 shows the set of relative industry-specific skill premia for the year 1991 in all urban areas with household survey coverage (see Appendix). These are calculated setting the omitted industry-specific skill premium to zero and then expressed as deviations from the employment-weighted average skill premium (Krueger and Summer, 1988). Each value represents the proportional wage difference through an industry-specific skill premium for a skilled worker in a given industry relative to the average skilled worker in the economy with the same observable characteristics. Table 1 confirms the existence of substantial differences in skill premium levels and changes across manufacturing sectors in Argentina.
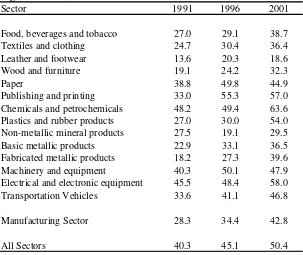
Changes in wage differentials by educational levels could be attributed to supply-side factors, such as changes in the scarcity of educated workers. The hypothesis of rising wage inequality due to the falling relative supply of skilled workers seems implausible in Argentina. The proportion of 18- to 65 year-old individuals with a high school degree in Greater Buenos Aires jumped from 26% in 1985 to 46% in 2001. In all of urban Argentina, the change was similar—from 37% in 1991 to 46% in 2001.4 Table 2 shows that the national employment share of skilled workers increased in every industry during the 1990s. In 1991, 28% of manufacturing workers were skilled, and that share climbed to 43% in 2001.
In summary, during the 1990s, Argentina witnessed a significant growth in the labor supply and employment of skilled individuals, along with a substantial increase in the wage premia to
4
these workers, which suggests strong changes in the relative labor demands. In sections IV and V, we exploit the variability in relative wages across industries in order to relate changes in wage premia to demand-shift explanations. But first, in the next section, we briefly present a theoretical argument linking the wage premia to capital investment.
III. Capital investment, technology, and wages
One of the arguments to explain rising wage inequality relies on physical capital investments. If machines and equipment are skilled-complementary, an increase in capital utilization levels should lead to an increase in the relative productivity of skilled workers and, consequently, a rise in the wage premia. Following Krusell et al. (2000), we propose an illustrative model with implications for the changes in industry-specific skill premia. Assume that firms within a specific sector n produce q units with a constant-elasticity-of-substitution (CES) technology, and three inputs: capital (k), skilled workers (ls), and unskilled workers (lu), expressed in terms of efficiency units. To simplify the analysis, assume also that the elasticity of substitution between skilled and unskilled workers is equal to the elasticity of substitution between unskilled workers and capital.5
(
)
n n n n n n snt snt n nt n n unt unt nnt h k h
q σ ρ σ ρ ρ σ θ λ λ ψ ψ θ 1 ) )( 1 ( ) 1 ( ) ( ⎥ ⎦ ⎤ ⎢ ⎣ ⎡ + − + −
= (2)
Each labor input is the product of worked hours (h) and an efficiency index. For skilled workers, ls=ψshs, while for the unskilled lu=ψuhu. θ and λ represent the factor shares, while σ and
ρ (both less than 1) determine the elasticity of substitution between inputs. Specifically, the
5
elasticity of substitution between capital and unskilled labor is δ=1/(1-σ), which is also equal (by assumption) to the elasticity of substitution between skilled and unskilled workers. The elasticity of substitution between capital and skilled labor is γ=1/(1-ρ). A higher complementarity between capital and skilled labor, compared to the complementarity between capital and unskilled labor, requires that σ be greater than ρ.
From equation (2) and assuming that wages are equal to the marginal productivity of labor, the skill premium πnt (the wage ratio between skilled and unskilled workers) for sector n at time t
can be written as:
(
)
( )
1 (1 )(1 )
1
n n
n n n
n n unt unt snt
nt n n
n snt snt unt
k h l h σ ρ n ρ ρ σ σ θ λ ψ π λ λ θ ψ − − ⎡ ⎛ ⎞ ⎤ ⎛ ⎞ ⎛ ⎞ − − ⎢ ⎥ = ⎜ ⎟ + − ⎜ ⎟ ⎜ ⎟ ⎢ ⎝ ⎠ ⎥ ⎝ ⎠ ⎝ ⎠ ⎣ ⎦ (3)
Taking logs, differentiating (3) with respect to time, and denoting the rate of growth of the variable x as gx, yields:
( 1)( ) ( ) ( ) ( kt hst hut)
st t ut st hut hst
t g g g
l k g g g g
g ⎟⎟ − −
⎠ ⎞ ⎜⎜ ⎝ ⎛ − + − + − − ≈ ρ ψ ψ
π
σ
σ
σ
ρ
λ
(4)Even when capital is not skill-complementary, higher capital accumulation levels could increase the skill premium π. If new capital goods incorporate imbedded technological change, an increase in investment in new machinery and equipment can accelerate the adoption of new technologies. Incorporation of capital associated with new technologies (e.g., computers and information technology) can increase skilled workers’ relative efficiency, thus generating a rise in the skill wage gap.
In equation (4), capital incorporation associated with new technologies would increase skilled workers’ relative efficiency through the second term of the equation (gψst - gψut). Many
authors share the view that skill-biased technological change is the main factor behind the observed changes in the wage structure in developed countries in the last few decades.6 If skill-biased technologies developed in the North are transmitted to the South, we would expect industries that invest heavily in foreign capital goods to have a higher increase in skill premium through the increase in the relative efficiency of skilled workers. Some recent papers suggest that skill-biased technological change can be transferred through trade, in particular through imports with high R&D content (Attanasio et al., 2004; Pavcnik et al., 2004; Sánchez-Páramo and Schady, 2004).
Of course, there are other factors that can affect the wage structure that are not being considered in equation (4). In particular, two have been extensively studied in the economic literature: labor institutions and international trade. The declining power of unions and the reduction in the minimum wage may have negatively affected unskilled workers’ wages. Unions tend to reduce the wage gap through collective bargaining, compressing the distribution of
6
earnings. If these institutions lose power, the force that prevents a reduction in the relative wages of the low-skilled workers weakens (see DiNardo et al., 1996). Economic theory also predicts changes in the wage structure caused by changes in international trade. According to the Stolper-Samuelson theorem, if tariff reductions are proportionally larger in sectors employing relatively more unskilled workers, these workers will experience a decline in their relative wages.7
In principle, the three explanations—capital accumulation, trade liberalization, and declining union power—could apply to the Argentinean case. First, there is some evidence of the decline of union membership in Argentina. Sánchez-Páramo and Schady (2004) report a fall in union density from 27.4% in the 1980s to 24.6% in 1995/99.
Second, Argentina witnessed strong physical capital incorporation during the 1990s (Acosta and Loza, 2005). Foreign Direct Investment increased at an annual growth rate of 11.2% between 1991 and 2000, and Fixed Gross Investment in machinery and, during the same period, equipment grew at 6.8% per year. The relative price of capital goods declined 10% between 1993 and 2000, with respect to other manufacturing goods, presumably due to the real exchange rate appreciation and tariff reductions. The largest import tariff reductions were implemented in durable goods, machinery, and transport equipment, from an average of 60% in 1988, to 23% in 1991, and 12% in 1993 (Berlinski, 2003). These changes, together with a more favorable business environment for investment, generated a significant increase in the capital stock, particularly of imported machinery and equipment. FIEL (2002) estimates that the physical capital stock (excluding the public sector) grew by 20% between 1992 and 1999.
Tariff reductions were not limited to capital goods. Trade liberalization started gradually by the end of the 1980s and was extended to almost all sectors in the economy during the 1990s.
7
Berlinski (2003) reports that, in most manufacturing sectors, tariffs declined in the 1990s from a weighted average of 48% in 1988 to 16% in 1997. Changes in trade policy also included the end of sector-specific subsides with protectionist goals, the elimination of most non-tariff barriers, and a commercial agreement with neighbor countries (Mercosur).
IV. Industry-Specific Skill Premium, Capital, and Trade Exposure
Neither physical capital accumulation nor changes in international trade (and, presumably, in unionization rates) have occurred with the same intensity across industries. In this section, we exploit the variability in capital investment and import penetration across industries in order to associate these phenomena to changes in the wage structure. It is important to point out from the start that it is difficult to explain differences in capital accumulation paths adopted by manufacturing industries in Argentina with the data at hand. If, as we presume, differences in the intensity of capital investment in the 1990s were mainly driven by factors not correlated with skill premium changes (e.g., differences in the distance to the technological frontier after a decade— the 1980s—without investments or differential capital tax treatments), then our results can be interpreted as preliminary evidence of the causal effect of capital accumulation over the wage structure. If, instead, other underlying factors were driving both capital investment and wages, the results of this paper are just empirical evidence of the strength of the correlations between these variables.
the period 1990-2001, based on firm surveys (see Appendix for data sources). We normalize this variable using sectoral gross value-added (GVA) to get a proper capital accumulation measure. This indicator has some limitations. It is restricted to the manufacturing sector and captures gross investment, instead of capital stock or net investment. Additionally, the indicator does not identify whether the new machines incorporate new technology, so we cannot distinguish between technological change and pure capital accumulation effects (second and third terms in equation 4).
The last three columns in Table 1 show investment in machinery and equipment, import penetration, and exports for the period 1991-2001 (as a share of accumulated gross value added). The classification into 14 manufacturing sectors (as opposed to the 22 sectors’ standard two-digit ISIC) is due to two reasons: (a) in Argentina, official statistics on capital accumulation are broken down in 17 sectors; and (b) three of these 17 sectors have small employment shares (less than 1%) in the manufacturing sector and are therefore merged into other similar product categories.
The simple linear correlation of changes in capital accumulation and in the skill wage premia between 1991 and 2001 is 0.193. When we pool all industries and years in the sample (14 industries x 11 years), changes in skill premium are weakly correlated with changes in investment in machinery and equipment (0.107), negligibly correlated with changes in import penetration (0.036), and negatively correlated with export ratios (-0.089).
To evaluate the determinants of industry-specific skill premia, we start with a reduced-form specification at the industry level (see Attanasio et al., 2004, and Pavcnik et al., 2004):
jt I j T t X jt M jt K jt
jt K M X T I
added and expressed in logarithms. A vector of additional control variables (Xjt) captures other
observable time-varying industry factors, such as exports (as a share of GVA), and the skilled/unskilled and male/female employment ratios. The vectors Tt and Ij are the sets of year and industry indicators. To account for heteroscedasticity and serial correlation in the error term (µjt), robust Huber-White standard errors are computed, clustered at the industry level. We also estimate equation (5) in first differences. Following Krueger and Summers (1988), each sector-year observation is weighted by the inverse of the standard error of the sectorial skill premium (using the standard error of the intercept for the omitted sector).8 The coefficients on capital accumulation and import penetration should not be capturing industry differences in worker composition correlated with investment decisions or trade protection policies, as in order to construct industry-specific skill premia we had to first control for worker characteristics. Similarly, as suggested in Pavcnik et al. (2004), because returns to worker characteristics are allowed to differ year by year in the computation of skill premia, all economy-wide changes in returns to worker characteristics associated with changes in labor supply over time are already taken into account.
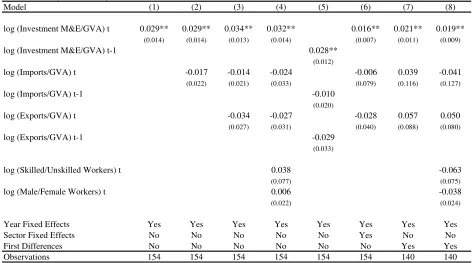
Table 3 presents the results for the models of skill premium in levels (columns 1 to 6) and first differences (columns 7 and 8). The numbers in the first column suggest that capital investment levels are positively and significantly correlated with skill premium at the industry level. Of course, other controls need to be taken into account. The second column, for instance,
8
introduces import penetration ratios as a means to determine whether they also have an influence on the wage structure. While capital accumulation remains significant, there is no impact from the import penetration variable.
Other time-varying industry characteristics may affect the wage structure. Although presumably posing endogeneity concerns, columns 3 to 6 add export ratios and skilled/unskilled and male/female employment ratios as control variables. For instance, workers with different educational levels (or gender) might differ in their ability to bargain over wages. Indeed, Revenga (1997) finds that, in Mexico, the higher the proportion of unskilled workers in a given sector, the lower their ability to capture industry rents. Table 3 shows that all control variables are non-significant. Adding controls does not substantially change the main result of the effect of capital investment on the skill wage premia.
As discussed above, differences in capital investment across industries may not be exogenous. Some unobserved factors could potentially cause some industries to simultaneously increase investments in physical capital and bid up the wage of skilled workers. A higher skill premium could have been caused by an unobserved demand shifter (e.g., technological change), with industries increasing both physical capital and skilled labor at the same time in order to increase output. If this is the case, the evidence would still suggest that skilled labor and physical capital are complements in production in these industries, but this does not mean that capital accumulation was the cause of rising skill premia. This endogeneity concern also can apply to the case of import penetration and exports, as trade flows depend on factor costs.
costs to capital, as firms would prefer to smoothly increase capital stock over time. Using lagged right-hand-side variables addresses an additional concern: the effect of capital investment on relative labor productivity may not be contemporaneous. The results in column 5 are similar to those in column 3. The coefficient on capital accumulation is a little lower (0.027) than the one for the contemporaneous case (0.034).
Other time-invariant characteristics at the industry level could be correlated with capital investment and the wage structure. To take that into account in column 6, we add sector fixed effects. The coefficient of capital accumulation is reduced to half (0.015), but it is still significant at the 5% level. Even by controlling for specific characteristics at the industry level, the main result of interest remains significant.
Columns 7 and 8 present the regression specification in first differences. Changes in investment in machinery and equipment have a positive and significant effect on changes in sector skill premia. In contrast, changes in import penetration and export ratios are not significantly correlated with changes in wage differentials by educational level. The addition of other controls does not affect this result.
In summary, at the industry level, capital accumulation seems to be positively and significantly correlated with relative wages for skilled workers. In contrast, trade exposure does not appear to be related to changes in the skill premium. The next section assesses whether this result remains valid when looking at individual-level data in a traditional wage equation.
In this section, we extend the methodology to take advantage of household survey data at the individual level. The equation to be estimated is an individual-level Mincer-type semi-log wage regression. The dependent variable is the logarithm of the real hourly wage of the main occupation, which is regressed on variables that interact the individual educational level with sector specific capital accumulation and import penetration variables. Specifically:
i C c i R r i T t i Z t i i g k g i g i g m g i g i g E gt g i i i C R T Z T k E m E E T w
ε
β
β
β
β
β
β
β
+ + + + + + + + =∑
∑
∑
= = = 3 1 3 1 3 2 ln (6)where wi is individual i’s hourly wage in his or her main activity. For simplicity, in the notation, we ignore the rest of the subscripts. Each individual i has associated an industry j where he or she works, a city c where he or she lives, and a time period t in which he or she was interviewed by the household survey. We consider three educational groups: without a high-school degree (g = 1), high-school graduates ( g= 2), and college graduates ( g= 3). Eg is the indicator variable for educational level g. The contributions of this model, compared to a typical wage equation, are included in the second and third terms of equation (6). The variable mi(ki) denotes the logarithm
of import penetration (capital accumulation) over gross value added for the sector where individual i worked in year t. As these variables interact with educational dummies, the model allows import penetration and capital accumulation to have differential effects by skill. The regression also includes control variables (Zi) at the individual level (gender, age). The estimated coefficients for the educational dummies and for control variables Z are allowed to vary by year (Ti is the set of year dummies). Finally, equation (6) includes time (T), industry (R), and city (C) fixed effects.
u does not have a high-school degree. From equation (6) and denoting with a “hat” the estimated value of the coefficients,
(
) (
)
(
k k)
s sm m E
t E
t u
s w m k
wˆ ln ˆ ˆ3 ˆ2 ˆ3 ˆ2 ˆ3 ˆ2
ln − = β −β + β −β + β −β (7) where ms = mu and ks = ku, since both individuals work in the same sector. The wage premia is the sum of three terms: the traditional one and those capturing the effects of import penetration and capital accumulation. Based on the discussion in section III, all three differences are expected to be positive.
Equation (6) is estimated for individuals aged 18 to 65, with positive wage earnings and working in the manufacturing sector between 1991 and 2001. This part of the analysis resembles Galiani and Sanguinetti’s (2003) study. We extend their paper in two directions: (i) expanding the geographical analysis to most of the urban areas in Argentina (and therefore substantially increasing the sample size) and, more importantly, (ii) evaluating an additional source of differences in the observed wage gaps by sector—capital accumulation.
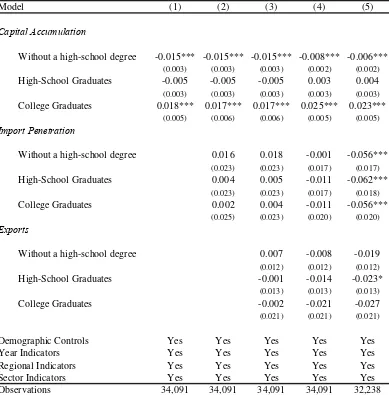
Table 4 shows the results of estimating equation (6) using weighted least squares. For simplicity, we exclude the estimated coefficients for the control variables. The first column starts by looking at capital accumulation coefficients. Investment in machinery and equipment is positively correlated with the wage gaps by skill level. An additional 1% investment in machinery and equipment (as a share of gross value added) is associated with a 3.3% increase in the wage gap between college graduates and high-school dropouts. Column 2 adds import penetration by sector; no significant association between this variable and the wage gap is found.9 The results do
9
not vary in column 3, where we control for export ratios. Similarly, results do not significantly change when capital accumulation, import, and export ratios are introduced lagged one and two periods, respectively (see columns 4 and 5).
As discussed above, we interpret these results as preliminary evidence of the importance that investment in machinery and equipment had in shaping the wage structure in Argentina during the 1990s. Of course other explanations are possible. One may argue, for instance, that high-investment sectors are presumably more likely to be the ones having higher profits. In the presence of rent sharing in wage determination, the estimates reported may be capturing a rent sharing advantage of skilled workers in those sectors (Revenga, 1997). It is difficult to disentangle this effect in the absence of data on wage compensation practices, although it is widely cited in the literature of compensations that rent sharing practices are less common in developing countries.
V. Final comments
Capital accumulation can increase the wage gap between skilled and unskilled workers if capital is skill-complementary, and if it has incorporated skilled-biased technological change. The evidence for developed countries indicates that this phenomenon is important in accounting for the observed increase in the wage premia during the last decades. Argentina seems to have adopted these results as a consequence of the accelerated capital incorporation process that occurred during the 1990s.
that higher investment in machinery and equipment in a particular industry is associated with an increase in the wage premia for skilled workers in that industry. The investment effect seems to have been substantially larger than the trade exposure effect.
References
Acemoglu, D. 2002. “Technical change, inequality, and the labor market.” Journal of Economic
Literature 40, 7-72.
Acosta, P., A. Loza. 2005. “Short and long run determinants of private investment in Argentina.”
Journal of Applied Economics 8, 389-406.
Attanasio, O., P. Goldberg, and N. Pavcnik. 2004. “Trade reforms and wage inequality in Colombia.” Journal of Development Economics 74, 331-366.
Autor, D., L. Katz, and M. Kearney. 2006. “The polarization of the U.S. labor market.” NBER Working Paper 11986.
Autor, D., L. Katz, and A. Krueger. 1998. “Computing inequality: have computers changed the labor market?” Quarterly Journal of Economics 113, 1169-1213.
Autor, D., F. Levy, and R. Murnane. 2001. “Upstairs, downstairs: computers and skills on two floors of a large bank.” Industrial and Labor Relations Review 55, 432-447.
Berhman, J., N. Birsdall, and M. Szekely. 2001. “Economic Policy and Wage Differentials in Latin America.” University of Pennsylvania, PIER Working Paper 01-048.
Berlinski, J. 2003. “International Trade and Commercial Policy.” In A New Economic History of
Argentina, Della Paolera, G., Taylor, A. (Eds.), Cambridge University Press.
Card, D., and J. DiNardo. 2002. “Skill biased technological change and rising wage inequality: some problems and puzzles.” Journal of Labor Economics 20, 733-783.
CEDLAS. 2006. Socioeconomic database for Latin America and the Caribbean.
www.depeco.econo.unlp.edu.ar/cedlas
DiNardo, J., N. Fortin, and T. Lemieux. 1996. “Labor Market Institutions, and the distribution of wages, 1973-1992: A Semiparametric Approach.” Econometrica, 64, 1001-1044.
Feenstra, R., and G. Hanson. 1999. “The impact of outsourcing and high-technology capital on wages: estimates for the United States, 1979-1990.” Quarterly Journal of Economics 114, 907-940.
FIEL. 2002. Productividad, competitividad y empresas. Los engranajes del crecimiento. Buenos Aires, Argentina.
Gasparini, L. 2003. “Argentina´s distributional failure.” Unpublished manuscript, Inter-American Development Bank.
Goldberg, P., and N. Pavcnik. 2005. “Trade, wages, and the Political Economy of Trade Protection: Evidence from the Colombian Trade Reforms.” Journal of International
Economics 66, 75-105.
Goldin, C., and L. Katz. 1998. “The origins of technology-skill complementarity.” Quarterly
Journal of Economics 113, 693-732.
Gottschalk, P., and T. Smeeding. 1997. “Cross-national comparisons of earnings and income inequality.” Journal of Economic Literature 35, 633-687.
Haisken-DeNew, J., and C. Schmidt. 1997. “Interindustry and interregion differentials: Mechanics and interpretation.” Review of Economics and Statistics 79, 516-521.
Hamermesh, D. 1993. Labor Demand. Princeton University Press, N.J.
Heckman, J., and C. Pages-Serra. 2000. “The cost of job security regulation: Evidence from Latin American Labor Markets.” Economia, Journal of the Latin American and Caribbean
Economic Association 1, 109-154.
Katz, L., and K. Murphy. 1992. “Changes in relative wages in the United States: Supply and demand factors.” Quarterly Journal of Economics 107, 35-78.
Krueger, A., and L. Summers. 1988. “Efficiency wages and the inter-industry wage structure.”
Econometrica 56, 259-293.
Krusell, P., L. Ohanian, J. Ríos-Rull, and G. Violante. 2000. “Capital-skill complementarity and inequality: a macroeconomic analysis.” Econometrica 68, 1029-1053.
Leamer, E. 1995. “Trade, wages and revolving-door ideas.” NBER Working Paper 4716.
Lora, E. 1997. “Una década de reformas estructurales en América Latina: que ha sido reformado y cómo medirlo.” Papel de trabajo No.348 del IDB-OCE. Washington, DC: Inter-American Development Bank.
Pavcnik, N. 2003. “What explains skill upgrading in less developed countries?” Journal of
Development Economics 71, 311-328.
Pavcnik, N., A. Blom, P. Goldberg, and N. Schady. 2004. “Trade liberalization and industry wage structure: Evidence from Brazil.” World Bank Economic Review 18, 319-344.
C. Sanchez-Paramo, and N. Schady. 2003. “Off and Running? Technology, trade, and the rising demand for skilled workers in Latin America.” World Bank, Policy Research Working Paper 3015.
Wood, A. 1994. North-South trade, employment and inequality: changing fortunes in a skill
driven world. Oxford University Press.
Appendix: Data Sources
Labor Force Data
Labor market data comes from Encuesta Permanente de Hogares (EPH), the nationally representative household survey of Argentina. For the period 1991-2001 repeated cross sectional data is available, covering 28 urban areas: Buenos Aires, Greater Buenos Aires, Bahia Blanca, Catamarca, Comodoro Rivadavia, Cordoba, Corrientes, Formosa, Jujuy, La Plata, La Rioja, Mar del Plata, Mendoza, Neuquen, Parana, Posadas, Resistencia, Rio Cuarto, Rio Gallegos, Rosario, Salta, San Juan, San Luis, Santa Fe, Santa Rosa, Santiago del Estero, Tierra del Fuego, and Tucuman. These areas account for nearly two-thirds of the total country’s population.
The analysis is restricted to the manufacturing sector, and to 18-65 years old individuals (males and females) with positive earnings. The wage measure is the hourly wage of the main occupation, deflated by the monthly national consumer price index (expressed in 1999 pesos). The main education indicator is completed years of schooling: workers are classified into (i) those with no high-school degree, (ii) with at most a high-school degree, and (iii) with a university degree. Primary education in Argentina consists of seven years of schooling, while secondary education comprises five years of schooling.
Capital Accumulation Data
Data on machinery and equipment gross investment by manufacturing sector (at current prices) comes from the local Secretary of Industry (Base de Inversiones, Centro de Estudios para la Produccion, Secretaria de Industria, Comercio y PyME, Ministerio de Economia y Producción,
www.cep.gov.ar). Estimates of capital accumulation by sector, based on firm surveys, are available for the period 1990-2001.
employment shares. The 14 sectors considered in the analysis are: Food, Beverages and Tobacco; Textiles and Clothing; Leather and Footwear; Wood and Furniture; Paper; Publishing and Printing; Chemicals and Petrochemicals; Plastics and Rubber Products; Non-metallic Mineral Products; Basic Metallic Products; Fabricated Metallic Products; Machinery and Equipment; Electrical and Electronic Equipment; and Transportation Vehicles.
Trade Exposure Data
Data on imports and exports by manufacturing sector (at current prices) comes from the Institute for the Integration of Latin America and the Caribbean (INTAL), at the Inter-American Development Bank (IADB). The two-digit ISIC classification was matched into the 14 sectors used for the capital accumulation measures.
Gross Value Added Data
Gross Value Added (at current prices) by manufacturing sector (at two-digit ISIC classification) is available at the local statistical agency (INDEC, Instituto Nacional de Estadisticas y Censos,
Figure 1: Hourly Wages Selected Percentiles, All Sectors Greater Buenos Aires, 1985-2001
0 2 4 6 8 10 12
1985 1986 1987 1990 1991 1992 1993 1994 1995 1996 1997 1998 1999 2000 2001
p10 median p90
Source: Own calculations based on the Permanent Household Survey (EPH), October round. Note 1: Real wages in 1999 pesos (deflated by CPI).
Figure 2: Returns to High-School Graduation Greater Buenos Aires, 1985-2001
70 80 90 100 110 120
198
5
198
6
198
7
199
0
199
1
199
2
199
3
199
4
199
5
199
6
199
7
199
8
199
9
200
0
200
1
All Sectors Manufacturing Sector
Source: Own calculations based on the Permanent Household Survey (EPH), October round. Note 1: The skill premium for each year is calculated by regressing the logarithm of hourly wage of the main occupation on a high school graduation indicator, along with other controls such as age, age squared, and gender (population weights considered).
Table 1
Relative Skill Premium, Investment in Machinery and Equipment, Import Penetration, and Exports by Manufacturing Sector
Argentina, 1991-2001
Relative Relative Investment M&E / GVA Imports / GVA Exports / GVA Skill Premium Skill Premium Accumulated Accumulated Accumulated
Level, 1991 Change 1991-2001 1991-2001 1991-2001 1991-2001
(i) (ii) (iii) (iv) (v)
Food, beverages and tobacco 0.16 -0.12 2.7 2.8 22.1 Textiles and clothing 0.03 -0.24 0.9 13.7 6.8 Leather and footwear -0.30 0.11 0.8 10.4 42.3 Wood and furniture -0.26 -0.01 7.3 38.6 21.0
Paper 0.43 -0.28 5.0 22.5 6.8
Publishing and printing -0.17 0.25 0.9 8.5 3.5 Chemicals and petrochemicals 0.16 0.12 6.6 23.9 13.5 Plastics and rubber products -0.07 0.12 2.4 24.3 6.9 Non-metalilc mineral products 0.04 0.71 8.3 10.0 3.9 Basic metallic products -0.05 0.46 3.1 18.9 21.7 Fabricated metallic products -0.07 0.04 0.7 19.2 4.4 Machinery and equipment 0.16 -0.29 1.4 118.7 15.9 Electrical and electronic equipment -0.08 0.08 1.2 99.8 8.0 Transportation Vehicles -0.08 -0.07 11.0 49.7 24.8
Correlation with changes in skill premium 1.00 0.19 -0.34 -0.10 Sector
Source: Own calculations based on the Permanent Household Survey (EPH), October round; CEP, Secretaría de Industria, Comercio y PyME (investment); INTAL, Inter-American Development Bank (imports, exports). Note 1: Relative industry-specific skill premia are expressed as deviations from the employment-weighted average skill premium for the manufacturing sector (Krueger and Summer, 1988).
Table 2
Skilled Employment by Manufacturing Sector
(Percentage of Employees with High School Degree by Sector) Argentina 1991, 1996, 2001
Sector 1991 1996 2001
Food, beverages and tobacco 27.0 29.1 38.7
Textiles and clothing 24.7 30.4 36.4
Leather and footwear 13.6 20.3 18.6
Wood and furniture 19.1 24.2 32.3
Paper 38.8 49.8 44.9
Publishing and printing 33.0 55.3 57.0
Chemicals and petrochemicals 48.2 49.4 63.6
Plastics and rubber products 27.0 30.0 54.0
Non-metallic mineral products 27.5 19.1 29.5
Basic metallic products 22.9 33.1 36.5
Fabricated metallic products 18.2 27.3 39.6
Machinery and equipment 40.3 50.1 47.9
Electrical and electronic equipment 45.5 48.4 58.0
Transportation Vehicles 33.6 41.1 46.8
Manufacturing Sector 28.3 34.4 42.8
All Sectors 40.3 45.1 50.4
Table 3
Models of Industry-Specific Skill Premia for High-School Graduates
Estimation at the industry level
Manufacturing Sector, Argentina, 1991-2001
Model (1) (2) (3) (4) (5) (6) (7) (8) log (Investment M&E/GVA) t 0.029** 0.029** 0.034** 0.032** 0.016** 0.021** 0.019**
(0.014) (0.014) (0.013) (0.014) (0.007) (0.011) (0.009)
log (Investment M&E/GVA) t-1 0.028**
(0.012)
log (Imports/GVA) t -0.017 -0.014 -0.024 -0.006 0.039 -0.041
(0.022) (0.021) (0.033) (0.079) (0.116) (0.127)
log (Imports/GVA) t-1 -0.010
(0.020)
log (Exports/GVA) t -0.034 -0.027 -0.028 0.057 0.050
(0.027) (0.031) (0.040) (0.088) (0.080)
log (Exports/GVA) t-1 -0.029
(0.033)
log (Skilled/Unskilled Workers) t 0.038 -0.063
(0.077) (0.075)
log (Male/Female Workers) t 0.006 -0.038
(0.022) (0.024)
Year Fixed Effects Yes Yes Yes Yes Yes Yes Yes Yes Sector Fixed Effects No No No No No Yes No No First Differences No No No No No No Yes Yes Observations 154 154 154 154 154 154 140 140
Note 1: * Significant at 10% level. ** Significant at 5% level. *** Significant at 1% level.
Note 2: Industry-specific skill premia in each year are expressed as deviations from the employment-weighted average skill premium for the manufacturing sector of the corresponding year (Krueger and Summer, 1988). Note 3: Each sector-year observation is weighted by the inverse of the standard error of the sectorial skill premium (Krueger and Summer, 1988).
Table 4
Models of Skill Premia for High-School Graduates
Dependent Variable: Logarithm of the real hourly wage of the main occupation
Estimation at the individual level(males and females aged 18 to 65, with positive wage earnings) Manufacturing Sector, Argentina, 1991-2001
(1) (2) (3) (4) (5)
Capital Accumulation
Without a high-school degree -0.015*** -0.015*** -0.015*** -0.008*** -0.006***
(0.003) (0.003) (0.003) (0.002) (0.002)
High-School Graduates -0.005 -0.005 -0.005 0.003 0.004
(0.003) (0.003) (0.003) (0.003) (0.003)
College Graduates 0.018*** 0.017*** 0.017*** 0.025*** 0.023***
(0.005) (0.006) (0.006) (0.005) (0.005)
Import Penetration
Without a high-school degree 0.016 0.018 -0.001 -0.056***
(0.023) (0.023) (0.017) (0.017)
High-School Graduates 0.004 0.005 -0.011 -0.062***
(0.023) (0.023) (0.017) (0.018)
College Graduates 0.002 0.004 -0.011 -0.056***
(0.025) (0.023) (0.020) (0.020)
Exports
Without a high-school degree 0.007 -0.008 -0.019
(0.012) (0.012) (0.012)
High-School Graduates -0.001 -0.014 -0.023*
(0.013) (0.013) (0.013)
College Graduates -0.002 -0.021 -0.027
(0.021) (0.021) (0.021)
Demographic Controls Yes Yes Yes Yes Yes
Year Indicators Yes Yes Yes Yes Yes
Regional Indicators Yes Yes Yes Yes Yes
Sector Indicators Yes Yes Yes Yes Yes
Observations 34,091 34,091 34,091 34,091 32,238
Model
Note 1: * Significant at 10% level. ** Significant at 5% level. *** Significant at 1% level. Note 2: The regression also includes demographic controls (education, age, and gender) interacted with yearly indicators, as well as year, industry, and regional fixed effects. Note 2: Robust Huber-White standard errors in parenthesis (clustering by industry).