Protein Stability and Dynamics Modulation: The Case of
Human Frataxin
Ernesto A. Roman1,5., Santiago E. Faraj1., Mariana Gallo2
, Andres G. Salvay3,4, Diego U. Ferreiro5, Javier Santos1*
1Instituto de Quı´mica y Fı´sico-Quı´mica Biolo´gicas, Universidad de Buenos Aires, Buenos Aires, Argentina,2Fundacio´n Instituto Leloir and IIBBA-CONICET, Buenos Aires, Argentina,3Instituto de Fı´sica de Lı´quidos y Sistemas Biolo´gicos, Facultad de Ciencias Exactas, Universidad Nacional de La Plata, La Plata, Argentina,4Departamento de Ciencia y Tecnologı´a, Universidad Nacional Quilmes, Bernal, Provincia de Buenos Aires, Argentina,5Protein Physiology Laboratory, Departamento de Quı´mica Biolo´gica-CONICET, Facultad de Ciencias Exactas y Naturales, Universidad de Buenos Aires, Buenos Aires, Argentina
Abstract
Frataxin (FXN) is ana/bprotein that plays an essential role in iron homeostasis. Apparently, the function of human FXN (hFXN) depends on the cooperative formation of crucial interactions between helixa1, helixa2, and the C-terminal region (CTR) of the protein. In this work we quantitatively explore these relationships using a purified recombinant fragment hFXN90–195. This variant shows the hydrodynamic behavior expected for a monomeric globular domain. Circular dichroism, fluorescence, and NMR spectroscopies show that hFXN90–195 presents native-like secondary and tertiary structure. However, chemical and temperature induced denaturation show that CTR truncation significantly destabilizes the overall hFXN fold. Accordingly, limited proteolysis experiments suggest that the native-state dynamics of hFXN90–195 and hFXN90–210 are indeed different, being the former form much more sensitive to the protease at specific sites. The overall folding dynamics of hFXN fold was further explored with structure-based protein folding simulations. These suggest that the native ensemble of hFXN can be decomposed in at least two substates, one with consolidation of the CTR and the other without consolidation of the CTR. Explicit-solvent all atom simulations identify some of the proteolytic target sites as flexible regions of the protein. We propose that the local unfolding of CTR may be a critical step for the global unfolding of hFXN, and that modulation of the CTR interactions may strongly affect hFXN physiological function.
Citation:Roman EA, Faraj SE, Gallo M, Salvay AG, Ferreiro DU, et al. (2012) Protein Stability and Dynamics Modulation: The Case of Human Frataxin. PLoS ONE 7(9): e45743. doi:10.1371/journal.pone.0045743
Editor:Annalisa Pastore, National Institute for Medical Research, Medical Research Council, United Kingdom
ReceivedMarch 23, 2012;AcceptedAugust 24, 2012;PublishedSeptember 25, 2012
Copyright:ß2012 Roman et al. This is an open-access article distributed under the terms of the Creative Commons Attribution License, which permits unrestricted use, distribution, and reproduction in any medium, provided the original author and source are credited.
Funding:This work was supported by the Agencia Nacional de Promocio´n Cientı´fica y Tecnolo´gica (ANPCyT), Consejo Nacional de Investigaciones Cientı´ficas y Te´cnicas (CONICET) and Universidad de Buenos Aires (UBACyT). The funders had no role in study design, data collection and analysis, decision to publish, or preparation of the manuscript.
Competing Interests:The authors have declared that no competing interests exist.
* E-mail: jsantos@qb.ffyb.uba.ar
.These authors contributed equally to this work.
Introduction
Friedreich Ataxia (FRDA) is a hereditary disease that affects children and adolescents characterized by progressive neurological impairment and cardiomyopathy [1,2,3,4]. FRDA is highly associated with a deficiency in the expression of the frataxin protein (FXN) [5,6,7,8]. This protein is expressed in the cytoplasm and imported into the mitochondria [9,10,11,12], where it plays an essential role in iron homeostasis. It is believed that FXN acts as an iron chaperone delivering Fe (II) to enzyme partners during heme and Fe-S cluster biosynthesis [13,14,15,16,17,18,19,20,21]. hFXN is synthesized as a precursor polypeptide of 210 amino acids. This precursor contains an N-terminal transit sequence that directs its transport into the mitochondria matrix where it is cleaved by the mitochondrial processing peptidase to the mature form FXN81–210. [11] This processing involves an intermediate form (hFXN42–210) [22]. In addition, hFXN 56–210 and hFXN78–210 can be generated in vivo when the normal maturation process of FXN is impaired, although the physiological relevance of these forms is unclear [11]. It has been suggested by bioinformatics [23] and shown by nuclear magnetic resonance (NMR) [24,23], that the N-terminal of hFXN, including the first
nine residues of the mature form, has an intrinsically unfolded character. In addition, flexibility of this region is also suggested by the absence of a detectable electron density map for residues 84– 89 in the X-ray structure (PDB = 1EKG) [25]. The protein used in this work corresponds to the evolutionarily conserved C-terminal domain of hFXN (amino acids 90–210, the wild-type variant hFXN90–210) [26]. The average native structure of the human protein (hFXN) has already been resolved by NMR and crystallography (Figure 1) [25,27,28]. FXN is ana/bprotein with a five-stranded, antiparallelbsheet that forms a flat ‘‘platform’’, and two parallelahelices that are tightly packed against it forming anabsandwich.
In about 5% of FRDA point mutations in hFXN gene were reported. Few structural and functional details are known for,15 different missense mutations identified in FRDA patients. How-ever, some of them have been studied in depth showing major differences in their thermodynamic stability (e.g. stability of wild-type . W155R . I154F . D122Y. G130V), propensity to aggregate (mutants I154F and W155R precipitate upon iron binding), and function (mutants D122Y and G130V have a lower binding Fe2+
apparent differences in stabilities, NMR studies have shown that these mutants retain a compact core and native-like dynamics [26]. In addition, three FRDA missense mutations N146K, Q148R, and R165C were also thoroughly studied showing that, in these cases, hFXN is functionally compromised in binding and activation of the SDUF complex (consisting of proteins NFS1, ISD11, ISCU2, and FXN) for Fe2S cluster biosynthesis [28].
Adinolfi et al. proposed that variations on the C-terminal region (CTR) correlate with the conformational stability of different homologues (e.g., yeast,E. coli, human) [30,31]. In addition, they observed that the deletion of the CTR of E. coli FXN yields an overall less stable protein (Tm is 14uC lower than the Tmof the
full-length protein). They also remodeled the C-terminal of the yeast FXN by extending it on the basis of the interactions identified inE. coliand hFXN CTRs. This yielded a yeast FXN variant considerably more stable as judged by thermal
denatur-ation. Inspired in this work, we decided to further investigate the role of human CTR in stability and dynamics of hFXN.
In the hFXN, CTR region encompasses,15 (residues 196 to 210) that, in the native form, pack against helices a1 and a2 occluding the apolar side chains of L198, L200, L203 and Y205 (Figure 1). However, little is known about the contribution of CTR to the conformational stability of the hFXN. Since some FXN homologs do not display the CTR, we speculate that this segment may contribute to the physiological role by altering the detailed protein folding dynamics.
Here, we hypothesize that the stability of hFXN depends on the formation of a cooperative tertiary contacts network based on the modulation of the interaction betweena-helix 1 anda-helix 2 by the CTR, making a sort of conformational ‘‘lock’’. In this work we explored experimentally and computationally the effect of the deletion of the residues 196–210 of the hFXN.
Results
Protein Expression
hFXN90–195 was produced from inclusion bodies, refolded and further purified. When the truncated variant hFXN90–195 is expressed inE coli,most of the protein remains in inclusion bodies (IBs), the insoluble fraction. IBs were prepared and then resuspended in 3.0 M urea. In this condition, hFXN90– 195 is efficiently solubilized. Next, hFXN90–195 was refolded by dialysis against buffer 20 mM Tris-HCl, 100 mM NaCl, pH 7.0, and further purified in native conditions as described in Materials and Methods. This protocol results in.95% purity as ascertained by sodium dodecyl sulfate-polyacrylamide gel electrophoresis (SDS-PAGE), reversed-phase high-performance liquid chroma-tography (RP-HPLC) and electrospray ionization mass spectrom-etry (ESI-MS). In these conditions, the protein remains highly soluble after refolding and purification and it can be concentrated up to 35 mg/mL without noticeable aggregation, suggesting that this fragment may acquire a compact conformation.
hFXN90–195 is monomeric in solution. In order to study the oligomeric state of hFXN variants, analytical ultracentrifuga-tion (AUC) and dynamic light scattering measurements were performed as a function of protein concentration (Figure S1 and Tables 1 and S1). The Stokes radius (RS) obtained by AUC for
hFXN90–210 was of 1.960.1 nm, a value compatible with the RS
predicted from hFXN structure (1.86 nm). In addition, the Rs
demonstrated to be nearly invariant in the range of 0.25 to 1.00 mg/mL. On the other hand, the Rs value obtained for the
hFXN90–195 was 1.860.1 nm, which is also consistent with the value expected for a protein of this size and with a globular shape in solution (1.78 nm). Moreover, both variants showed a frictional ratio of f/fmin = 1.25 (Figure S1). Altogether, these results indicate that both hFXN90–195 and hFXN90–210 behave as compact monomers with a globular hydrodynamic behavior. DLS analysis of variant hFXN90–210 revealed homogeneous samples. The autocorrelation functions are well described by a single-exponen-tial decay that corresponds to a primarily monomodal distribution without polydispersity (%Pd = 14.4), and both intensity and mass corresponding to the peak were 100%. On the other hand, DLS analysis of variant hFXN90–195 revealed some degree of polydispersity (%Pd = 28.7) that can be explained by the presence of a small fraction of molecules (,10%) with an expanded or unfolded conformation (,2.5–3.0 nm) in solution (Figure S2). In addition, the peak corresponded to 97% of the total intensity and 100% of the total mass.
Figure 1. Ribbon representation of the hFXN structure. CTR shown in red interacts with helix-a1 and helix-a2. For a detailed description of these interactions see Table S2.
Spectroscopic Characterization of Fragment hFXN90–195
hFXN90–195 is well-folded and exhibits native-like tertiary structure. To determine the secondary structure content of hFXN90–195, far-UV CD spectra of both variants were acquired and compared (Figure 2A). As judged by the shape and the intensities of the signals, the secondary structure of the C-terminal truncated variant is native-like. In addition, hFXN90– 195 near-UV CD spectrum is compatible with the existence of a substantial chirality as a consequence of asymmetry in the vicinity of aromatic residues, suggesting a native-like tertiary structure (Figure 2B). Furthermore, tryptophan fluorescence spectra of both variants have similar features: maximal wavelength emission compatible with the emissions from an apolar environment (Figure 2C), signature of a structurally conserved and dehydrated protein core.
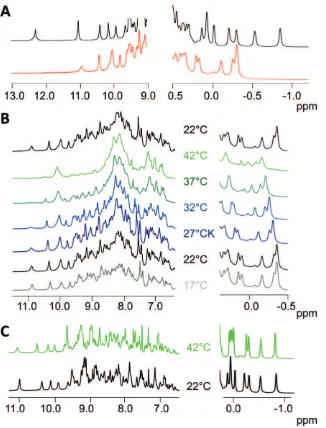
The NMR proton spectrum of the full length hFXN shows a high-quality peak dispersion (Figure 3A), evidence of the globular and stable native conformation of the wild-type protein [27]. On the other hand, the proton spectrum of hFXN90–195 shows high field methyl signals at negative chemical shifts (20.20,20.35 and
20.40 ppm) and a good signal dispersion in the amide region of the spectrum, exhibiting several signals at chemical shifts larger than 9.0 ppm (Figure 3A). This indicates that the fragment behaves as a well-folded protein. However, there are substantial differences between the spectra of both proteins. The full-length hFXN exhibits an NMR spectrum of higher quality, displaying, for example, methyl signals at20.5 and21.0 ppm and a low field signal at 12.3 ppm. These signals are not present in the shorter construct. This suggests that hFXN90–195 would explore less compact conformations when compared to the full-length hFXN in the same timescales. In addition, the presence of overlapped peaks with a lower spreading of chemical shifts in the 1H-15N HSQC spectra of variant hFXN90–195 is compatible with the coexistence of a small fraction of protein in an unfolded conformation (data not shown).
A substantial reduction in the intensities of the methyl and low field signals in the proton NMR spectrum of hFXN90–195 was observed as the temperature increased from 17 to 42uC. Simultaneously, signals between 7.8 and 8.4 ppm became more intense and an inhomogeneous line width is noticeable in the spectra at higher temperatures (Figure 3B). These changes suggest partial unfolding of the protein when the temperature increases. The process was fully reversible (Figure 3B, upper spectrum), and is further confirmed by thermal unfolding followed by CD (see below). In contrast, hFXN90–210 at 42uC exhibited only minor changes in the NMR proton spectrum in relation to 22uC (Figure 3C), consistent with the higher thermal stability of the full-length protein.
Reversible Unfolding and Protein Stability
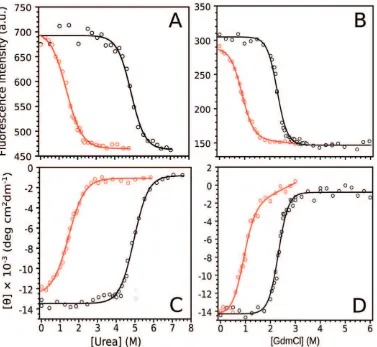
The truncation of the CTR destabilizes the hFXN. Interestingly, hFXN90–195 acquires a native-like fold after refoldingin vitro. However, residues involved in interactions with CTR form an apolar network that may be a key component of hFXN core. To investigate the effect of protein truncation on the thermodynamic stability of hFXN, we performed equilibrium unfolding experiments followed by far-UV CD and tryptophan fluorescence intensity as probes of secondary and tertiary structures, respectively (Figure 4).Dialysis of chemically unfolded
hFXN90–210 and hFXN90–195 showed .95% reversibility. (Figure S3). The equilibrium unfolding curves are well described by a two-state model. Variant hFXN90–195 is significantly destabilized in comparison to variant hFXN90–210, as shown by the differences in ?G#NU H2Obetween these proteins (Table 2).
Temperature unfolding was also studied. First, the process was followed by monitoring changes in the fluorescence signal of SYPRO orange dye as it interacts with a protein undergoing thermal unfolding [32,33,34]. The Tmobtained for hFXN90–195
was 28–30uC whereas for the wild-type protein, the value measured was 64uC (Figure 5A). The lower Tm value observed
for the truncated variant is compatible with the lower stability measured by chemical unfolding. On the other hand, no dependence of Tm values on protein concentration was observed in the range of 0.16, 0.33 and 0.5 mg/mL (data not shown). It is important to observe that unfolding curves followed by SYPRO orange fluorescence were performed at low ionic strength (see below).
In addition, the presence of dye binding to the truncated form even at low temperatures would indicate (a) that hFXN90–195 exhibits hydrophobic surfaces, when compared to variant hFXN90–210; (b) a heterogeneous native state ensemble where conformations fluctuate between states exposing binding sites; or (c) the existence of a small fraction of unfolded molecules at low temperatures, when no chaotropic agents are added. The latter is compatible with the lower thermodynamic stability of hFXN90– 195 variant and is also in agreement with DLS and NMR experiments mentioned above.
To characterize in detail the temperature unfolding process we performed thermal unfolding experiments followed by far-UV CD (Figure 5B, C and D and Table 3). In agreement with the fluorescence experiments, the variant hFXN90–195 shows the transition at significantly lower Tm(Tmvalues are 40.4 and 70.5uC
[image:3.612.62.556.77.176.2]for truncated and full-length hFXN, respectively, Figure 5C and Table 3). In both cases, the unfolding process is reversible as judged by the recovery of the spectroscopic signals upon cooling protein solutions to the starting temperature, 4uC (refolding yields are 96 and 99% for the truncated and full-length variants, Table 1.Hydrodynamic Radii of hFXN Variants hFXN90–210 and hFXN90–195.
Hydrodynamic Radii
Method hFXN90–210 (nm) hFXN90–195 (nm)
Dynamic Light Scattering (experimental) 1.8960.05 1.8260.03
Analytical Ultracentrifugation (experimental) 1.9060.1 1.8060.1
Prediction using the Molecular Massa 1.86 1.78
Hydropro (theoretical)b 1.98 –
aAssuming a globular shape, the RSof the native state of a given protein may be calculated using the equation log (RS) = -(0.254
60.002)+(0.36960.001)6log (MW), where MW is the molecular weight expressed in Da and the hydrodynamic radius is in A˚ according to reference [60].
bCalculated using Hydropro Software according to reference [67]. doi:10.1371/journal.pone.0045743.t001
respectively, Figure S4A). When proteins were cooled at a lower rate (with data acquisition) 87 and 91% of refolding was observed in the case of hFXN90–195 and hFXN 90–210, respectively (Figure 5B), indicating that, in this case, an aggregation process may compete with refolding. Similar results (95% of refolding at pH 7.0) were observed for hFXN90–210 by Correia and coworkers [29]. In addition, neither a significant variation in the apparent Tmin consecutive ramps (Inset in Figure 5C and Figure
S4A) nor a dependence of Tmvalue with the heating rate in the
range assayed was observed (Figure S4B).
The dependence of the stability on the NaCl concentration was explored for both variants (Figure 5B and D). The Tm values determined by CD were 36.2, 43.3 and 45.4 (0.0, 250 and 500 mM NaCl, respectively) in the case of the truncated form. On the other hand, values for hFXN90–210 were 66.6, 71.6 and 73.5uC (0.0, 250 and 500 mM NaCl, respectively), suggesting the existence of similar electrostatics contributions in both proteins. We think that the salt effect on the stability of both hFXN variants is a consequence of the shielding of negative charges of Glu and Asp amino acid residues located in the N-terminal (helixa1 and strandb1). This is reinforced by the stabilizing effect produced by mutation of acidic side-chains, observed and documented in detail by Gomes et al [35]. In this case, the mutant D86A/E90A/E93A/ D101A/E103A of yeast FXN is stabilized in 2.6 kcal compared to wild-type protein. The thermodynamic stability of hFXN90–210 and hFN90–195 proteins does not depend on pH in the range from pH6.0 to pH8.0 (data not shown) [29]. A similar behavior was also observed in the cases ofE. coli and yeast FXN variants [30].
We suggest that the lower Tm values observed in unfolding
experiments of hFXN variants using the SYPRO orange probe, in comparison with the values obtained by CD (DTm are,6 and 2.4uC, for hFXN90–195 and hFXN90–210, respectively) might be due to an extra destabilization caused by the binding of the dye to the unfolded state of these proteins. In addition, the slight variation in sodium phosphate concentration (10 mM instead of 20 mM) may contribute to this difference.
The results presented in this section confirm that the truncated version, despite being globular and rather compact, displays a decreased thermodynamic stability in comparison with the wild-type hFXN.
Interestingly, in the case of hFXN90–195 a considerable difference in the apparent folding free energy is observed between thermal and chemical unfolding (1.160.1 and 1.960.2 kcal -mol21
, respectively). We cannot rule out that the nature of the temperature-unfolded state would be slightly different in compar-ison to the chemical-induced unfolded state. The ?CPvalue for this
variant (1.060.1 kcal mol21
K21
) is only 58% of the expected value (1.7 kcal mol21K21), whereas urea-induced unfolding is
well adjusted with a value of mNU, the slope of the linear
dependence of free energy of unfolding (?GNUu) on denaturant
concentration, compatible with the ?ASANU where U is
completely unfolded. Thus, this difference might be a consequence of a higher degree of compaction in the case of the temperature-induced unfolded state of hFXN90–195 (particularly at low temperatures, Tm = 40uC).
As mentioned above, the existence of a small fraction of molecules in unfolded conformations (,10%) in equilibrium with the native state is inferred from the extremely low thermodynamic stability of variant hFXN90–915, in the absence of chaotropic agents when incubated at 20–25uC.
To evaluate this, far-UV CD spectra of both variants were also acquired in the presence of 200 mM Na2SO4, an osmolyte that
[image:4.612.60.295.53.676.2]modifies the relative stabilities of N and U state, leading to an
increase in global stability and compactness [36]. In this experimental condition, we observed a slight increment in the CD signals in the far-UV region for variant hFXN90–195, compatible with the acquisition or stabilization of secondary structure (the relative increment was 11.262.1%, Figure S5). On the other hand, in the case of hFXN90–210 the relative increment was significantly lower (4.061.6%).
Dynamics and Flexibility of hFXN
hFXN90–195 is more flexible than hFXN90–210. It is well known that proteases require exposure of a specific site and significant backbone flexibility to exert their function. To study the effect of the CTR truncation on the flexibility of hFXN, we performed a limited proteolysis experiment followed by RP-HPLC and RP-HPLC-MS to identify protease-accessible sites.
Chymo-trypsin protease was selected because 14 aromatic amino acid residues are located along the polypeptide chain (Figure S6) and their distribution enabled us to investigate the dynamics of the backbone at different sites.
[image:5.612.59.385.57.485.2]According to previous reports, hFXN90–210 shows marked protease resistance. [26,29] After long incubation times with protease (4 h), we detected only one cutting site. This site is located in CTR (residue Y205). More probably, this shows that the flexibility of the region is higher in comparison to the stiffness of the rest of the protein. The truncation of the CTR in the hFXN90–195 variant determines a significant alteration of this behavior. At very short incubation times (between 20 sec to 5 min) and 200:1 (protein to protease mass ratio, at 25uC), no less than six backbone cuts occurred (Y118, Y143, W155, Y166, and W173
Figure 3. NMR characterization of the truncated variant.(A) Selected regions of the1H NMR spectra of hFXN90–210 (red) and hFXN90–195 (black). NMR spectra were performed at 22uC and the rest of the spectroscopic data was acquired at 20uC. All protein solutions were prepared in buffer containing 20 mM Tris?HCl, 100 mM NaCl, 1 mM EDTA, pH 7.0.1H NMR spectra of hFXN90–195 at different temperatures from 17 to 42uC are shown (B). The protein loses chemical shift dispersion and exhibits a broadening of signals as the temperature increases. The process is reversible, recovering the 22uC spectrum after having heated the sample to 42uC. (C) 1H NMR spectra of hFXN90–210 at 22 and 42uC. Both spectra are characteristic of a well-folded globular protein.
doi:10.1371/journal.pone.0045743.g003
Figure 4. Isothermal equilibrium unfolding experiments followed by tryptophan fluorescence (A and B) and far-UV CD (C and D).
Unfolding was induced by urea (A, C) or GdmCl (B, D). Protein variants were incubated with denaturant for 16 h. GdmCl and urea stock solution concentration (8.0 M and 10.0 M) was determined using a standard refractometer. The measurements were carried out at 20uC in 20 mM Tris?HCl, 100 mM NaCl, 1 mM EDTA, pH 7.0. The solid lines represent the nonlinear regression fitting (two-state model, see Materials and Methods). doi:10.1371/journal.pone.0045743.g004
Table 2.GdmCl- and Urea-induced Unfolding Parameters for the hFXN Variants.
Two-state Model (N«U) GdmCl
hFXN Fluorescence Circular Dichroism
DG6NU mNU CmNU S0N FL S0U FL DG6UN mNU CmNU S0N S0U
90–210 6.760.2 2.9 2.360.1 30461 14761 6.760.2 2.9 2.360.1 214.360.2 20.860.5
90–195 2.260.1 2.5 0.860.1 28862 16163 2.060.2 2.5 0.860.2 214.060.2 24.160.8
Two-state Model (N«U) Urea
hFXN Fluorescence Circular Dichroism
DG6NU mNU CmNU S0N FL S0U FL DG6UN mNU CmNU S0N S0U
90–210 7.160.1 1.45 4.960.1 69364 46165 7.260.2 1.45 5.060. 213.560.2 20.860.2
90–195 1.760.1 1.25 1.260.1 70766 46363 1.860.1 1.25 1.460.1 212.860.2 21.060.1
Parameter mNUis the slope of the linear dependency of free energy of unfolding (DGNUu) on denaturant concentration andDGuNU H2OisDGuNUat zero denaturant concentration. In the fittings, we used the predicted mNUvalues for GdmCl- and urea-induced unfolding considering a globular protein of a given molecular weigtht, 2.9 and 1.45 kcal mol21M21for hFXN90–210 and 2.5 and 1.25 kcal mol21M21for hFXN90–195 [68]. The units of m
NUare kcal mol21M21. Cmand free energy are M and kcal mol21, respectively. CD signals are in [H]
61 1023(deg cm2dmol21), and fluorescence intensity signals are arbitry units. The parameters were calculated by nonlinear least square fit of the data shown in Figure 4 as described in Materials and Methods.
[image:6.612.61.556.501.678.2]and Y175), as judged by ESI and MALDI mass spectrometry analysis (Figure 6, S6).
Regarding the proteolytic sites observed at short incubation times with protease, sites W155 (located in strandb4) and Y175 (situated in the connector loop between strandb6 and helixa2) are sites partially exposed to the solvent (using PDBID: 1EKG and MOL-MOL software [37]). On the other hand, residues Y143,
located inb3 under helixa2 and the CTR, Y166, in strandb5, and W173 situated in strand b6. Therefore, we speculate that these cuts could take place after major conformational changes, including global or local unfolding events.
In particular, residue Y118 is located in loop 1 (connecting helix
[image:7.612.61.437.59.403.2]a1 and strandb1, 18% of solvent accessibility). Interestingly, the analysis of the X-ray structure of hFXN90–210 with COREX/
Figure 5. Thermal unfolding of variants hFXN90–210 and hFXN90–195.Unfolding was followed by (A) Sypro-orange fluorescence in 10 mM sodium phosphate, pH 7.0, and by far-UV CD spectroscopy (B, C, and D). For both variants hFXN90–210 and hFXN90–195 (B and D, respectively) unfolding experiments were also conducted in the presence of different salt concentrations (0, 250 and 500 mM NaCl). In (C), the measurements were carried out in 20 mM sodium phosphate, 100 mM NaCl, 0.1 mM EDTA, at pH 7.0. Heating from 4 to 90uC and cooling from 90 to 4uC are shown in filled and open symbols, respectively. The inset in (B) shows for both proteins the dependence of the free energy of unfolding with the temperature for the buffer condition 20 mM sodium phosphate, 100 mM NaCl, 0.1 mM EDTA, pH 7.0. The curves in dotted lines are plotted taking into account the two extremes of the standard deviation of the ?HNUparameter. The inset in (C) shows the CD signals at 220 nm normalized between 0 and 1 to
facilitate the comparison between Tm values obtained in unfolding and refolding and reversibility. doi:10.1371/journal.pone.0045743.g005
Table 3.Temperature-induced Unfolding Parameters for the hFXN Variants.
Two-state Model (N«U) Temperature
hFXN
DHNU (kcal mol21)
TM (6C)
DCP NU
(kcal mol21K21) (kcal molDGNU 20 C21) D(kcal molGNU MAX21)
TDGNU MAX (6C)
90–210 9262 70.560.2 1.9 6.160.3 6.260.3 25
90–195 2862 40.460.6 1.060.1 1.160.1 1.260.1 12
The predictedDCP NUvalues asuming the complete unfolding of the molecules are 1.9 and 1.7 kcal mol21K21for hFXN90–210 and for hFXN90–195, respectively. [68] The parameters were calculated by nonlinear least square fit of the data shown in Figure 5B as described in Materials and Methods, using equations 1 and 2.DGNU 20 Cis the free energy of unfolding at 20uC andDGNU MAXis the highest value of free energy.
doi:10.1371/journal.pone.0045743.t003
[image:7.612.63.556.614.695.2]BEST algorithm [38,39] points to loop 1 (residues D115 to Y123) as the region with the highest probability of undergoing local unfolding (Figure S7). Likewise, the Protein Frustratometer algorithm [40] points out that the CTR forms a network of minimally frustrated interactions witha1 anda2 (Figure S8).
Despite the similarities observed in secondary and tertiary structure and hydrodynamic behavior, the results of proteolysis experiments might be explained by a difference in flexibility between full-length and the truncated variants.
To characterize the effect of the CTR truncation on hFXN dynamics, we performed molecular dynamics simulations (MDS). We explored fast conformational dynamics with explicit solvent in classical all atom simulations using empirical force fields. The starting model for hFXN90–210 was PDB ID = 1EKG, and we modeled hFXN90–195 truncating the CTR of the protein. Each variant was subjected to a 100 ns run. An initial inspection shows that both proteins remain native-like, so that truncation does not produce large conformational alterations in this timescale. In this way, RMSD and Rg values corresponding to the ensemble of conformations of the truncated variant are compatible with those observed for wild-type hFXN, and the general topology of the protein remains somehow stable during the simulation time (Figure 7 A and B). However, when hFXN90–195 fluctuations are cautiously examined, the region involving loop 1 (D115 to Y123) is detected as one of the regions with the highest RMSF (Figure 7 C and D). The difference between RMSF values in this region is observed in different time intervals along the simulation (data not shown). This result, together with chymotrypsin experiments, reinforces the idea of an enhanced flexibility in variant hFXN90– 195.
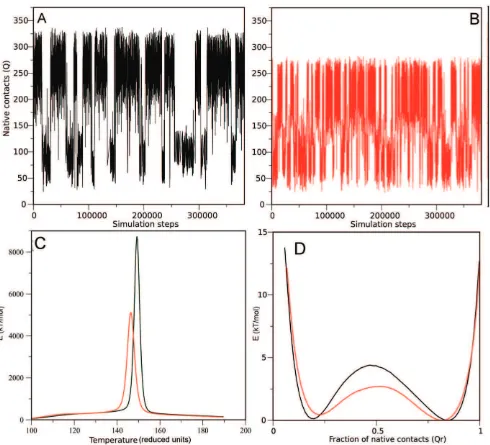
[image:8.612.60.296.56.739.2]Structure-based model simulations show that hFXN visits two native-like isoenergetic conformations and that deletion of residues 196–210 affects folding kinetics. In order to dissect the contribution of simple topological constraints in the folding dynamics of the hFXN 90–210 and fragment hFXN90–195, we analyzed the folding behavior of these proteins on perfectly funneled energy landscapes [41]. We performed simulations with structure-based models, in which all the sequence information is removed and the average native structure is the sole input [41]. We derived the potential from the PDBID = 1EKG as described in methods, and performed several MD runs to explore the phase-space. Typical trajectories are shown in Figure 8A and B. Qualitatively, both the hFXN90–210 and hFXN90–195 spend most of the time in either folded (high Q) or unfolded (low Q) ensembles, with no obvious stable intermediate state. Notably, transitions of the shorter protein occur much more frequently (Figure 8B), than the larger one (Figure 8A). To quantify the topological effect of deleting the CTR, we used weighted histogram analysis method WHAM [42,43] to extract the mean thermodynamic parameters. Both proteins show a single peak in the heat capacity as a function of temperature (Figure 8A). hFXN90–210 displays a sharper peak at a slightly higher temperature, showing that the deletion of the CTR not only destabilizes the native fold but also affects the cooperativity of the main folding transition.
Figure 6. Controlled proteolysis of hFXN90–195.Experiments were followed by RP-HPLC. Chromatograms corresponding to hFXN90– 210 and hFXN90–195 are shown in black and red, respectively. Protein concentration was 1.0 mg/mL and chymotrypsin was 1:200, protease to protein, mass ratio. The reaction was performed at 20uC in buffer 20 mM Tris-HCl, 100 mM NaCl, 0.1 mM EDTA, pH 7.0. The chromato-gram corresponding to the solvent plus PMSF is in green.
The free energy profiles of the proteins at their respective Tm
show two minima, which we ascribe to the folded (high Q) and unfolded (low Q) structural ensembles (Figure 8D). A smooth free energy barrier at Q,0.5 separates these states, suggesting that both proteins fold via a two-state like mechanism. Notably, the barrier height differs in about 2.3 kT/mol (,50%), showing that the deletion of CTR strongly affects the overall folding kinetics of the hFXN fold, as was apparent in the raw traces (Figures 8A and 8B). The native ensemble for hFXN90–210 is broad, forming between 200 and 300 contacts at Tm, with a global RMSD of
,0.3 nm. When the thermodynamics of the contacts of the CTR
region is evaluated, it is apparent these undergo a concerted change in the interaction with the hFXN core, being either formed or not formed (Figure S9). This transition peaks at a lower temperature than the core transition (Figure S9C), thus, at the Tm
[image:9.612.58.552.57.547.2]of the hFXN90–210, the CTR is stabilized to unbound conformations (Figure S9A). This suggests that the native ensemble of hFXN populates at least to distinguishable substates, N1 and N2 (Figure 9). In N2 the main core of FXN is folded, but most of the tertiary interactions involving the CTR are not formed, consolidating only in N1 substate. In these free-energy representations it appears that N2 is an obligatory intermediate
Figure 7. Explicit-solvent all atom simulation of full-length (black lines) and truncated hFXN (red lines).(A) Root Mean Square Deviations (RMSD) and (B) Radius of gyration (Rg) were computed along the 100 ns of simulation. (C) The RMSF values per residue were computed from the equilibrated part of the trajectory, which was from 3 ns of simulation. (D) hFXN90–195 colored by the degree of flexibility of the backbone. Blue and green represents the least and most flexible regions of the backbone, respectively.
doi:10.1371/journal.pone.0045743.g007
connecting N1 and U, suggesting that unfolding of hFXN starts with unbinding of the CTR (Figure 9). Concomitantly, hFXN would fold vianucleating at the core and not at the CTR. To directly quantify this we computed the probability of individual contact formation for the transition state ensemble (TSE) separating U and N1. We observe that the TSE has the overall topology of the hFXN fold (Figure S10). Thus the CTR region appears to stabilize the native ensemble by acting as a ‘lock’ to the core region. On the other hand, CTR affects the folding kinetics of the core, even when not directly participating in the TSE. Preliminary experiments show that unfolding kinetics of hFXN90– 195 is indeed substantially faster than the full-length protein (Figure S11). In this context, we suggest that CTR may act
producing a slowdown in folding reaction, probably by called ‘‘backtracking’’ [44,45,46].
Discussion
[image:10.612.63.553.57.502.2]A glance at the structure of hFXN points to the C-terminal region (CTR) as a distinctive part of the protein in terms of the FXN conformation. The CTR does not form a typical secondary structure element (neither ana-helix nor ab-strand), nevertheless, it establishes a large number of long-range interactions with both N- and C-terminala-helices (Figure S8). It appears that this part of the protein is not crucial for the acquisition of FXN fold as yeast FXN does not have CTR, andE. coli FXN has a shorter one compared to the hFXN. It was previously reported that, the
Figure 8. Structure-based model simulations of hFXN90–210 (A) and hFXN90–195 (B).Number of native contacts formed (Q) as a function of the number of steps of the simulations. The observed transitions represent the folded to unfolded state conformational change. (C) Calorific capacity at constant volume for both variants. The peak represents the folding/unfolding transition. (D) Energy profile for both variants as a function of the relative native contacts at the melting temperature of each variant (1 represents all the native contacts formed, while 0 represents none of the contacts formed). The minima represents the folded (Q,0.8) and unfolded (Q,0.2) states, while the energy barrier (Q,0.5) represents the transition
barrier for this reaction.
Figure 9. Contour plot of the contacts between CTR and the rest of the protein.The color represents the log of the probability of the intersection event. The black line represents a representative fraction of the trajectory. In addition, the superimposition of hFXN conformations corresponding to clusters N1, N2 and U populated during the folding dynamics are shown. Residues 90–195 and 195–210 are shown in grey and red, respectively.
doi:10.1371/journal.pone.0045743.g009
stability of yeast FXN (yFXN) is largely diminished in comparison to the hFXN variant. The Tm andDGuNU H20values are 40uC
and 1.5 kcal/mol for yFXN and 70.5uC and 6–7 kcal/mol for hFXN, indicating that the CTR would be related to the stability of FXN fold [30,31]. Interestingly, the engineering of a CTR increases the thermodynamic stability to the yFXN variant [30]. Nevertheless, it was not possible to determine if these differences in thermodynamic stability were originated from the absence of CTR or due to other existing sequence dissimilarities.
Previous attempts to express a shorter version of hFXN were not successful. When a variant, which lacks most of the CTR (hFXN91–198), was expressed inE. coli, it was persistently found in inclusion bodies [30].
Here, by tuning the sequence deletion to hFXN90–195, we successfully obtained enough recombinant protein to perform experiments and derive biophysical parameters to characterize the protein.
Classical spectroscopic signatures show that the conformation of hFXN90–195 is native-like (Figure 2). However, wild-type hFXN displays both higher chemical shift dispersion (Figure 3) and enhanced near-UV CD bands (Figure 2) when compared to the truncated variant, a result compatible with a loss of tertiary packing. On the other hand, the CTR deletion strongly destabilizes the overall fold, as seen when followed by both temperature (Tm values are 40.4 and 70.5uC for hFXN90–195
and hFXN 90–210, respectively) and chemical denaturation (DGuNUvalues are,1–2 and,6–7 for hFXN90–195 and hFXN 90–210). Interestingly, the difference between the fitted DCP NU
values, obtained from temperature denaturations indicates that, in the absence of chaotropic agents (like urea or GdmCl), hFXN90– 195 may unfold with a smaller solvent accessible surface area difference (DSASANU) than hFXN90–210. Similar results were
previously described for the NCA mutant of staphylococcal nuclease protein [47]. The experimental determination of DCP
values by DSC will help in the future with this.
Topology is known to be a main determining factor of folding transitions [48]. To prove whether the folding behavior observed for the CTR deletion can be attributed to topological effects, we performed folding simulations of perfectly funneled energy landscapes [41]. We observed that the truncated variant is less stable displays a broader temperature transition than the hFXN90–210 counterpart (Figure 8C), qualitatively matching the experimental observations discussed above. Moreover, we identified that CTR residues interact with the 90–195 core in a concerted way, behaving as a folding element that ‘‘snaps’’ onto the rest of the protein (Figure 9). The broad native ensemble of hFXN can be decomposed into substates that either include or do not include CTR consolidation (Figure 9). Unbinding of the CTR promotes unfolding of the rest of the protein, which folds by nucleating at the 90–195 region (Figures S9 and S10). Even when not participating in the main transition state ensemble (TSE), CTR is predicted to slow down the transitions (Figure 8). Preliminary experiments suggest that unfolding kinetics of hFXN90–195 is indeed substantially faster than the full-length protein (Figure S11). Thus, the main differences in the folding dynamics of the hFXN variants can be attributed to topological effects of the long-range interactions of the CTR, that stabilizes both thermodynamically and kinetically the 90–195 region.
All-atom explicit solvent simulations reveal that a more flexible backbone would be one of the main differences between the variants as analyzed in the fast timescale regime. This occurs at specific sites along the polypeptide region including the connector loop 1 (D115 to Y123). In agreement with this, COREX/BEST [38,39] results show that this region has the highest probability of
local unfolding. In accordance, the ‘‘Protein Frustratometer’’ suggests this region is enriched in highly conflicting interactions (Figure S8) [40]. Proteolysis is a very attractive tool to map high-energy conformations [49,50] While the hFXN90–210 variant is resistant, in the truncated variant six chymotrypsin cleavage sites are detected in the first 5 min of the proteolysis reaction. Both transient local unfolding and/or the presence of unfolded molecules in solution, as a consequence of the low thermodynamic stability of hFXN90–195, may contribute to this behavior.
We also considered the possibility that changes in the dynamics of CTR may alter the dynamics of the hFXN b-sheet. In this regard, W155 is one of the six porteolytic sites that we observed after short incubation with chymotrypsin, in the case of the truncated form. Thus, we speculate that changes in theb-sheet dynamics could produce a substantial modification of hFXN molecular surface. Consequentially, alterations of the CTR would alter the binding and activation of the SDUF protein complex involved in iron metabolism and Fe2S cluster biosynthesis [28], tuning its biological function.
Although variant hFXN90–210 is markedly resistant to protease, a peptide involving the last six residues of the CTR is removed by chymotrypsin, suggesting that part of the CTR of hFXN is indeed quite mobile, in contrast to the hFXN core, which is in agreement with NMR results (Figure 3) and the structure-based simulations (Figure 9). This is reflected by the incremented internal motions at the C-terminus on the ns- and ps timescale [26], and by the larger RMSD of the solution bundle observed in the NMR structure (PDBID = 1LY7). [27] NMR experiments are underway to further explore the effect of specific point mutations and truncation of the CTR on backbone dynamics.
Two point mutations located in the CTR have been found in FRDA patients: S202C and L198R [51]. The latter, introduces a positive charge in the apolar interaction surface between the CTR and residues from both helicesa1 anda2. We suggest that these mutations could produce changes in the dynamics of the CTR, probably influencing the stability and/or dynamics of the FXN core, as it happens in the case of variant hFXN90–195 due to the absence of the CTR. In this fashion, FOLD-X algorithm [52,53] predicts that L198, L200 and L203 form strongly stabilizing interactions (Figure S7).
Here we propose that the local unfolding of CTR may be the initializing step for the global rearranging of hFXN. The CTR seems to play a relevant role in the kinetic stabilization of hFXN fold acting as a conformational ‘‘lock’’ (Figures 8, 9, S9 and S10). In this model, the magnitude of the barrier from native to the unfolded state may be largely perturbed by point mutations like L198R. The functional deficiency of hFXN L198R mutant could be explained by destabilization of the CTR-a-helical interactions. In this regard, hFXN90–195 shows deficiency in protein-iron interaction, producing insoluble particles in the presence of iron (Figure S12). A similar behavior was observed for mutants I154F and W155R that precipitate upon iron interaction [26].
[52,56] predicts the mutation L182F would reduce the propensity of the a-helical element from 13% to 6%. In addition, tertiary packing effects should be taken into account as a consequence of the presence of a more bulky side-chain.
Conclusion
The CTR is a crucial element in the stabilization of hFXN. Moreover, the presence of this stretch of residues enables this macromolecule to smoothly modulate its stability and dynamics. These motions may play a clue role in the protein function given that the existence of point mutations in this region leads to Friedrich’s Ataxia syndrome.
Materials and Methods
Protein Expression and Purification
Human frataxin cDNA was kindly provided by Dr. He`le´ne Puccio from IGBMC (Strasbourg, France). Primer sets Fw210:
tttaagaaggagatatacatatgctagatgagaccacctatgaa Rev210:
gcatg-gatcctcaagcatcttttccggaataggc and Fw195:
tttaagaaggagatataca-tatgcta gatgagaccacctatgaa, Rev195:
gcatggatcctcattttaaggctttagt-gagctct where used to amplify the ORFs corresponding to the variants hFXN90–210 and hFXN90–195 respectively. The PCR products were sub–cloned into a pET9b plasmid vector, and the identity of the inserts was confirmed by DNA sequencing.
Bacteria cultures (E. coli BL21 (DE3), 2–3 L Terrific Broth, pH 7.2) were grown at 37uC and 280 rpm. Protein expression was induced at DO = 1.0 by addition of 1.0 mM IPTG. After induction for 3.5 hours, bacteria were centrifuged at 6,000 rpm and the pellet was stored at –20uC until cell disruption with French press. Soluble and insoluble fractions were separated by centrifu-gation at 10,000 rpm (30 min).
For the purification of hFXN90–210, the soluble fraction was incubated with 10 mM EDTA and carefully loaded onto an ion exchange chromatography (DEAE DE52 matrix), and eluted with a 300 mL linear gradient, from 0.0 to 1.0 M NaCl, in buffer 20 mM Tris?HCl, 1 mM EDTA, pH 7.0. Subsequently, fractions (identified by SDS-PAGE) with FXN were loaded onto prepar-ative Sephadex G–100 column (SEC, 93 cm62.7 cm), previously equilibrated with buffer 20 mM Tris?HCl, 100 mM NaCl, 1 mM EDTA, pH 7.0. This yields.95% pure hFXN as confirmed by mass spectrometry (ESI-MS) (theoretical molecular mass value: 13,605.1 Da, considering the N-terminal methionine residue); hFXN90–210 concentration was determined spectroscopically using an extinction coefficient e280nm= 26,930 M–1cm–1(1 mg/
mL protein solution represents Abs280nm= 2.00).
The truncated variant hFXN90–195 was expressed according to the same protocol, but purified from the insoluble fraction of the lysate. It was solubilized at room temperature from the inclusion bodies (IB) by incubating with 3.0 M urea. Interestingly, this treatment leads to the solubilization of the recombinant protein, whereas other proteins were solubilized only after incubation with 6.0 M urea. Next, a refolding step was performed by dialysis of the fraction against 20 mM Tris?HCl, 100 mM NaCl, 1.0 mM EDTA, pH 7.0. Finally, protein purification was performed, in identical conditions to the procedure previously described for hFXN90–210. Mass was corroborated by ESI-MS (theoretical molecular mass value: 11,923.2 Da); the extinction coefficient used for this variant wase280nm= 25,440 M–1cm–1(1 mg/mL protein
solution represents Abs280nm= 2.13).
Fluorescence Measurements
Steady–state fluorescence measurements were performed in a Jasco FP–6500 spectrofluorometer operating in the ratio mode
and equipped with a thermostated cell holder set at 20uC. To this end, a 1.0 cm path length cell sealed with a Teflon cap was used. When the intrinsic fluorescence of proteins was measured, excitation wavelength was 295 nm and emission data were collected in the range of 305–450 nm. The spectral slit–width was set to 3 nm for both monochromators.
Circular Dichroism Spectroscopy
Ellipticity of protein samples was evaluated using a Jasco 810 spectropolarimeter calibrated with (+) 10-camphorsulphonic acid. Far–UV CD spectra were recorded in the range between 185 and 250 nm, protein concentration was 10mM, and a cell of 0.1 cm path length was used. For near–UV CD spectra, the wavelength range was 240–340 nm, protein concentration was 20mM, and the path length was 1.0 cm. In all cases, data was acquired at a scan speed of 20 nm min21and at least 3 scans were averaged for
each sample. Blank scans were subtracted from the spectra and values of ellipticity were expressed in units of deg cm2 dmol–1,
unless expressed otherwise in the text.
NMR Spectroscopy
Samples for NMR experiments contained 0.5 mM hFXN90– 195 or 0.8 mM hFXN90–210, 20 mM Tris?HCl pH 7.0, 100 mM NaCl, 1 mM EDTA, in a solution of 90% H2O/10%
D2O. The NMR experiments were performed from 290 to 315 K
on a Bruker 600 MHz Avance III spectrometer equipped with a 5 mm triple resonance cryoprobe incorporating shielded z-axis gradient coils. The NMR data were processed and analyzed using Tospsin 3.0 software.
Limited Proteolysis
hFXN variants (1 mg/mL) were incubated with chymotrypsin at mass ratios 1:50, 1:100, 1:150 and 1:200 (protease: protein), at different temperatures (4, 25 and 55uC) in buffer 20 mM Tris?HCl 100 mM NaCl, 1 mM EDTA, pH 7.0. Aliquots were separated at different times (0, 5, 10, 15, 30, 45 min, and 1, 1.5, 2, 3, 5, 20 h) and the reaction was immediately stopped by addition of 0.2% TFA and 1.0 mM PMSF. Samples were kept at 220uC until analysis by SDS–PAGE and RP–HPLC followed by MALDI or by ESI–MS.
Protein Unfolding Experiments
Isothermal unfolding experiments were carried out incubating the hFXN variants with the appropriate concentration of the chaotropic agent in buffer solution (20 mM Tris?HCl 100 mM NaCl, 1 mM EDTA, pH 7.0) for 16 h at room temperature. All measurements were done at 20uC. The process was followed by far-UV CD recording and tryptophan fluorescence measurement. In order to calculate thermodynamic parameters, a two–state unfolding mechanism was assumed, where only native (N) and unfolded (U) conformations exist at equilibrium. Data processing was performed according to Santoro and Bolen [57,58,59]. Denaturant concentrations were determined using a standard refractometer.
Thermal unfolding was monitored by changes in the fluores-cence signal of SYPRO orange dye by heating the holder from 0 to 95uC at a rate of 1uC min21
unquenched when binding the apolar core of the protein upon unfolding.
In addition, unfolding transitions as a function of temperature were monitored by the CD signal at 220 nm. Experiments were carried out in 20 mM sodium phosphate, 100 mM NaCl at pH 7.0. The protein concentration was 7.0mM, and a 1.0 cm cell
path length was used. Temperature was varied from 0 to 95uC, at a rate of 1uC min21
, and the melting curve was sampled at 1.0uC intervals. To extract the thermodynamic parameters the following model was fitted to the data:
DGNU~RTln fU fN
~DHTmz
DCP(T{Tm){T
DHTm Tm
zDCPln T Tm
ð1Þ
S~fNðS0,NzlNTÞzfUðS0,UzlUTÞ ð2Þ
where fU and fN are the unfolded and folded fractions at
equilibrium, respectively;Tmis the temperature at whichfU=fN;
S is the observed CD signal; S0,Nand S0,U are the intrinsic CD
signals for the native and unfolded states, respectively; lNand lU
are the slopes of the pre- and post- transition regions, respectively, assuming a linear dependence ofSNandSUwith temperature.
The reversibility of the chemical unfolding reactions for both hFXN variants was verified by dialysis. Proteins were incubated for three hours with urea or GdmCl at different concentrations (at room temperature) to ensure equilibrium conditions and to minimize chemical modifications (in particular, in the case of urea solutions long incubations were avoided). Next, proteins were extensively dialyzed (overnight at 4uC) against buffer 20 mM Tris-HCl, 100 mM NaCl, pH 7.0. After dialysis, more than 95% of the protein was recovered as evidenced by the protein concentration measured by UV spectroscopy. No significant aggregates were observed, as judged by the absence of light scattering. Tryptophan fluorescence spectra of proteins at different denaturant concen-trations were acquired before and after dialysis. More importantly, in all cases the spectra were similar in intensity andlMAX.
The reversibility in each temperature unfolding experiment was investigated by comparing the initial value of CD signal at 220 nm with the signal value recovered after cooling the protein solution that underwent unfolding. In addition, the CD signal at 220 nm was also acquired at a rate of 1uC min21
from 95 to 0uC.
Hydrodynamic Behavior
Changes in hydrodynamic volumes were monitored by chro-matography on a SEC–HPLC system equipped with a 280 nm UV detector and a Superose12, or a Superdex S–200 HR 10/30 columns (Pharmacia Biotech, Sweden) equilibrated at room temperature in buffer 20 mM Tris-HCl, 100 mM NaCl, 1 mM EDTA, pH 7.0. This type of chromatographic resin lets us examine the presence of soluble aggregates in the samples. The flow rate was 0.2 to 0.5 mL min21
and the injection volume was 100–200mL. Samples were centrifuged at 14,000 rpm before loading onto the column, which was previously calibrated with appropriate molecular weight markers of known Stokes radii (RS)
[60].
Dynamic light scattering analysis was also performed to investigate the hydrodynamic behavior and quaternary arrange-ment of hFXN90–195 variant. In this case, 1 mg/mL (buffer 20 mM Tris-HCl, 100 mM NaCl, 1 mM EDTA, pH 7.0) was
analyzed in a standalone dynamic light scattering instrument (DynaPro NanoStar from Wyatt Technology). Experiments were performed in batch mode at 25uC. Samples of 50–100mL were filtered by 0.22mm and centrifuged for 20 min at 10000 rpm at
4.0uC. Size distribution by mass was determined using isotropic spheres as the model. Polydispersity (%Pd), is equal to the standard deviation of the distribution from the mean value weighted by its mass fraction divided by the mean RSand multiplied by 100.
In addition, analytical ultracentrifugation experiments (AUC) were also performed to gain a better characterization of both protein variants in aqueous solution. All AUC experiments were performed on a Beckman Coulter XL-I analytical ultracentrifuge. Sedimentation velocity (SV) experiments of solutions were performed at 20uC, at a rotor speed of 42,000 rpm using the 8-hole ANTi-50 rotor. Cells were equipped with sapphire windows. Titane double sector centerpieces from Nanolytics Inc. were used. Cells were filled, for centerpieces with 1.2 and 0.3 cm optical path, with 400 and 100ml, respectively, of sample and solvent reference. SV profiles were acquired overnight, using absorbance optics, at intervals of 13 min for each cell. In order to study non ideality effects of the solution, various protein concentrations were investigated (1.0, 0.5, and 0.25 mg/mL) and the sedimentation and diffusion coefficients at infinite dilution, s0 and D0, were derived from the linear approximations. Density and viscosity of the buffer, which are required for the analysis, were calculated with SEDNTERP software, from John Philo (http://www.jphilo. mailway.com/). Analyses of SV experiments were made using the continuous distribution c(s) and the non-interacting species model analysis of SEDFIT software from P. Schuck (http://www. analyticalultracentrifugation.com). SEDFIT software uses a nu-merical solution of the Lamm equation and incorporates the possibility of accounting for the systematic noise of the experimental data. Buffer was 10 mM Tris-HCl, 100 mM NaCl, pH 7.0.
Spectophotometric Determination of Iron
Iron concentration was determined using a colorimetric method based on the coordination of Fe2+
by 1,10–phenanthroline [61]. Briefly, 1,10–phenanthroline was prepared in 0.1 N HCl, and a standard iron solution (18 mM) was prepared in 0.47 mM sulfuric acid for calibration curves. A volume of 100mL of ascorbic acid (10%) plus 100mL of sodium citrate (10%) was mixed with the sample (up to 700mL) and water (700mL minus the volume of
sample). After that, 100mL of the 1, 10–phenanthroline solution were added and remixed. Following an incubation of 15 min, the sample was centrifuged in a 1.5 mL tube at maximum speed for 5 min. This centrifugation step is important as protein aggregates may disperse light, generate scattering in the sample and thus lead to incorrect iron determinations. Next, absorbance at 512 nm was read. Routinely blanks were included in the measurements.
Molecular Dynamics Simulations. Simulation Details
position restrained simulations were carried out to equilibrate water molecules. A canonical ensemble simulation (N.V.T.) using Berendsen thermostat of 120 ps was perform at 300 K and tau = 1 ps21
. Later a microcanonical (N.P.T.) simulation using a Berendsen thermostat 120 ps at 300 K and tau = 1 was per-formed. Finally, 500 ps of simulation applying a restraint to alpha carbons of 25 kJ/mol. The resulting structures were the starting points for the production simulations. For restrained and non-restrained production simulations Nose-Hoover thermostat was used for temperature coupling, while Parrinello-Rhaman thermo-stat was used for pressure coupling. In all cases, long-range interactions were computed according to the particle mesh Ewald method.
Structure-based simulations. To investigate the folding of hFXN in perfectly funneled energy landscapes, structure-based simulations of hFXN were performed [41,64]. Briefly, each residue is represented by a single bead centered in its Caposition, and adjacent beads are strung together into a polymer chain by means of a potential encoding bond length and angle constraints. The secondary structure is encoded in the dihedral angle potential and the non-bonded (native contact) potential. The interaction energy V for a given protein conformationCis given by:
V(C,Co)~ X
Bonds
er(r{r0)2z X
Angles
eh(h{h0)2
z X
dihedral
ew(n)½1zcos (n|(w{wo))
z X
ivj{3
e(i,j) 5 sij r 12
{6 sij r 10
ze2(i,j) sij
r 12
ð3Þ
An interaction between two residues (i, j) exists if the distance between the Caatoms of the residues is in the range of 4.0 to 6.0 A˚ .
Native pairs of residues with a distance ofj#i+3 are discarded from the native map as any three or four subsequent residues are already interacting in the angle and dihedral terms [41]. In equation (3), r, h, and W stand for the ith virtual bond length between ithand (i+1)thresidue, the virtual bond angle between (i– 1)thand ithbonds, and the virtual dihedral angle around the ith bond, respectively. The parameters ro,ho, and Wo stand for the
corresponding variables in the native structure. Kr, Kh, KWweigh
the relative strength of each kind of interaction entering the energy and they are taken to be Kr= 100e, Kh= 20e, KW(1) =e and
KW(3) = 0.5e. All native contacts are equally weighted in a 10–12
Lennard-Jones potential. We used the simulation package GROMACS 4.5.4 [65] and the topology, structure, and contact map inputs were calculated using the SMOG server at http:// smog.ucsd.edu [64].
A contact is considered to be formed if the distance between the Caatoms is shorter thanctimes their native distance r0ij. In this
work we used c= 1.2. Several constant temperature runs were performed and results analyzed by the weighted histogram analysis method (WHAM) [42,43], using Q (fraction of native contacts) as the main reaction coordinate [66].
Supporting Information
Figure S1 Analytical ultracentrifugation. Sedimentation velocity of hFXN90–195 (left panels) and hFXN90–210 (right panels) at 42000 rpm and 20uC, in 10 mM Tris-HCl, 100 mM NaCl, pH 7.0. (A) Selection of raw data for both proteins at 1 mg/mL. (B) Superposition of experimental (dots) and fitted (continuous line)
profiles corrected for all systematic noise for both variants at 1 mg/mL. The last profiles correspond to 16 h of sedimentation. The fit was obtained from the c(s) analysis of the SEDFIT program. For both proteins, the Lamm equation was simulated for 300 particles in the ranges (0.4 S, 15 S) and (0.4 S, 4 S), with a partial specific volumevv~0:73mL g
21
and a frictional ratio f/ fmin= 1.25 (which corresponds to a globular, usually hydrated,
macromolecule). (C) Superposition of the differences between the experimental and fitted curves. (D) Corresponding c(s) distribution in the range 0.4–15 S for both variants at 1 mg/mL. The signal was normalized to 1 cm optical path length. (E) Superposition of the c(s) distributions for different concentrations of both proteins in the range 0.4–4 S, corresponding to more than 96% of the total signal. The signal was normalized to 1 cm optical path length. (TIF)
Figure S2 Size distribution of hFXN variants as determined by DLS. Experiments were performed in batch mode at 25uC. Samples of 50–100mL were filtered by 0.22mm and centrifuged for 20 min at 10000 rpm at 4.0uC. Size distribution by mass was determined using isotropic spheres as the model. Distributions for hFXN90–210 and hFXN90–195 are shown in black and red, respectively. Proteins (at 1 mg/mL in buffer 20 mM Tris-HCl, 100 mM NaCl, 1 mM EDTA, pH 7.0) were analyzed in a standalone dynamic light scattering instrument (DynaPro NanoS-tar from Wyatt Technology).
[image:15.612.72.298.302.383.2](TIF)
Figure S3 Reversibility of the chemical unfolding reactions for hFXN variants. Reversibility of hFXN90–210 (A, B, C and D) and hFXN90–195 (E, F, G and H) was verified by dialysis. Proteins were incubated for three hours with urea or GdmCl at different concentrations, at room temperature, to ensure equilibrium conditions and to minimize chemical modifications (left panels). Next, proteins were extensively dialyzed (overnight at 4uC) against buffer 20 mM Tris-HCl, 100 mM NaCl, pH 7.0 (the final concentrations of denaturant are detailed in the plots, right panels). Tryptophan fluorescence spectra of proteins at different denaturant concentrations were acquired before (left panel) and after dialysis (right panel). More importantly, in all cases the 5 spectra were similar in intensity and lMAX. After dialysis, more
than 95% of the protein was recovered as evidenced by the protein concentration measured by UV spectroscopy. No significant aggregates were observed, as judged by the absence of light scattering.
(TIF)
Figure S4 Reversibility of the temperature unfolding reactions for hFXN variants. (A) Transitions were followed by far-UV CD from 4 to 60uC and 4 to 80uC for hFXN90–195 and hFXN90– 210, respectively. When proteins reach the highest temperature they were cooled to 4uC in a fast way, without control of the cooling rate. The signal recovery was 96%, and 99% for hFXN90–195 and hFXN90–210, respectively. The superposition of the consecutive unfolding curves (scan (circles), rescan (squares) and the starting points of the re-rescan (triangles)) are shown for hFXN90–195 and hFXN90–210 in red and black, respectively. The rate was 1uC/min. (B) Unfolding curves for each variant were performed at two different rates = 1.0uC min21
and 0.5uC min21
, filled and empty symbols, respectively.
(TIF)
Figure S5 Effect of sodium sulfate on the hFXN90–195 conformation. Far-UV CD spectra of hFXN90–210 (gray) and hFXN90–195 (orange) were acquired in the presence of 200 mM Na2SO4 or in the absence of the osmolyte (FXN90–
210 in black, and hFXN90–195 in red). In addition, spectra of the unfolded states of both proteins were acquired in the presence of 5.0 M GdmCl. The inset shows the CD signal difference (%) upon Na2SO4 addition. Buffer was 20 mM sodium phosphate,
100 mM NaCl, pH 7.0 and the experiment was performed at 25uC.
(TIF)
Figure S6 Proteolytic sites observed between 20 s and 5 min in hFXN90–195 (red) and hFXN90–210 (blue), respectively. The other aromatic residues, potentially sites of chymotrypsin, are highlighted in black through hFXN90–210 amino acid sequence. hFXN variants were incubated at 25uC with chymotrypsin at mass ratios of 1:200 (protein: protease), in buffer 20 mM Tris?HCl, 100 mM NaCl, 1 mM EDTA, pH 7.0. The reaction was stopped by addition of 0.2% TFA and 1 mM PMSF. Samples were kept at
270uC until analysis by SDS–PAGE and RP–HPLC, followed by MALDI or by ESI–MS. A secondary structure scheme for residues 90–210 taken from PDB ID: 1EKG is shown on top.
(TIF)
Figure S7 The application of COREX/BEST (green) and FOLDX (blue) to calculate the the unfolding probability per hFXN residue and the contribution per residue to the protein stability, respectively. In both cases the hFXN structure input used was PDBID = 1EKG. More importantly, the algorithm COREX/ BEST identified the loop 1 as the section of hFXN with the highest probability of experiencing local unfolding. FOLDX showed L198, L200 and L203 of the CTR; and residues L182, L186 and L190 of the C-terminala-helix established stabilizing interactions. (TIF)
Figure S8 Frustratograph on hFXN: local frustration calculated for pdb code 1EKG [40]. The protein backbone is displayed as gray ribbons for residues 90–195 and blue for residues 96–210. The direct inter-residue interactions with solid lines and the water-mediated interactions with dashed lines. Minimally frustrated interactions are shown in green, highly frustrated contacts in red, neutral contacts are not drawn.
(TIF)
Figure S9 Folding transition for the CTR. (A) Energy profile for the CTR and the hFXN90–210 protein as a function of the native contacts formed, calculated at the melting temperature of the protein. (B) Energy profile for the CTR and hFXN90–210 as a function of the native contacts formed, calculated at the melting temperature of the CTR. (C) Calorific capacity at constant volume for the CTR and the hFXN90–210. The peak represents the melting temperature for the bound/unbound reaction of the CTR with the rest of the protein. The inset shows a broader look at both transitions. Black lines represent the reactions for the whole protein while green lines represent the reactions for the CTR. (TIF)
Figure S10 Contact matrix of the native and transition state ensembles sampled through the structure based model simulations. Each dot represents a native contact between the amino acid residue in x-axis and the amino acid residue in y-axis. The color range in the right represents the probability of formation of each contact. (A) Contact matrix for the native state ensemble. (B) Contact matrix for the transition state ensemble.
(TIF)
Figure S11 Unfolding kinetics of hFXN90–210 and hFXN90– 195 followed by tryptophan fluorescence emission intensity. The
unfolding reactions were performed at 20uC in buffer 20 mM Tris-HCl, 100 mM NaCl, 1 mM EDTA, pH 7.0. GdmCl was added as the chaotropic agent. The concentrations of GdmCl in the experiment were set to establish conditions where the difference in free energy between native and unfolded states is the same for both variants. If native and unfolded states of each variant are located at the same free energy level (inset), then the difference in the unfolding speed would be related to a difference in the transition barrier (?GNTS). The hFXN90–195 and
hFXN90–210 unfolding reactions are shown in red and black dashed lines, respectively. The reactions were started by manual dilution of protein from 0 to 1.4, in the former, and 2.5 M GdmCl, in the latter case. In red and black solid lines the native signals, dilutions of proteins in the absence of denaturant agent were made for these experiments. Excitation and emission were at 295 and 346 nm, respectively.
(TIF)
Figure S12 Iron induced aggregation of hFXN90–195 (red line) and hFXN90–210 (black line) followed by light scattering. The assay was performed at 20uC in buffer 50 mM HEPES, pH 7.0. Iron (Fe3+
) and protein concentration were 50 and 250mM, respectively. At the 5 min mark, FeCl3solution was added from a
25 mM stock solution prepared in 0.1 N HCl (arrow) and the change in OD at 350 nm was recorded. In blue, the iron was added to a 250mM EDTA solution. In blue, the iron was added in
the absence of protein to the solution buffer 50 mM HEPES, pH 7.0
(TIF)
Table S1 Concentration dependence analysis of sedimentation, at 42000 rpm and 20uC, of hFXN 90–195 and hFXN90–210, in 10 mM Tris-HCl, 100 mM NaCl, pH 7.0. The SV profiles of both variants at the three concentrations were analyzed in terms of one non-interacting species. The species is characterized by the absorbance signal at 280 nm (which is proportional to concentra-tion c), a sedimentaconcentra-tion coefficient s, and an apparent diffusion coefficient Dapp. The absorbance signal and s obtained by the non
interacting species analysis are (within experimental error) those of the c(s) analysis. Linear regressions of s21
(c) and Dapp(c) provides
values for sedimentation and diffusion at infinite dilution, s0and
D0. Molecular mass M and RS are obtained from s0 and D0
through Svedberg and Stokes-Einstein equations respectively. (DOC)
Table S2 Native contacts between the CTR and the rest of the protein as studied by structure-based model simulations. (DOC)
Acknowledgments
We specially thank Dr. He´le`ne Puccio for kindly providing us with the FXN gene, Dr. Patricio O. Craig for assistance in structure-based model simulations, and Christine Ebel from the AUC platform of the PSB at the IBS, Grenoble. We also acknowledge valuable comments on MDS data analysis by Dr. Mariano C. Gonza´lez Lebrero.
Author Contributions