Resumen
Esta tesis doctoral consta de cuatro estudios independientes incluidos en los capítulos del 2 al 5. Todos tienen en común el uso de los experimentos económicos además de la teoría y el análisis estadístico. Hay más cosas en común. Tres de los estudies estudian la cooperación, capítulos 3,4 y 5. Entre estos tres hay dos artículos de Organización Industrial, capítulos 3 y 4, en los cuales la cooperación recibe el nombre de colusión.
El capítulo 2 se titula “La Subasta de los Palillos Chinos: Un Estudio del Problema de la Exposición en Subastas con Varias Unidades’. Las subastas con varias unidades conllevan a veces el llamado problema de la exposición. En este artículo analizamos un caso simple llamado la ‘subasta de los palillos chinos’ en el cual los participantes se enfrentan al problema de la exposición. Analizamos esta subasta con información incompleta desde puntos de vista teórico y experimental. En teoría esta subasta tiene un equilibrio ineficiente y es equivalente en términos de beneficios con la subasta de segundo precio, que no tiene problemas de exposición. En los experimentos resulta que la subasta de los palillos chinos es algo menos eficiente pero da muchos más beneficios que la de segundo precio.
El capítulo 3 se llama “Colusión y Peleas en un Experimento con Empresas que Fijan Precios y Producen por Adelantado”. Aquí presentamos resultados de
experimentos de mercado en los que las empresas deciden repetidamente sobre precios y cantidades de un bien perecedero. El juego de etapa no tiene equilibrio en estrategias puras. Los experimentos constan de tratamientos con dos o tres empresas competidoras idénticas. Las empresas tienden a cooperar para evitar ‘peleas’. Cuando pelean las bancarrotas ocurren frecuentemente. En media el comportamiento está más cerca de la competencia en cantidad que de la competencia en precios. El excedente de los
consumidores aumenta con el número de empresas pero la producción no vendida lleva a pérdidas de eficiencia mayores en el lado de las empresas. Con el tiempo los precios tienden a los precios máximos para los mercados con dos y con tres empresas.
El capítulo 4 se llama “Competencia en Precio y Cantidad y Ciclos de Edgeworth”. En este estudio se consideran mercados en los cuales ocho empresas compiten decidiendo precio y cantidad al mismo tiempo con una capacidad dada. Cada periodo las mismas ocho empresas compiten en el mismo mercado. Si una empresa tiene pérdidas demasiado grandes va a la bancarrota y debe abandonar el mercado. Todas las observaciones presentan fuertes ciclos en precio y en cantidad que se parecen a los ciclos de Edgeworth. Cada empresa tiende a fijar precios inferiores a los de las otras y a incrementar su producción al mismo tiempo. Los precios acaban por llegar al coste marginal, entonces alguna empresa fija un precio muy alto y produce muy poco. Las otras empresas la imitan y entonces empieza otro ciclo.
Summary
This Ph. D. dissertation consists of four independent studies included in chapters 2 to 5. All of them have in common that economic experiments were used as an analytical tool besides the usual economic theory and econometrics or statistics. There are more similarities. Three of them study the issue of cooperation, chapters 3,4 and 5. Among these three there are two Experimental Industrial Organization papers, chapters 3 and 4, in which the abstract cooperation phenomenon becomes collusion between firms. Chapter 2 has as a title "The Chopstick Auction: A Study of the Exposure Problem in Multi-Unit Auctions". Multi-unit auctions are sometimes plagued by the so-called exposure problem. We analyze a simple game called the ‘chopstick auction’ in which bidders are confronted with the exposure problem. We analyze the chopstick auction with incomplete information both in theory and in a laboratory experiment. The chopstick auction has an efficient equilibrium and is revenue equivalent with the second-price sealed-bid auction in which the exposure problem is not present. In the experiment, however, we find that the chopstick auction is slightly less efficient but yields far more revenue than the second-price sealed-bid auction. We conclude that auction designers do not have to worry that the exposure problem leads to low revenue and inefficiency.
Chapter 3 is called "Collusion and Fights in an Experiment with Price-Setting Firms and Production in Advance", here we present results from 50-round market experiments in which firms decide repeatedly both on price and quantity of a completely perishable good. Each firm has capacity to serve the whole market. The stage game does not have an equilibrium in pure strategies. We run experiments for markets with two and three identical firms. Firms tend to cooperate to avoid fights and when they fight bankruptcies are rather frequent. On average, pricing behavior is closer to that for pure quantity than for pure price competition and price and efficiency levels are higher for two than for three firms. Consumer surplus increases with the number of firms, but unsold
production leads to higher efficiency losses with more firms. Over time prices tend to the highest possible one for markets both with two and three firms.
Chapter 4 is called "Price-Quantity Competition and Edgeworth Cycles". In this study I consider markets in which eight firms compete deciding simultaneously on price and quantity with a given capacity. Every round the same eight firms met each other in the same market. If a firm made high enough losses it went bankrupt and left the market. In this case capacity was distributed among surviving firms following a proportional profit rule. All observations exhibit strong cycles in price and supplied quantity that resemble Edgeworth cycles. Actually firms tended to undercut each others price increasing their production at the same time. Eventually prices reached the marginal cost, then a firm set a very high price and a small quantity and the others followed it and another cycle started.
Finally, chapter 5 has as title "Feeding the Leviathan". Here, using a step-level public good game, we analyze the effects on contributions of having played under a costly sanctioning regime. We find that educational effects, in terms of learning a particular way to coordinate towards good equilibria, are more relevant than motivational
Four Essays on Experimental Economics
Pablo Guillén Álvarez
Ph. D. Thesis/Tesi Doctoral
IDEA
Departament d’Economia i d’Història Econòmica
Facultat d’Economia
Universitat Autònoma de Barcelona
Thesis Advisor: Jordi Brandts i Bernad
Contents
1 Introduction 3
2 The Chopstick Auction: A Study of the Exposure Problem in
Multi-Unit Auctions1 5
2.1 Introduction . . . 5
2.2 Theory . . . 9
2.3 Laboratory experiment . . . 11
2.3.1 Experimental design . . . 12
2.3.2 Results: revenue . . . 13
2.3.3 Results: efficiency . . . 16
2.4 Conclusions . . . 17
2.5 References . . . 18
2.6 Appendix . . . 21
2.6.1 Proof of Proposition 1 . . . 21
2.6.2 Proof of Proposition 3 . . . 22
2.6.3 Instructions for the experiment . . . 24
3 Collusion and Fights in an Experiment with Price-Setting Firms and Production in Advance2 30 3.1 Introduction . . . 30
3.2 Basic Set-up and Theoretical Considerations . . . 34
3.3 Experimental design . . . 39
3.4 Experimental results . . . 40
3.5 Conclusions . . . 48
3.6 References . . . 50
3.7 Appendix A: Instructions . . . 52
3.8 Appendix B: Overall Tables . . . 55
3.9 Appendix C: Graphs . . . 58
4 Price-Quantity Competition and Edgeworth Cycles 65 4.1 Introduction . . . 65
4.2 Experimental design . . . 72
4.3 Experimental results . . . 75
4.3.1 ARIMA analysis . . . 82
4.4 Conclusions . . . 84
4.5 References . . . 87
4.6 Appendix A: Instructions . . . 90
4.7 Appendix B . . . 92
5 Feeding the Leviathan3 101 5.1 Introduction . . . 101
5.2 General experimental design . . . 104
5.2.1 Predictions and comparisons . . . 106
5.2.2 Hypotheses . . . 108
5.3 Sample and Procedure . . . 110
5.4 Results . . . 111
5.5 Conclusions . . . 116
5.6 References . . . 119
5.7 Appendix A . . . 122
5.8 Appendix B . . . 126
1
Introduction
This Ph. D. dissertation consists of four independent studies included in chapters 2 to 5. All of them have in common that economic experiments were used as an analytical tool besides the usual economic theory and econometrics or statistics. There are more similarities. Three of them study the issue of cooperation, chapters 3,4 and 5. Among these three there are two Experimental Industrial Organization papers, chapters 3 and 4, in which the abstract cooperation phenomenon becomes collusion between firms.
Chapter 2 has as a title ”The Chopstick Auction: A Study of the Exposure Problem in Multi-Unit Auctions”. Multi-unit auctions are sometimes plagued by the so-called exposure problem. In this paper, we analyze a simple game called the ‘chopstick auction’ in which bidders are confronted with the exposure problem. We analyze the chopstick auction with incomplete information both in theory and in a laboratory experiment. In theory, the chopstick auction has an efficient equilibrium and is revenue equivalent with the second-price sealed-bid auction in which the exposure problem is not present. In the experiment, however, we find that the chopstick auction is slightly less efficient but yields far more revenue than the second-price sealed-bid auction. We conclude that auction designers do not have to worry that the exposure problem leads to low revenue and inefficiency.
Chapter 3 is called ”Collusion and Fights in an Experiment with Price-Setting Firms and Production in Advance”, here we present results from 50-round market experiments in which firms decide repeatedly both on price and quantity of a completely perishable good. Each firm has capacity to serve the whole market. The stage game does not have an equilibrium in pure strategies. We run experiments for markets with two and three identical firms. Firms tend to cooperate to avoid fights and when theyfight bankruptcies are rather frequent. On average, pricing behavior is closer to that for pure quantity than for pure price competition and price and efficiency levels are higher for two than for three
one for markets both with two and three firms.
Chapter 4 is called ”Price-Quantity Competition and Edgeworth Cycles”. In this study I consider markets in which eight firms compete deciding simultaneously on price and quantity with a given capacity. Every round the same eight firms met each other in the same market. If afirm made high enough losses it went bankrupt and left the market. In this case capacity was distributed among survivingfirms following a proportional profit rule. All observations exhibit strong cycles in price and supplied quantity that resemble Edgeworth cycles. Actually firms tended to undercut each others price increasing their production at the same time. Eventually prices reached the marginal cost, then a firm set a very high price and a small quantity and the others followed it and another cycle started.
Finally, chapter 5 has as title ”Feeding the Leviathan”. Here, using a step-level public good game, we analyze the effects on contributions of having played under a costly sanc-tioning regime. We find that ”educational” effects, in terms of learning a particular way to coordinate towards ”good” equilibria, are more relevant than motivational ”crowding out” effects, whereby cooperating to avoid sanctions spoils intrinsic incentives. In one of our treatments people vote on whether to remove the sanctioning system, whereas in the other removal is automatic. In the voting treatment participants cooperate as much as in the automatic removal only when the decision to remove the sanctioning device entails a clear ”trust” message.
2
The Chopstick Auction: A Study of the Exposure
Problem in Multi-Unit Auctions
42.1
Introduction
Multi-unit auctions are sometimes plagued by what is called the ‘exposure problem’. We speak of an exposure problem when bidders aim at winning several units but are exposed to the risk of buying too few as competition on some of these units turns out to be tougher than expected.5 Several economists have argued that the exposure problem in auction should be prevented as it leads (1) to an inefficient outcome of the auction and (2) to low revenue. In this paper, we will investigate whether these claims are true, both using a game theoretical model and a laboratory experiment.
Economic theory sketches a mixed picture about both claims. Theoretical papers by Robert Rosenthal and coauthors include situations in which the exposure problem is present. Szentes and Rosenthal (2003a, 2003b) find efficient equilibria in multi-unit auctions of homogeneous objects. However, Krishna and Rosenthal (1996), and Rosenthal and Wang (1996) construct inefficient equilibria in the case of heterogeneous objects. In these papers, the authors analyze multi-unit auctions with two types of bidders, namely ‘local bidders’ who are interested in only one object, and ‘global’ bidders who try to acquire several. The global bidders, in competition with the local ones, face the exposure problem when attempting to realize synergies between the objects. In line with this, Bykowsky et al. (1998) give an illustrative example in which the equilibrium outcome is such that either the allocation is inefficient or at least one of the bidders ends up paying more for the purchased items than they are worth to her.
Other theorists have investigated the relationship between efficiency and revenue. Ausubel and Cramton (1998, 1999) stress the importance of efficiency of the auction out-come in terms of revenues for the seller in auctions of perfectly divisible objects. Ausubel and Cramton (1999) show that efficiency of the auction outcome is necessary for revenue
maximization when the auction is followed by a perfect resale market and when the seller cannot commit to not selling some units. However, usually there is a trade-off between efficiency and revenue. In Myerson’s (1981) model, the seller maximizes his expected revenue by imposing a reserve price and hence excluding bidders with low values from winning the object. Milgrom (2000) constructs an example in which there is a trade-off between efficiency and revenue in the case of multi-unit auctions: the seller realizes a less efficient outcome when using larger packages but gets a higher revenue.
In practice, it is also not clear whether the exposure problem is a major issue. At least Klemperer (2002) does not include the warning ‘avoid the exposure problem’ in his list of issues that are of practical importance in the design of (multi-unit) auctions. However, Van Damme (2000) claims that the exposure problem led to low bids and an inefficient outcome in the Dutch DCS-1800 auction. In February 1998, the Dutch government auc-tioned licenses for second generation mobile telecommunication using an auction with almost the same rules as the FCC auctions in the US.6 A difference between the Dutch DCS-1800 auction and the American auctions was that in the American auctions, the ex-posure problem was not seriously present as bidders were allowed to withdraw their bids. Van Damme argues that the FCC auction format would have lead to a higher revenue and a more efficient outcome.
Does the exposure problem indeed lead to inefficient outcomes and low revenues? In order to answer this question, we designed a laboratory experiment in which we confronted subjects with a simple auction game called ‘the chopstick auction’ (CSA).7In this auction, a seller simultaneously sells three chopsticks. There are 2 bidders in the auction, who independently submit a bid, which is the price for one chopstick. Call the second highest bid p. The outcome of CSA is such that the highest bidder gets two chopsticks for a price of 2p and the second highest bidder gets one chopstick for p. We compared CSA with the second-price sealed-bid auction (SPSB) in which two chopsticks are sold as one
6See McMillan (1994), Cramton (1995, 1998), McAfee and McMillan (1996), and Milgrom (2000) for
descriptions and discussions of these auctions.
7The credit for the name of this auction game goes to Mary Lucking-Reiley. Thanks to Balasz Szentes
bundle. The only difference with the ‘usual’ second-price sealed-bid auction is that the winning bidder has to pay the second highest bid twice, once for each chopstick. We investigated bidding behavior in CSA and in SPSB in the following setting. Bidder i’s (i = 1,2) marginal values are zero on the first chopstick, vi on the second, and zero on
the third. The signals vi are drawn independently from a uniform distribution on the
interval [0,100]. As the second highest bidder wins a worthless chopstick for a positive price, bidders face the exposure problem in CSA.
A game closely related to CSA is the dollar auction. In the dollar auction, two bidders play an ascending auction in order to win $1. The highest bidder wins the dollar, but both bidders pay the price at which the second highest bidder decided to step out. Note that bidders face the exposure problem here: the second highest bidder fails to win a dollar but still has to pay a positive price. In equilibrium, bidders play a mixed strategy in which both independently pick a price level at which they leave the auction. This price level follows an exponential distribution with mean 1. The expected revenue for the seller of the dollar is exactly one dollar. However, when Shubik (1971) and others confronted subjects with this game in the lab, the average revenue was significantly larger than $1.
There are two main differences between Shubik’s experiment and ours. First, subjects in the dollar auction are completely informed about the value of the auctioned object (which is $1 for both bidders), whereas in our experiment, subjects are only incompletely informed about the value of the other bidder. Moreover, the winner in Shubik’s experiment pays the same amount as the loser, whereas in CSA, the winner pays twice the loser’s bid. In this paper, we study CSA and SPSB in a laboratory experiment and confront the outcomes with theoretical predictions. In section 2, we will give theoretical properties of CSA and SPSB in terms of equilibrium behavior and expected revenue.8 Assuming that both bidders are risk neutral and draw their value vi from a uniform distribution
on [0,100], wefind that CSA has an efficient Bayesian Nash equilibrium. From standard auction theory we learn that SPSB has an efficient equilibrium in dominant strategies in which each bidder submits a bid equal to half her value for each chopstick. The revenue
equivalence theorem (Myerson, 1981) then implies that CSA is revenue equivalent with SPSB. In other words, in this theoretical setting, auctions in which the exposure problem is present perform as well as auctions in which it is not. That makes this setting a useful benchmark to test the two claims we started with.
In section 3, we describe the experimental design and present the results of the ex-periment. Our first result is the striking difference between the obtained revenue in CSA and SPSB. In line with the outcomes of the dollar auction, revenue tends to be higher when bidders are confronted with the exposure problem than if they are not. Our second
finding is that there is a significant but small difference between the efficiency of CSA and of SPSB. Both auctions turn out to be reasonably efficient. Although we observe only little learning during the experiment, these results seem to be robust.
Our third result may seem somewhat surprising: in SPSB, the average revenue was about 20% above the theoretical outcome, assuming that the bidders play a weakly dom-inant strategy, i.e., bidding half their value. This finding is in contrast to what is found in experiments by Kagel et al. (1987), Kagel and Levin (1993), and Harstad (2000) on the ‘standard’ second-price sealed-bid auction. In these experiments, the average revenue was only about 10% above the dominant strategy.9 A possible explanation of this result is that we have complicated the game somewhat: when winning, a bidder has to paytwice the second highest bid, once for each chopstick. This is different than what happens in the usual second-price sealed-bid auction, in which the winner pays the second highest bid only once. This framing effect shows that even a slight complication of the environment may make it harder for people to act rationally. Also this result is robust in the sense that we do this observation both in the earlier and the later periods in the experiment.
We conclude that our experiment does not give a convincing reason why the warning ‘avoid the exposure problem’ should be added to Klemperer’s list of practical issues in the design of auctions. CSA is virtually as efficient as SPSB and turns out to yield much more revenue.
2.2
Theory
Consider a situation with 2 bidders, labelled 1 and 2, who wish to eat Chinese food. However, none of the bidders has anything to eat with. Suppose that a seller sells 3 chopsticks in the chopstick auction (CSA) which has the following rules. The price starts at zero and is continuously raised. Bidders have the opportunity to leave the auction at any price they desire. The auction ends when one bidder quits. She wins one chopstick and pays the price at which she leaves. The remaining bidder wins two chopsticks and pays two times the price at which the second highest bidder has quit. If there is a tie, the winner of the auction is determined by tossing a fair coin.
The valueVi(s)bidder i attaches to ownings chopsticks is given by
Vi(s) =
vi
0
s= 2,3
s= 0,1,
where vi is a private signal for bidder i. In words, a bidder attaches a value of vi to
winning two chopsticks and no value to winning only one chopstick or to winning a third one. We assume that thevi’s are drawn independently from a uniform distribution on the
interval [0,100].
Each bidder is a risk neutral expected utility maximizer. Suppose that the price realized in CSA is equal to p. The utility for bidderihaving drawn a value equal to vi is
given by
ui(vi, s, p) =
vi−2p −p
s= 2
s= 1 .
Observe that CSA is strategically equivalent to the following sealed-bid auction. The highest bidder, let’s say i, wins an object with valuevi and pays twice the bid of the other
Proposition 1 gives equilibrium bidding in CSA. By a standard argument, this bid function must be strictly increasing and continuous. Let U(v, w) be the utility for a bidder with signal v who behaves as if she has signal w, whereas the other bidders play according to the equilibrium bid function. A necessary equilibrium condition is that
∂U(v, w)
∂w = 0
at w=v. From this condition, a differential equation is derived, from which the equilib-rium bid function is uniquely determined.
Proposition 1 Let B(v), the bid of a bidder with signal v, be given by
B(v) =v+ [100−v] [log (100−v)−log 100].
Then B is the unique symmetric Bayesian Nash equilibrium of CSA. The outcome of the
auction is efficient. The bidder with the lowest possible value obtains zero utility.
Proof. See the appendix.
Let us compare the outcomes of CSA with the second-price sealed-bid auction in which two chopsticks are sold as one bundle (SPSB). The only difference with the ‘usual’ second-price sealed-bid auction is that the winning bidder has to pay the second highest bid twice, once for each chopstick. Proposition 2 gives the equilibrium properties of SPSB.
Proposition 2 Let b(v), the bid of a bidder with signal v, be given by
b(v) = 1 2v.
of SPSB. The outcome of the auction is efficient. The bidder with the lowest possible
value obtains zero utility.
Proof. Standard.
Propositions 1 and 2 show that both auctions are efficient. In other words, a seller who is concerned about efficiency is indifferent between the two auction types.
Moreover, both auctions turn out to be revenue equivalent, and generate the same expected utility for the bidders. This is a direct consequence of the revenue equivalence theorem (Myerson, 1981), using the following two observations. First, both CSA and SPSB are auctions of a single object, namely a set of two chopsticks. Second, according to Propositions 1 and 2, both auctions are efficient and the utility of the bidder with the lowest possible value is equal to zero. The interpretation of this revenue equivalence result is that a risk neutral seller interested in revenue is indifferent between using CSA and SPSB to sell the chopsticks. Proposition 3 summarizes this finding, and gives the expected revenue and the expected utility for the bidders.
Proposition 3 Suppose that bidders play CSA and SPSB according to the strategies given
in Propositions 1 and 2 respectively. Then for both CSA and SPSB, expected revenue
equals 3313 and ex ante expected utility for a bidder is 1623.
2.3
Laboratory experiment
2.3.1 Experimental design
In a computerized laboratory experiment, we studied CSA and SPSB in a setting that is closely related to the theoretical setting.10 The main differences are the following. First of all, the subjects in the lab were confronted with the sealed-bid version of CSA. Subjects did not see the price rise until one of them indicated to leave the auction. Instead, subjects were asked at which price they would desire to quit. However, the two games are strategically equivalent, so that we did not expect much differences in the outcomes.11
Secondly, we approximated the continuous signal and bidding spaces with fine grids. Subjects drew their values from a grid between 0 and 100, with 1 as the smallest step. Our theoretical results have been based on the assumption that bidders draw their signals from the interval [0,100]. Moreover, subjects could choose prices from a finite grid between 0 and 999, with 1 as the smallest step. The theory has been based on the assumption that bidders can choose their bids from a continuous action space. However, both grids are sufficientlyfine to approximate the continuous signal and action space.
The experiments were conducted at the faculty of economics and social sciences at Innsbruck University between 15 May and 3 June 2002. We conducted four sessions, each consisting of 24 subjects. We had between-subject treatments. In two sessions, subjects played CSA, and in the other two sessions, subjects were confronted with SPSB. In all sessions, the subjects were separated in groups of four. We ran three practice periods, followed by 40 paid trading periods. Before the start of each period, the subjects were randomly re-matched to an opponent in their group of four, resulting in 12 independent observations per treatment. In each period, all subjects drew a new value for two chop-sticks. At the beginning of each session, subjects read the instructions (see the appendix). Questions were answered privately.
Subjects were paid a lump sum transfer (5 euros) for showing up and an additional
10The experiment has been programmed and conducted with the software Z-tree (Fischbacher, 1999). 11Still, we should be somewhat cautious, as ‘framing effects’ may occur. For instance, in experiments
reward equivalent to their gains in the auctions.12 They earned points which were calcu-lated as the difference between the value of the chopsticks they won minus the price they paid. Points were exchanged into cash according to the exchange rate
100 points= 3 Euro.
In CSA, the winner of just one chopstick gets a negative score equal to the amount he paid for it. The maximum score in a period is 100 points, i.e., the maximum value (100) minus the minimum payment (0). If subjects played according to the bidding strategies in Propositions 1 and 2, they would have earned 25 euros on average.13 The experiments lasted about 45 minutes, so that the subjects could earn a salient amount of money.
2.3.2 Results: revenue
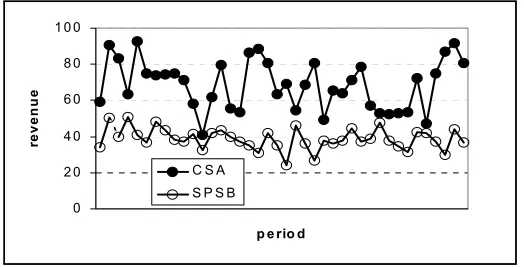
What is the average revenue in the auctions? In CSA, revenue equals three times the price: the winner of two chopsticks pays this price twice, the winner of one chopstick once. In SPSB, revenue is equal to twice the price. See figure 1 for the average revenue in each period.
12Paying every period as we did induces behavior towards risk neutrality. Paying according to one
randomly selected period, instead, may increase subjects’ willingness to take risks (Davis and Holt, 1993).
13The calculation is as follows. According to Proposition 3, subjects earn on average 162
3 points per
period. Given than they play 40 periods, and the exchange rate of 100 points = 3Euro, they expect to earn162
3∗40∗ 3
100 = 20Euro. Add to this number the 5 Euro lump sum transfer in order to end up with
0 2 0 4 0 6 0 8 0 1 0 0
p e rio d
reven
u
e
[image:17.595.98.360.108.242.2]C S A S P S B
Figure 1: Average revenues in CSA and SPSB.
Result 1CSA yields more revenue than predicted by the theory.
Subjects turned out to pay much more in CSA than predicted by the theory. Given the values in the experiment, the average revenue would have been 33 points per period if bidders had bid according to the bid function in Proposition 1. In reality, the average revenue was 68 points. As a consequence, the average payments to a subject was very low, i.e., about 60 eurocents. It is unclear to us what drives this result. Perhaps bidders are loss averse, and submit high bids in order to avoid losses. However, Onderstal (2002) shows that in CSA, loss averse bidders bid lower than risk neutral bidders so that loss aversion does not seem to be a satisfactory explanation. Of course, it could be that the subjects experienced difficulties in understanding the auction. The observation that a substantial number of bids constituted weakly dominated strategies indeed indicates this. We tested for learning by making statistical comparisons separately for the first and last 20 periods in order to account for learning effects. We found some learning in the sense that the difference between the average payment and the theoretical revenue was lower in the last 20 periods than in the first 20. However, convergence was slow as bids remained much higher than the theoretical prediction. We do not know what would have happened if the subjects had played more periods.
For SPSB, the theory predicts that revenue would have been32points on average per period. In the experiment, average revenue was equal to about 39 points, 22% more than the theoretical prediction. The subjects earned 19 euros on average, which is clearly less than the 25 euro they could have earned if they had played the weakly dominant strategy. As we have observed in the previous section, although a large fraction of the bidders bids according to the equilibrium strategy, a substantial subset of the bidders bid more than 50% of their value, playing a weakly dominated strategy. A possible explanation of this result is that we have complicated the game somewhat: when winning, a bidder has to pay twice the second highest bid, once for each chopstick. This is different than what happens in the ‘usual’ second-price sealed-bid auction, in which the winner pays the second highest bid only once. Overbidding in SPSB may be driven by the framing. Also this result turns out to be robust in the sense that overbidding is still present in later periods.
Result 3CSA and SPSB are not revenue equivalent: CSA yields much more revenue
than SPSB.
2.3.3 Results: efficiency
Efficiency is defined as follows
Efficiency= value of the winning bidder max{v1, v2}
[image:19.595.133.395.273.410.2].
Figure 2 shows the development of efficiency over the periods in both CSA and SPSB.
0 ,5 0 ,6 0 ,7 0 ,8 0 ,9 1
p e rio d
ef
fi
ci
en
cy
C S A S P S B
Figure 2: Average efficiency of CSA and SPSB.
Propositions 1 and 2 predict that both auctions are 100% efficient. In a worst case scenario, if the two chopsticks are assigned using a lottery, expected efficiency equals 75%.14 In CSA, we observed an average efficiency equal to 91%, which means that
Result 4CSA is reasonably efficient.
14The calculation for this number is the following. As both bidders are ex ante symmetric, we may
assume without loss of generality, that the lottery always assigns two chopsticks to bidder 1. Expected efficiency is then given by
Expected efficieny =
Z 100
0
·Z v2
0 v1 v2 ∗
1 100dv1+
Z 100
v2
1∗ 1 100dv1
¸
1 100dv2
= 3
4.
Thefirst term in the inner integral refers to the case that bidder 2 has a higher value than bidder 1 (so that efficiency equals v1
[image:19.595.168.493.630.681.2]The efficiency of CSA is much closer to the theoretical prediction of 100% than the outcome of a lottery. The same holds true for SPSB in which efficiency was 95%. This
finding is probably explained by the fact that several subjects bid their value instead of half of it. Still,
Result 5SPSB is reasonably efficient.
Using a Mann-Whitney test, we observe that the difference in efficiency between CSA and SPSB is significant only at a 5% level (p= 0,0209). Still the difference is not large, so that we conclude that
Result 6SPSB is only slightly more efficient than CSA.
We have checked whether these results change during the course of the experiment. This turns out not to be the case. For the first 20 periods, we observed 91% efficiency in CSA versus 94% in SPSB. In the final 20 periods (periods 21-40) we observe virtually no difference (91% in CSA and 95% in SPSB). In both the early periods and the late periods, the difference between CSA and SPSB is significant at a 5% level.
2.4
Conclusions
Does this mean that we recommend governments to design auctions in which the exposure problem is present? Probably not: especially if large amounts of money are at stake, bidders are wise enough to hire experts in auction theory whom we expect to convince bidders to correctly take the risks into account associated with the exposure problem. Still, in the case that a government is not sure about the conditions on the demand side, it may safely split up supply in small parts. The bidders could sort out themselves how many units they need to secure sufficient surplus. Depending on the shape of demand, the government may then design an auction in which the exposure problem is present. Our experiment has shown that this need not have a detrimental effect on the outcome.
What has remained somewhat puzzling to us is the observation that subjects in SPSB do not play weakly dominant strategies. We conclude that we have touched a broader topic in experimental economics or even in economics in general: a slight complication of the environment has a significant effect on the outcomes. This may be important for many applications/situations, from the introduction of elaborate pricing schemes to new currencies like the euro.
2.5
References
Ausubel, L. M., and Cramton, P. (1998). “Demand Reduction and Inefficiency in Multi-Unit Auctions,” working paper, University of Maryland.
Ausubel, L. M., and Cramton, P. (1999). “The Optimality of Being Efficient,” working paper, University of Maryland.
Bykowsky, M., Cull, R., and Ledyard, J. (1998). “Mutually Destructive Bidding: The FCC Auction Design Problem,” working paper, California Institute of Technology.
Coppinger, V. M., Smith, V. L., and Titus, J. A. (1980). “Incentives and behavior in English, Dutch and sealed-bid auctions,” Econ. Inquiry 43, 1-22.
Greenwich: JAI Press.
Cramton, P. C. (1995). “Money Out of Thin Air: The Nationwide Narrowband PCS Auction,” J. Econ. Manage. Strategy 2, 267-343.
Cramton, P. C. (1998). “The Efficiency of the FCC Spectrum Auctions,”J. Law Econ.
41, 727-736.
Davis, D. D., and Holt, C. A. (1993). Experimental Economics. Princeton, Princeton University Press.
Fischbacher, U. (1999). “Z-Tree: Zurich toolbox for readymade economic experi-ments,” working paper Nr. 21, Institute for Empirical Research in Economics, University of Zurich.
Harstad, R. M. (2000). “Dominant Strategy Adoption, Efficiency, and Bidders’ Expe-rience with Pricing Rules,” Exper. Econ. 3, 261-280.
Kagel, J. H. (1995). “Auctions: A Survey of Experimental Research,” in Handbook of Experimental Economics (J. H. Kagel,and A. E. Roth, eds.). Princeton, New Jersey: Princeton University Press.
Kagel, J. H., Harstad, R. M., and Levin, D. (1987). “Information Impact and Alloca-tion Rules in AucAlloca-tions with Affiliated Private Values: A Laboratory Study,”Econometrica
55, 1275-1304.
Kagel, J. H., and Levin, D. (1993). “Independent Private Value Auctions: Bidder Behavior in First-, Second-, and Third-Price Auctions with Varying Number of Bidders.” Econ. J. 103, 868-879.
Klemperer, P. (2002). “What Really Matters in Auction Design,” J. Econ. Perspect.
16, 169-189.
Krishna, V., and Rosenthal, R. (1996). “Simultaneous Auctions with Synergies,” Games Econ. Behav. 17, 1-31.
McAfee, R., and McMillan, J. (1996). “Analyzing the Airwaves Auction,” J. Econ. Perspect. 10, 159-175.
Auction,” J. Polit. Economy 108, 245-272.
Myerson, R. (1981). “Optimal Auction Design,”Math. Operations Res. 6, 58-73. Onderstal, S. (2002). “The Chopstick Auction,” working paper, Tilburg University. Rosenthal, R., and Wang, R. (1996). “Simultaneous Auctions with Synergies and Common Values,” Games Econ. Behav. 17, 32-55.
Shubik M. (1971). “The Dollar Auction Game: a Paradox in Noncooperative Behavior and Escalation,” J. Conflict Resolution 15, 545-547
Szentes, B., and Rosenthal, R. (2003a). “Three-Object Two-Bidder Simultaneous Auctions: Chopsticks and Tetrahedra,” Games Econ. Behav. 44, 114-133.
Szentes, B., and Rosenthal, R. (2003b). “Beyond Chopsticks: Symmetric Equilibria in Majority Auction Games,” Games Econ. Behav. 45, 278-295.
2.6
Appendix
2.6.1 Proof of Proposition 1
Let B(v), the bid of a bidder with signal v, be given by
B(v) =v+ [100−v] [log (100−v)−log 100].
Then B is the unique symmetric Bayesian Nash equilibrium of CSA. The outcome of the
auction is efficient. The bidder with the lowest possible value obtains zero utility.
Proof. The following observations imply that a symmetric equilibrium bid function
must be strictly increasing. First, a higher-value type of a bidder cannot exit before a lower-value type of the same bidder would exit. (Suppose the lower type is indifferent between two different strategies, giving her two different probabilities of being the ultimate winner of two chopsticks. The higher type then strictly prefers the strategy with the higher probability to win. Therefore, she will never quit earlier than the lower type.) Furthermore, there is no range in which the bid function is flat. (Suppose there is the bid function is flat at a price level of p. Then each bidder being in the range of signals that bid p exits the auction with positive probability at p. But if this is the case, then each bidder strictly prefers staying just a bit longer.)
Let B˜ be a symmetric and strictly increasing equilibrium bid function. If the other bidder bids according to B˜, the expected utility of a bidder with signal v who bids as if she has signal w is given by
U(v, w) =−(1− w
100) ˜B(w) +
w Z
0
(v−2 ˜B(x)) 1 100dx.
The FOC of the equilibrium is
∂U(v, w)
∂w =−(1− w
100) ˜B
0(w)
−B˜100(w) + v
100 = 0 (1)
at w=v. Rearranging terms we find
(100−v) ˜B0(v) + ˜B(v)
(100−v)2 =
v
(100−v)2,
which is equivalent to
˜
B(v) 100−v =
v Z
0
x
(100−x)2dx+C,
for some C. C must be zero (C must be at least zero, otherwise a bidder with signal 0
submits a negative bid; if C is larger than zero, a bidder with signal 0submits a strictly positive bid. As B˜ is (by assumption) strictly increasing, this bidder submits the lowest bid with probability one, and has to buy one chopstick for a positive price. Clearly, she is strictly better offby bidding zero.) Also the SOC is fulfilled assign(∂U∂w(v,w)) =sign(v−w). It is readily checked that B is the unique solution.
What remains to be checked it that B is strictly increasing. From (1), B is strictly increasing if and only if B(v)< v for almost all v∈[0,100]. This is true, as
B(v) = v+ [100−v] [log (100−v)−log 100]
< v
for all v∈(0,100). As B is strictly increasing, CSA is efficient.
2.6.2 Proof of Proposition 3
Suppose that bidders play CSA and SPSB according to the strategies given in Propositions
Proof. Expected revenue in SPSB can be calculated as follows. As in equilibrium, each bidder submits a bid equal to 50% of his value, the winner is the bidder with the highest value. She pays twice the bid of the lowest bidder. In other words, revenue is equal to the lowest value. Therefore, expected revenue is equal to331
3 as this is the expectation
of the lowest from two numbers independently drawn from a uniform distribution on the interval [0,100]. The utility for the winner of SPSB equals the value obtained minus the price paid. The expected value of two chopsticks for the winner is equal to the maximum of two numbers drawn independently from the uniform distribution on the interval[0,100], i.e. 6623. Given that he pays3313 in expectation, the winner’s expected utility equals3313. As ex ante both bidders have probability 1
2 to be the winner, ex ante expected utility for a
2.6.3 Instructions for the experiment
Original instructions were in German. These are instructions for
treatment CSA.
General information for participants
You are taking part in an economics experiment funded by the Jubilaeumsfonds der Oesterreichischen Nationalbank. The purpose of the experiment is to analyze decision
behavior in markets.
You will receive 5 Euro for showing up. If you carefully read the instructions and follow the rules you can earn a fair amount of money. During the experiment you can earn additional amounts of money. In this experiment you earn points. These points will be converted with a conversion rate of
100 points= 3 Euro.
Your final payoff consists of the initial 5 Euro given to you at the beginning of the experiment and the money you earn in the course of the experiment. You will be paid immediately after the experiment in cash.
Detailed instructions
In this experiment each participant is a buyer. You and one other buyer will participate in an auction in order to obtain units of a good. There are two possible outcomes. Either you obtain one unit, or you obtain two units. If you obtain only one unit, this is of no value for you. If you obtain two units, this will have a positive value for you. You will be informed about your value of obtaining two units. This value is a number between 0 and 100. Your value of obtaining two units of the good is randomly determined such that each number is equally likely to occur. This value is private information, i.e. neither you know the other buyer’s value nor does the other buyer know your value.
The experiment consists of 3 practice periods and 40 trading periods. The practice pe-riods will not account for yourfinal earnings. But you should take these periods seriously since you will gain valuable experience for the trading periods that are paid.
In each period you will participate in an auction with a second buyer. In each period you are randomly matched with another buyer. You will never know whom you are matched with and it may be that you are matched with somebody more often than once. In each period you and every other buyer are assigned new values for obtaining two units of the good. Notice that your value is very likely to be different from other buyers’ valuations.
The auction rules
The good is sold according to the following rules:
Each buyer is asked to submit a bid. This bid is the maximum amount the bidder is willing to pay for one unit of the good. The buyer who submitted the higher bid is the winner and obtains two units of the good. The buyer who submits the lower bid obtains only one unit.
For every unit you obtain you have to pay a price. This price equals the lower of the two submitted bids. The price and your value determine what you earn.
but you have to pay the price for each of those units, i.e. you earn a number of points equal to your value minus two times the price.
If you have obtained only 1 unit this is of no value for you but you have to pay the price for this unit, i.e. you lose a number of points equal to the price.
Note that you can, dependent on the price and your value, make losses.
Example
The following examples shall help you to become familiar with the auction and the design of the interface. You will first see the Decision Screen and then the Result Screen.
— Here the instructions contained a screenshot of the Decision Screen. —
In this case your valuation for obtaining two units of the good is 74. Your bid is 32. Important:
If you do not submit a bid within the prespecified time the computer will assign you a bid of 0.
When the time is elapsed you will see the Result Screen. (Notice that the numbers given in the screens serve illustrative purposes only.)
— Here the instructions contained a screenshot of the Result Screen of a winner.
—
>From the screen above you see that you submitted the highest bid. You obtain 2 units, realize a value of 63 and you pay 2 times the price. Check that you earned 33 point.
— Here the instructions contained a screenshot of the Result Screen of a loser.
—
Good Luck!
These are instructions for treatment SPSB.
General information for participants
You are taking part in an economics experiment funded by the Jubilaeumsfonds der Oesterreichischen Nationalbank. The purpose of the experiment is to analyze decision
behavior in markets.
You will receive 5 Euro for showing up. If you carefully read the instructions and follow the rules you can earn a fair amount of money. During the experiment you can earn additional amounts of money. In this experiment you earn points. These points will be converted with a conversion rate of
100 points = 3 Euro .
Your final payoff consists of the initial 5 Euro given to you at the beginning of the experiment and the money you earn in the course of the experiment. You will be paid immediately after the experiment in cash.
During the experiment communication is forbidden. If you have questions, please ask us. We will gladly answer your questions individually. It is very important that you follow this rule. Otherwise the results of the experiment will be of no value from a scientific perspective.
Detailed instructions
you obtain one unit, or you obtain two units. If you obtain only one unit, this is of no value for you. If you obtain two units, this will have a positive value for you. You will be informed about your value of obtaining two units. This value is a number between 0 and 100. Your value of obtaining two units of the good is randomly determined such that each number is equally likely to occur. This value is private information, i.e. neither you know the other buyer’s value nor does the other buyer know your value.
The experiment consists of 3 practice periods and 40 trading periods. The practice pe-riods will not account for yourfinal earnings. But you should take these periods seriously since you will gain valuable experience for the trading periods that are paid.
In each period you will participate in an auction with a second buyer. In each period you are randomly matched with another buyer. You will never know whom you are matched with and it may be that you are matched with somebody more often than once. In each period you and every other buyer are assigned new values for obtaining two units of the good. Notice that your value is very likely to be different from other buyers’ valuations.
The auction rules
The good is sold according to the following rules:
Each buyer is asked to submit a bid. This bid is the maximum amount the bidder is willing to pay for one unit of the good. The buyer who submitted the higher bid is the winner and obtains two units of the good. The buyer who submits the lower bid obtains only one unit.
For every unit the winner obtains, she has to pay a price. This price equals the lower of the two submitted bids. The price and your value determine what you earn.
If you have obtained only 1 unit this is of no value for you and you don’t have to pay the price for this unit, i.e. your income in this period is equal to 0.
Example
The following examples shall help you to become familiar with the auction and the design of the interface. You will first see the Decision Screen and then the Result Screen.
— Here the instructions contained a screenshot of the Decision Screen. —
In this case your valuation for obtaining two units of the good is 96. Your bid is 88. Important:
If you do not submit a bid within the prespecified time the computer will assign you a bid of 0.
When the time is elapsed you will see the Result Screen. (Notice that the numbers given in the screens serve illustrative purposes only.)
— Here the instructions contained a screenshot of the Result Screen of a winner.
—
>From the screen above you see that you submitted the highest bid. You obtain 2 units, realize a value of 96 and you pay 2 times the price of 40. Check that you earned 16 point.
— Here the instructions contained a screenshot of the Result Screen of a loser.
—
Here you see that the other buyer submitted the winning bid and you obtain only 1 unit of the good. You do not realize your value of 68 and you don’t have to pay the price for this unit. Therefore your income in this period is 0.
3
Collusion and Fights in an Experiment with
Price-Setting Firms and Production in Advance
153.1
Introduction
In the most prominent theoretical models of oligopolistic competition, going back to Cournot (1838), Bertrand (1883) and Edgeworth (1925), firms only make decisions on one variable: price or quantity. These models have proven to be extremely useful for the study of a large variety of issues. However, for a more complete view of imperfect competition one needs to go beyond this, since firms’ actual decision environments surely involve quite a number of dimensions. A natural step forward is to study situations in which firms decide on both price and quantity.
Competition in prices and quantities can be modeled in different ways. One of these ways is the ”supply function” approach proposed by Grossman (1981) and Hart (1982). Herefirms’ strategies consist in complete functions of price-quantity pairs. The outcomes of market competition are the equilibria in supply functions; production is to order so that there is neither over nor underproduction.
Kreps & Scheinkman (1983) approached price-quantity competition using a two stage model in which firms decide on capacities first and then compete in prices. They solved the problem of inexistence of equilibrium in the so called Bertrand-Edgeworth model in which due to capacity restrictions there is no equilibrium in pure strategies. In their game
firms actuallyfirst decide on capacities and then on prices. This two stage structure plus a surplus-maximizing rationing rule yields Cournot outcomes [Kreps & Scheinkman (1983), Vives (1993)].
A simpler more direct way of representing price-quantity competition is to let firms decide on price and quantity combinations where the quantities have to be produced in
advance and the demand buys from the cheapest producer(s). This is characteristic of many retail markets. The fact that total production can now be larger than total sales raises the question of what happens with the overproduced quantity. Underproduction also needs to be taken into consideration. The produced good may be completely perish-able or not. If the good is of some durability, then unsold production may be carried over from one production period to another one implying a dynamic situation. Theoretically, thefirst case has been studied by Maskin (1986) and Friedman (1988) and the second by Judd (1990).
Experimentally, price-quantity competition with advance production of a perishable good has been studied by Mestelman and Welland (1988). They investigate the effects of advance production in posted price and double auction markets with the kind of demand and supply functions with multiple steps that are standard in experimental economics. They compare the performance of the posted price institution with and without advance production and find that for the first case price and efficiency levels are both somewhat lower than in the second case. However, even with advance production, after 15 trading rounds both prices and the distribution of the surplus are very close to the ones corre-sponding to the Walrasian outcome. Mestelman and Welland (1991) study the case with advance production and inventory carryover and find similar results as for a perishable good.
In this paper we study the performance of experimental markets with posted prices and advance production of a perishable good with simple demand and cost schedules. The simulated demand has a ”box-shape”, i.e. it is willing to buy a constant maximum quantity for any price up to a maximum. Firms have identical constant marginal costs and a capacity limit. As shown below, this simplified structure facilitates the theoretical analysis and the comparison to previous results with other market rules.
used as benchmarks in the context of the analysis of oligopoly. Our results provide an experimental benchmark for price-quantity competition.
Second, we want to study the impact of the number of firms on market outcomes, specifically on price and efficiency levels and on the distribution of the surplus between consumers and producers. For that purpose we compare experimental markets with two and three firms.
Third, we also study the evolution of behavior over time to shed light on how outcomes emerge as the result of the interaction process. In our experiments subjects interact with the same market throughout 50 rounds. This reflects the repeated interaction that takes place in actual oligopoly markets. It is also the way in which most, although not all, market experiments are conducted. We study how players adjust to others’ behavior over time and bring about the observed data patterns.
Our experiment is meant to be a contribution to a more general view of how imperfect competition over time relates to the equilibria of certain static games. Theoretical studies of dynamic oligopoly like those of Maskin and Tirole (1987, 1988) and Jun and Vives (1999) typically characterize equilibrium behavior in relation to the static Cournot and Bertrand equilibria. Our results will shed - from a different perspective - some additional light on the comparison between dynamic behavior and static predictions.
With our work we also wish to contribute to a more complete view of the impact of the number of firms on market performance in experimental imperfect competition environments. This issue is one of the central themes of the economic analysis of oligopoly and can be seen as transversal with respect to different specific oligopoly models. It has recently been analyzed in a number of experimental studies with different types of imperfect competition. Dufwenberg and Gneezy (2000) address this question for the case of Bertrand price competition among identical firms with constant marginal costs and inelastic demand. Their results are that prices are above marginal cost for the case of two
firms but equal to that cost for three and four firms.
have to serve the whole market; there are multiple equilibria with positive price-cost margins. The most frequently observed market price is invariant to the number of firms. However, average prices do decrease somewhat with the number of firms, due to the declining prevalence of collusion. Abbink and Brandts (2002b) study price competition under constant but uncertain marginal costs. In accordance with the theoretical prediction for this case, market prices decrease significantly with the number offirms but stay above marginal costs.
Numerous studies report experimental results on related issues from quantity com-petition environments. Huck, Normann and Oechssler (1999, 2001) provide results and a recent survey of work on the effects of market concentration under repeated quantity competition. Their conclusion is that duopolists sometimes manage to collude, but that in markets with more than three firms collusion is difficult. With exactly three firms, Offerman, Potters, and Sonnemans (2002) observe that market outcomes depend on the information environment: Firms collude when they are provided with information on individual quantities, but not individual profits. In many instances, total average out-put exceeds the Nash prediction and furthermore, these deviations are increasing in the number offirms. The price-cost margins found in experimental repeated quantity compe-tition are, hence, qualitatively consistent with the Cournot prediction for the static game. The study by Brandts, Pezanis-Christou and Schram (2003) includes evidence that shows that, under supply function competition, an increase in the number of firms leads to lower prices.
than to what price competition would yield. Behavior settles down at a price-quantity configuration which is not an equilibrium.
All this is somewhat reminiscent of the view proposed by Chamberlin (1962) for the case of markets in which firms face each other repeatedly. He thought that for the case of few sellers behavior follows from the very structure of the industry. In Chamberlin (1962), p. 48, he states: ”If each one [seller] seeks its maximum profit rationally and intelligently, he will realize that when there are two or a few sellers his own move has a considerable effect upon his competitors, and that this makes it idle to suppose that they will accept without retaliation the losses he forces upon them. Since the results of a cut by any one is inevitably to decrease its own profits, no one will cut, and, although the sellers are entirely independent, the equilibrium result is the same as though there were a monopolistic agreement between them”.In the process of fighting that we observe in our data, firms realize how disadvantageous this behavior is and learn to avoid it.
In Section 2 we discuss our basic set-up choices and present some theoretical consid-erations for the game we study. In Section 3 we present design details and explain the experimental procedures. Section 4 presents our results. There are three appendixes. Appendix A contains the instructions, Appendix B includes Overall Tables and Appendix C contains graphs for all experimental markets in both treatments.
3.2
Basic Set-up and Theoretical Considerations
In our game, the demand is willing to buy any amount of the good up to a quantity ofqmax
at a constant maximum price of 100. This kind of ’box’ demand schedule has previously been used for the study of double auctions by Holt, Langan and Villamil (1986) and more recently by Dufwenberg and Gneezy (2000) for the study of Bertrand competition. The buyer auction studied in Roth et al. (1991) has very similar features. This simple set-up has several advantages which will become clear below. We conducted experimental sessions with two and three firms, with qmax being 100 in the first case and, to allow for
Each of the nfirms has the capacity of producing integer quantities up to 100 units at a constant marginal cost of 50 with no fixed costs. Eachfirm can serve the whole demand at marginal cost, just as typically assumed for standard price or quantity competition.
Firms simultaneously and independently decide on production quantities and on prices between 0 and 100. Once the production decisions are made, the quantities are produced instantaneously and the corresponding costs are incurred. Eachfirm offers all its produced units at the same price. It is as if they attached a label with the price on each unit of output. One can think of this situation as one in which two factories produce a perishable good like, say, yogurt and send it to the supermarket at a predecided price.
Given the shape of the demand, if total production is less or equal thanqmax all units
are sold regardless of prices. If total production is higher thanqmax, then sales will depend
on the prices set by the different producers. Taking the case of threefirms, then if all three prices are different from each other the demand simply goes from lower to higher prices and keeps purchasing until it reaches qmax = 100; due to the type of demand schedule no
rationing rule is needed. Some of the units of the highest price firm will remain unsold and are lost, since the good is completely perishable. There are several other possibilities in which two of the firms set the same price, which is different from the one set by the third firm. If two firms set the same price which is lower than the one of the third firm and the sum of the produced quantities of the two firms is smaller than 102, then we are, in essence, in the same situation as when all three prices are different from each other. The twofirms with the lowest price both sell their whole production and some of the units of the high price firm will not be sold.
If all three prices are the same, then consumers will buy from the different firms in proportion to the produced quantities: If the three firms have produced quantitiesq1, q2
andq3 thenfirm i will have sales ofsi = q1+qq2i+q3 ∗102 and the rest of the units offirm i’s produced units will remain unsold, i= 1,2,3.
of the two low-price firms are q1 and q2, then the sales of firmi will besi = q1q+iq2 ∗102, i = 1,2; the high-price firm sells nothing. If two firms set the same price which is higher than the one of the remaining firm, then the same proportionality rule applies as in the previous case to the quantity that still can be sold after the low-price firms has sold all its production, i.e. if q1 and q2 are now the quantities of the two high-price firms and
q3 corresponds to the one low-price firm, then the sales of the two first firms will be
qi
q1+q2(102−q3), i= 1,2.
Note that in the Box Design PQ Game pure price competition would be predicted to yield prices equal to marginal cost. In fact the study by Dufwenberg and Gneezy (2000) referred to above deals precisely with the case of a box-demand. In contrast pure quantity competition would lead, in the Cournot equilibrium, to the monopoly price equal to the demand’s reservation value. We are not aware of any quantity competition experimental study with this kind of demand. However, it is known - see Huck et al. (2004) - that in experimental studies of this type the stage-game Nash equilibrium is a good predictor of behavior.
In contrast, for the price-quantity competition we consider, there exists no equilibrium in pure strategies. We present the reasoning for twofirms; it can be easily generalized for any number of firms greater than two.
100
q p
10 50
100
q p
10 50
Figures 1 and 2. Jumping-Up
first that ifq¯1+ ¯q2 < qmaxthen the strategy of any of the players is (weakly) dominated by
a strategy in which the produced amount equalsqmax, i.e. at any price between 50 and 100
both firms would benefit from expanding their production until joint production reaches qmax. If q¯1 + ¯q2 > qmax then each of the players has an incentive to reduce production.
This is so, because of the unit cost being 50, which is equal to the highest possible profit per unit. Due to the proportionality rules a reduction of production by one unit leads to a reduction in sales of less than one unit; foregone unit profits are hence less than 50 while saved costs are 50. If unit costs were zero firms would have an incentive to always throw their total capacity on the market. Our parameter choices can, hence, be expected to lead to the simple situation in which production ends up being equal to sales.
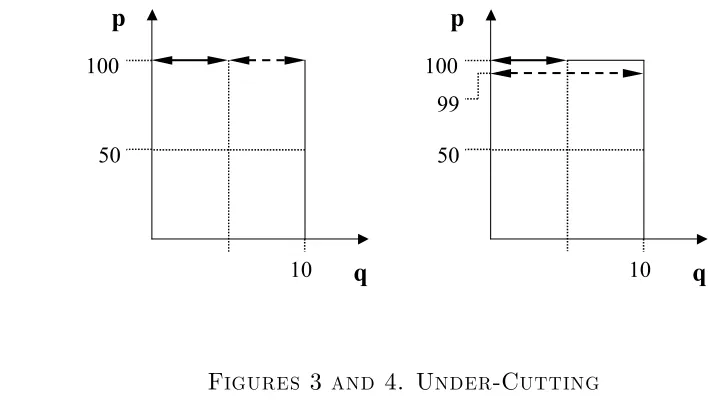
Now to prices. Observe first that if a firm’s price is below 100 and is producing a positive amount then a unilateral increase in price will always be profitable (see the ”jumping up” in Figures 1 and 2). This is illustrated by the contrast between Figures 1 and 2, where in Figure 1 we have chosen to represent both firms producing the same quantity at marginal cost. A unilateral increase of firms 2’s price leads to the positive profit represented by the shaded area. Atp1 =p2 = 100there is no possibility of unilateral
price increases, but in this case unilateral under-cutting and expansion production toqmax
will always be profitable for at least one of thefirms, since the demand will only buy from thefirm with the lower price. For instance, if s1 = 49ands2 = 51, then the undercutting
to a price of 99 with a simultaneous production expansion to 100 will be profitable for either firm (see Figures 3 and 4).
This only stops being true for firms with very high sales, the threshold being at 98 units. If a firm sells 99 or 100 units then undercutting will not be profitable, since in that case the firm is already a virtual monopolist. But, of course, in this case it is the other firm that will have a strong incentive to undercut. There is no equilibrium in pure actions.16
Since the game actually played in the experiments is finite, we know that there does
16If the market is shared 50-50 at a price of 51, there are no incentives to undercut, and at a price of
exist an equilibrium in mixed strategies. With respect to that, note that the payoffmatrix of the game has (101×101)2 cells, so that mixing would be over the two variables. We
will not consider the mixed strategy equilibrium. Indeed, as with applications to many other real contexts, taking it in account would not be very natural in our context. In addition, even a large experiment does not generate enough data to reliably check the use of such a strategy.
Up to this point we have analyzed the one shot game. In our experiments we run 50 periods, our game is finitely repeated. Applying backwards induction we have the same lack of equilibrium in pure strategies. However some experimental results (see Selten, Mitzkewitz and Uhlich (1997)), claim that people actually behave like in an infinitely repeated game when the number of periods is large enough and the end of the game is far away.17 If we think of our game as an infinitely repeated one, any result can be maintained in time if δ, the discount factor, is high enough. In particular cooperation, to share the market at the monopolistic price could be maintained until a few periods before the last one. In the theoretical approach the threat that maintains collusion is typically considered to be Nash reversion, but in looser, broader terms one may think of the threat being any kind offight for the market. We will get back to this issue when we discuss the results.
100
q p
10 50
99 100
q p
[image:41.595.125.482.505.712.2]10 50
Figures 3 and 4. Under-Cutting
3.3
Experimental design
We obtained data from two experimental treatments. One with two firms (hereafter, 2F) and another one with three firms (hereafter, 3F).18 In treatment 2F eachfirm chooses a quantity between 0 and 100 and one price (expressed in ECUs, Experimental Currency Units) also between 0 and 100. There is a constant cost of 50 ECUs per unit produced. Treatment 3F only differs in the number offirms and in that they can choose production levels from 0 to 102.19
To accommodate losses we granted subjects an initial capital balance of 20,000 ECUs. If a firm lost more than this starting money it was considered bankrupted and forced to abandon the market. However, to preserve anonymity subjects that went bankrupt were asked to remain in their place until the end of the experimental session. Bankruptcies did actually occur in both our treatments so that monopolies appeared in 2F and doupolies and monopolies appeared in 3F. We will elaborate on this in the experimental results section.
As mentioned above fixed markets of subjects interacted in the same market during 50 rounds to represent the repeated nature of oligopolistic interaction. We conducted 14 markets of the 2F treatment and 9 markets of the 3F treatment. Below we consider each separate market to be one independent observation.
We ran all the experiments in the ”LeeX” (Laboratori d’Economia Experimental) at Universitat Pompeu Fabra in Barcelona during the second half of the year 2002. The experiments were programmed using Urs Fischbacher’s zTree toolbox. The total earnings of a subject from participating in this experiment were equal to his capital balance plus the sum of all the profits he made during the experiment minus the sum of his losses. We paid to each subject 2 EUR as a show-up fee and their profits at the rate of 2 cents of Euro per 100 ECU earned. Experiments lasted approximately one hour and a half. Average earnings in the experiment were 16.5 EUR.
3.4
Experimental results
Figure 5 shows for both treatments the evolution of average weighted market prices, defined as the average of prices at which units have been sold weighted by their respective market shares20. These averages include prices from all markets, among them those in which firms went bankrupt. Below we will distinguish between behavior in markets with and without bankruptcies. Observe first that for both the cases of two and of threefirms average weighted prices are evidently much closer to the quantity competition Cournot equilibrium than to the price competition Bertrand equilibrium. Prices actually appear to tend to the highest possible one. Stage-game equilibrium analysis does not suggest this, but - after the fact - it may appear quite plausible that a reduced number of firms is able to establish high prices in a situation of (albeit, finitely) repeated interaction. Below we elaborate on how these prices come about.
Note first that the prices shown in Figure 5 exhibit upward trends; for n=2 prices stabilize after fifteen periods whereas for n=3 the trend appears to continue for a longer interval. Prices are about 50% higher in final rounds than in early ones. one can see that experiments with fewer rounds would have given an inappropriate impression of behavior for this kind of interaction.
20For tehcnical reasons, we had to end one of the sessions of the 2F treatment in round 47. For thsi